The Periodical: 9th September 2022
Cryptocurrency and stockmarkets spring from likely 80 day nominal lows, Gold and Silver continue collapse with trough soon and currencies in general continue to be smashed by a surging dollar
Chart Highlight: USDJPY

Round Up
The last few weeks have been tantalising, with both phasing analyses in Stockmarkets and Cryptocurrency needing resolution at the shorter term scale. We have been adamant that the previous 80 day trough iteration occurred around the middle of July and this is now likely the correct assessment, given the most recent strong bounce of the last few days.
Bitcoin and Cryptocurrency in general is either making the 18 month nominal low here or has one more 80 day component iteration to come (@ 55 days). Price should make a more marked interaction (support) with the 54 month FLD (orange) for the larger low in our opinion. It may well do this is a sideways grinding fashion via the current 80 day component. The focus at that point then moves to observing (and trading) the move up, assessing evidence as to the magnitude of the low and the possibility that it is the 54 month nominal trough. Bearish sentiment for cryptocurrency is high in the media and traditional financial outlets. Indeed the Fed’s top man, Jerome Powell, dismissed Bitcoin yesterday as ‘backed by nothing’. If ever there was a bullish macro signal…
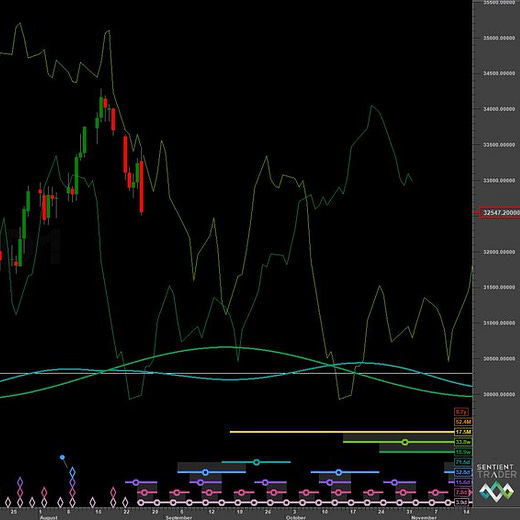
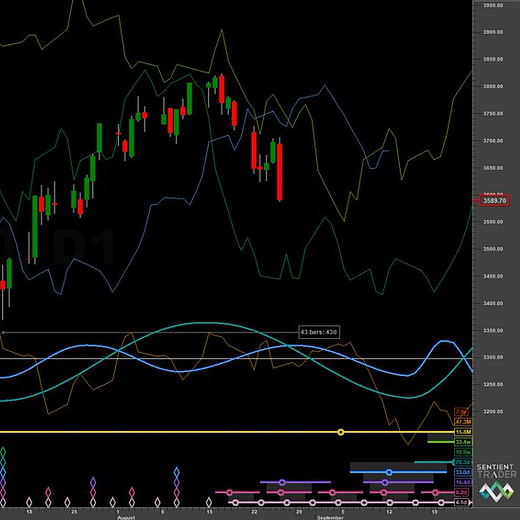
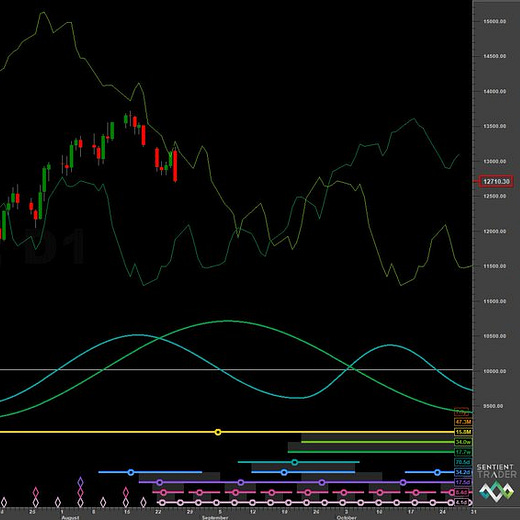
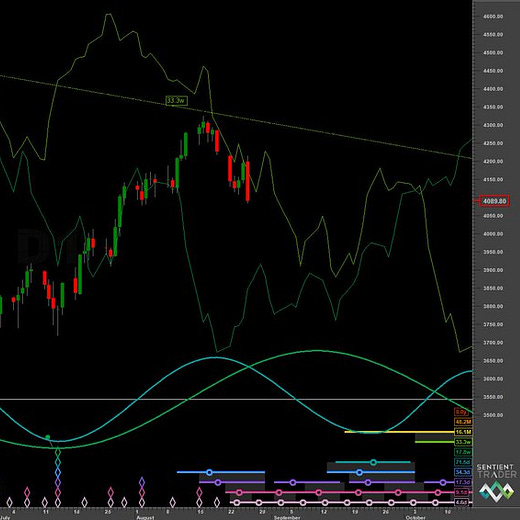
Stockmarkets have come down to what is likely the latest 80 day low iteration with all finding resistance at the 40 week FLD in the process:
One of the very most important aspects of trading with Hurst cycles is to use ‘The principle of commonality’. I see this so often with new students of time series analysis in financial markets. They will concentrate on one instrument obsessively and often misplace cycle lows (or peaks) causing confusion down the line as the wavelength stretches beyond reasonable frequency modulation. Commonality is useful because it collects any and all periodic components present in similar markets and produces a ‘phase clustering’ effect, increasing the signal to noise ratio. In this case the EUSTOXX and other European markets made a strong case for the previous 80 day component low to be mid July, forecasting the present trough we are bouncing out of at the correct timezone. There was also evidence from cryptocurrency. The same can be applied to currency and metals markets. Take advantage of this in your phasing analysis.
In the precious metals both Gold and Silver continue the bearish decline that was kicked off via the 40 week component peak back in March of this year. That peak was also likely an 18 month nominal crest. Whilst there are signs that the latest 80 day component trough could well be in, the recent bounce it is a little early. A trader asked me about this earlier in the week and my approach in this case, given the fact we also expect the trough to be of 20 week magnitude (at least), is to wait for the next 20 day component trough. At that point whether it is a higher or lower low, it will resolve the position of the 80 day component trough.
Energy markets continue to be vibrant. Oil, which peaked back in March from the 54 month component, has rolled over and is accelerating in it’s decline. A recent 20 week component low has produced a very weak bounce, breaching the proposed low within the first 40 day component. The 18 month nominal low is due late in 2022 according to current phasing. US Natural Gas has exploded in amplitude from the most recent 80 day iteration but has recently come back to our target of around 8 and the 80 day FLD. A 40 week nominal low is due here and, given the nature of the last 80 day component, could produce a rapid bounce above previous highs.
In the currency markets it is the dollar that is dominating once again, with cogent periodicity in the USDJPY and DXY. USDCAD has been excellent once again, hitting targets of 1.3 via an outstanding signal at the 80 day component level.

The dollar will start to begin the peaking process of the 54 month component over the next year or so. One of the first beneficiaries of this (temporarily at first) will be the EURUSD and GBPUSD, both of which are approaching troughs of 40 week magnitude. Watch out for financial commentators attributing the rise to only raised interest rates.
Twitter Highlight
One of the most beautiful signals of recent years is currently present in Gold and Silver with the 80 day nominal component running at around 55 days. Undoubtedly the signal is clean thanks to the relatively neutral influence of larger components over the sample period. This, in turn, producing an overall ‘sideways’ look to price action:


