

USDCAD: Hurst Cycles - 12th August 2022
The 80 day component in USDCAD continues to provide good trading signals with a target of 1.3 achieved from the June low. Now price approaches a 20 week low. We look at the price action from here.

Tools required: Nominal Model | FLD | FLD Trading Strategy | FLD Trading Strategy (Advanced) | Principle of Nominality | Underlying Trend
Analysis Summary
USDCAD made an 80 day nominal low on June 8th before moving up to test the 80 day FLD and achieve targets of 1.295-1.3, described on our last report of 1st June. Subsequently price has moved back down to what is phased to be a 20 week nominal low, shown on all charts below.
From June 1st Report:
We should expect price to test the 80 day and 20 week nominal FLD peaks around 1.3. Price has the potential to move higher from there or the next 20 week nominal low, due in August.
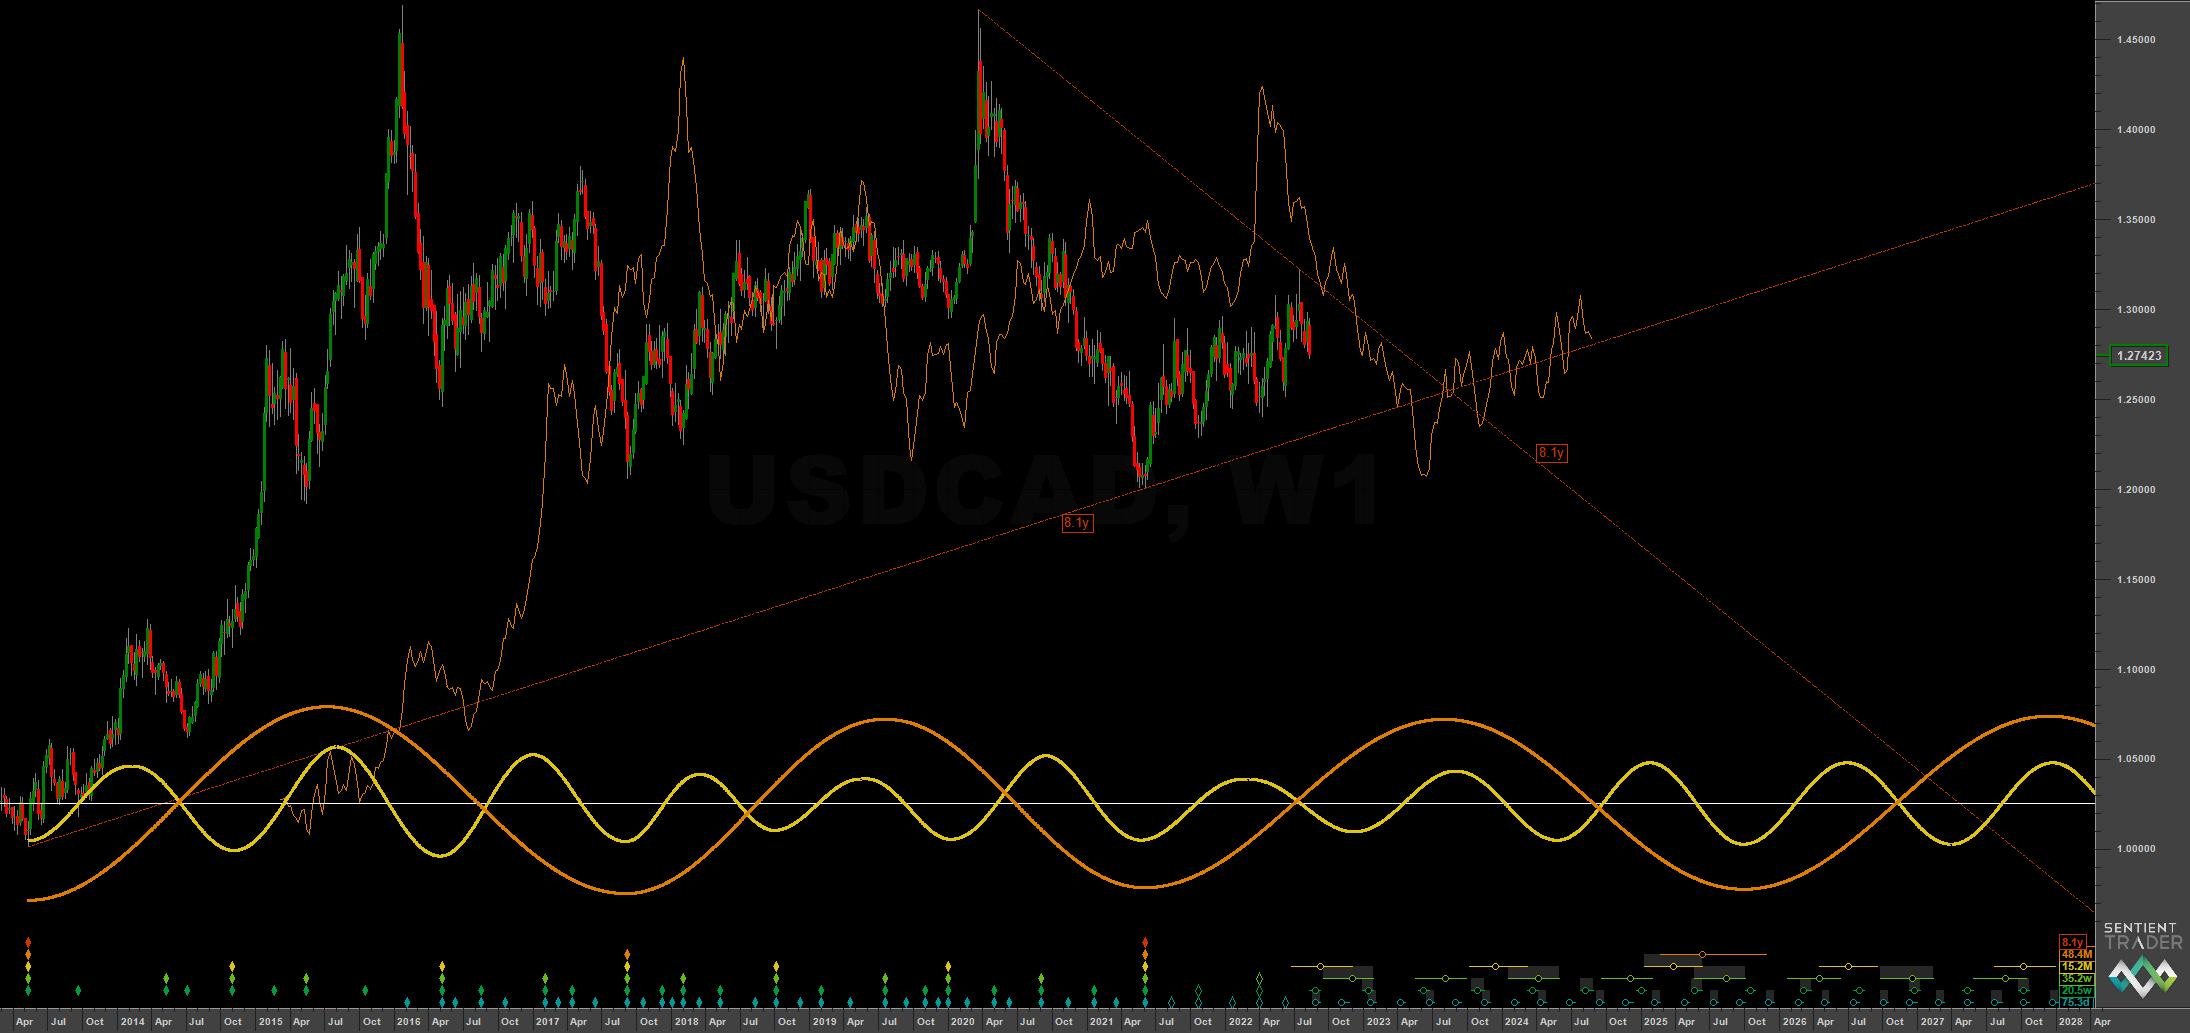
Readers will also note that the 9 year nominal low in the long term chart below, alluded to in the last report, has now been placed at the large trough in June 2021. Although largely academic, this brings commonality to USDCAD and other USD pairs in addition to correlation with the current phasing of DXY.
At the long term scale price is ostensibly grinding up and sideways from a low of 9 year magnitude in June 2021. The move has been relatively muted so far, especially relative to the Dollar Index, which shares commonality of frequency components. The next 18 month nominal low, due late 2022 /early 2023 according to the current phasing analysis, should be an excellent long opportunity. Clearly, however, the 9 year upward VTL (red on long term chart) must hold on a weekly basis.
We can expect some resistance at the 54 month FLD to mark the end of the sideways grinding period (orange, long term chart). Keen eyed Hurstonians will note the 18 month component is running faster than nominal at 15.2 months over the sample period here, giving the outside chance that the 20 week nominal low due imminently may also be of 18 month magnitude. This is an outlier possibility at this point with the visual clarity and periodicity of recent 40 week component iterations suggesting the larger low is to come late 2022.
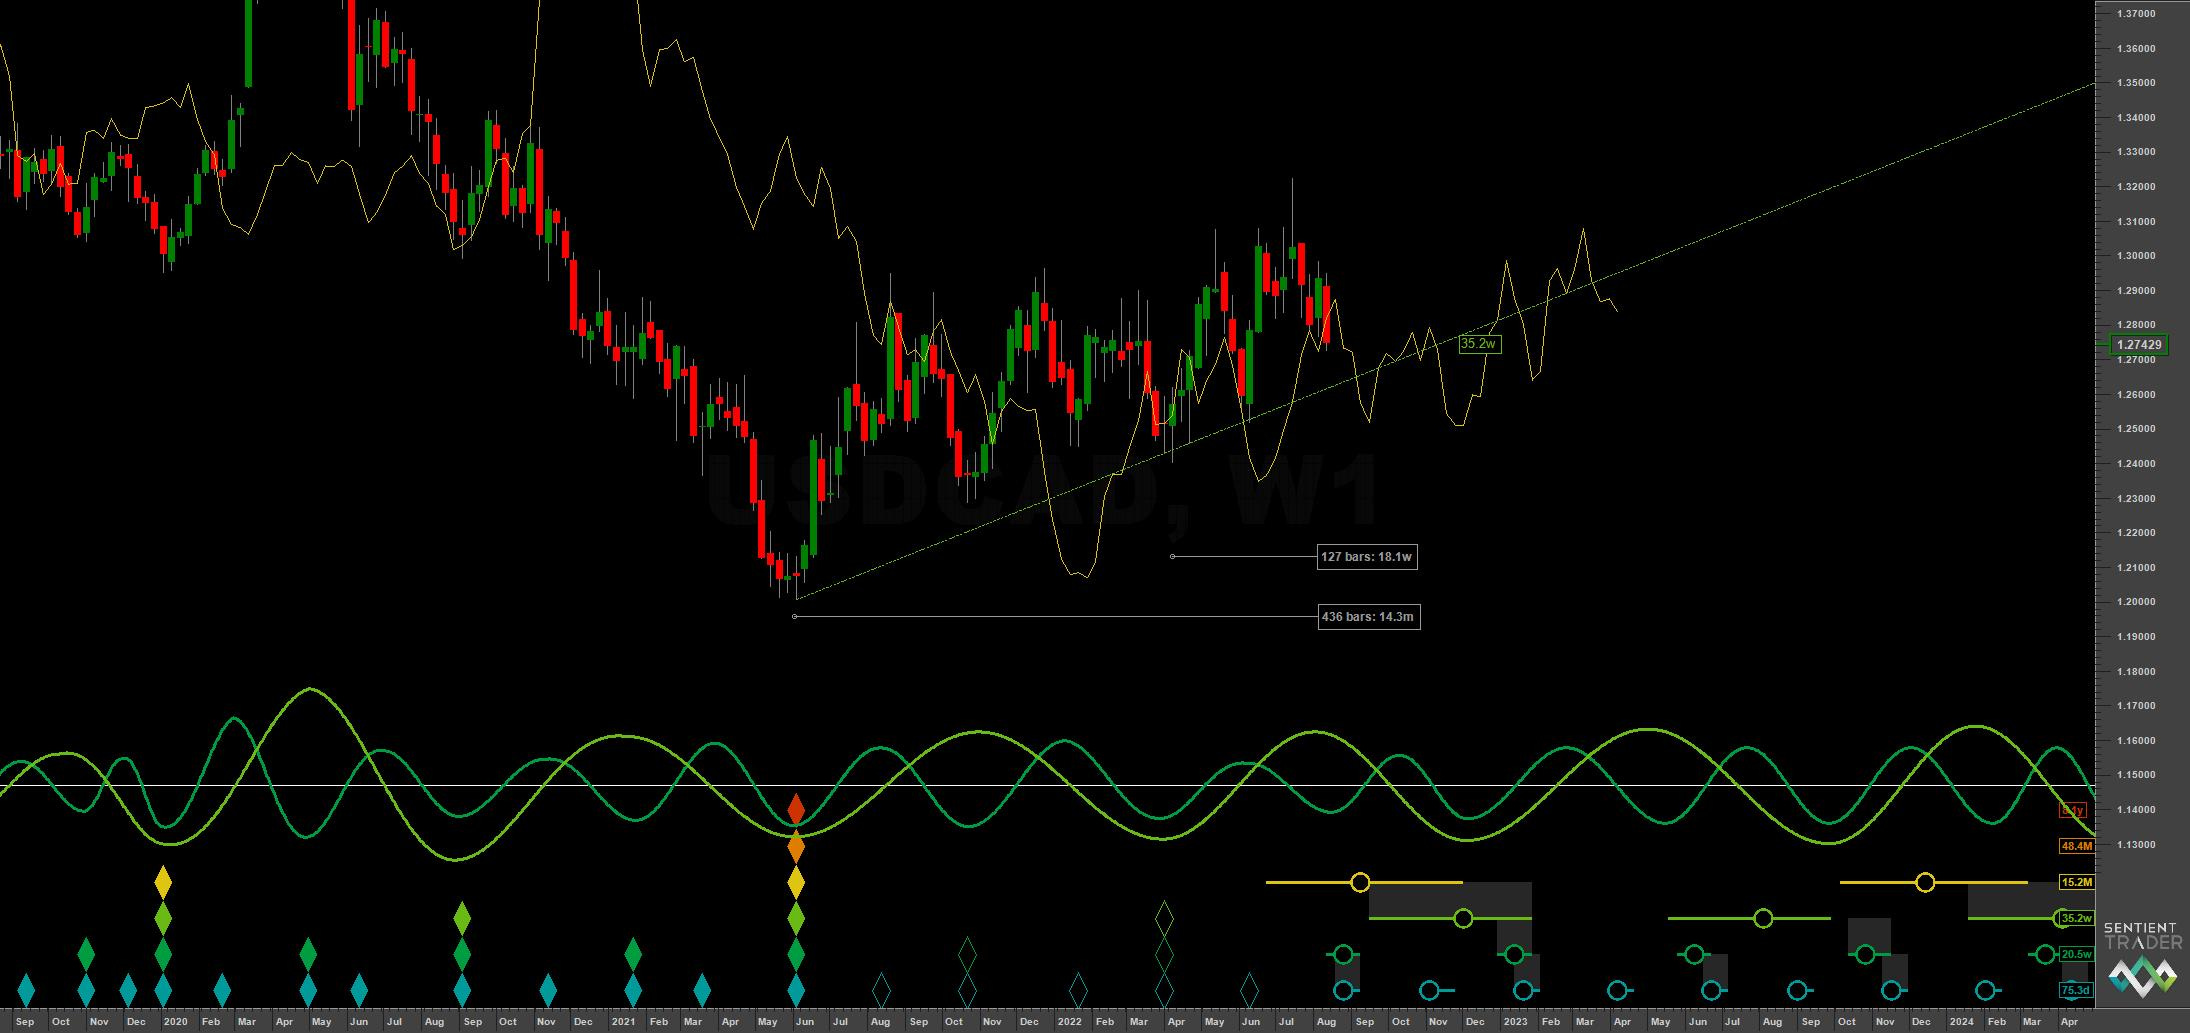
At the medium term the 40 week upward VTL and 20 week / 40 week FLD support at around 1.257 is a strong area of support and price may well test this area prior to the imminent 20 week nominal low. The larger trough due later in the year / early 2023 requires the 40 week VTL to be breached by median price so it would not be a surprise to at least see it tested here before bouncing and resuming the longer term sideways move for a few weeks.
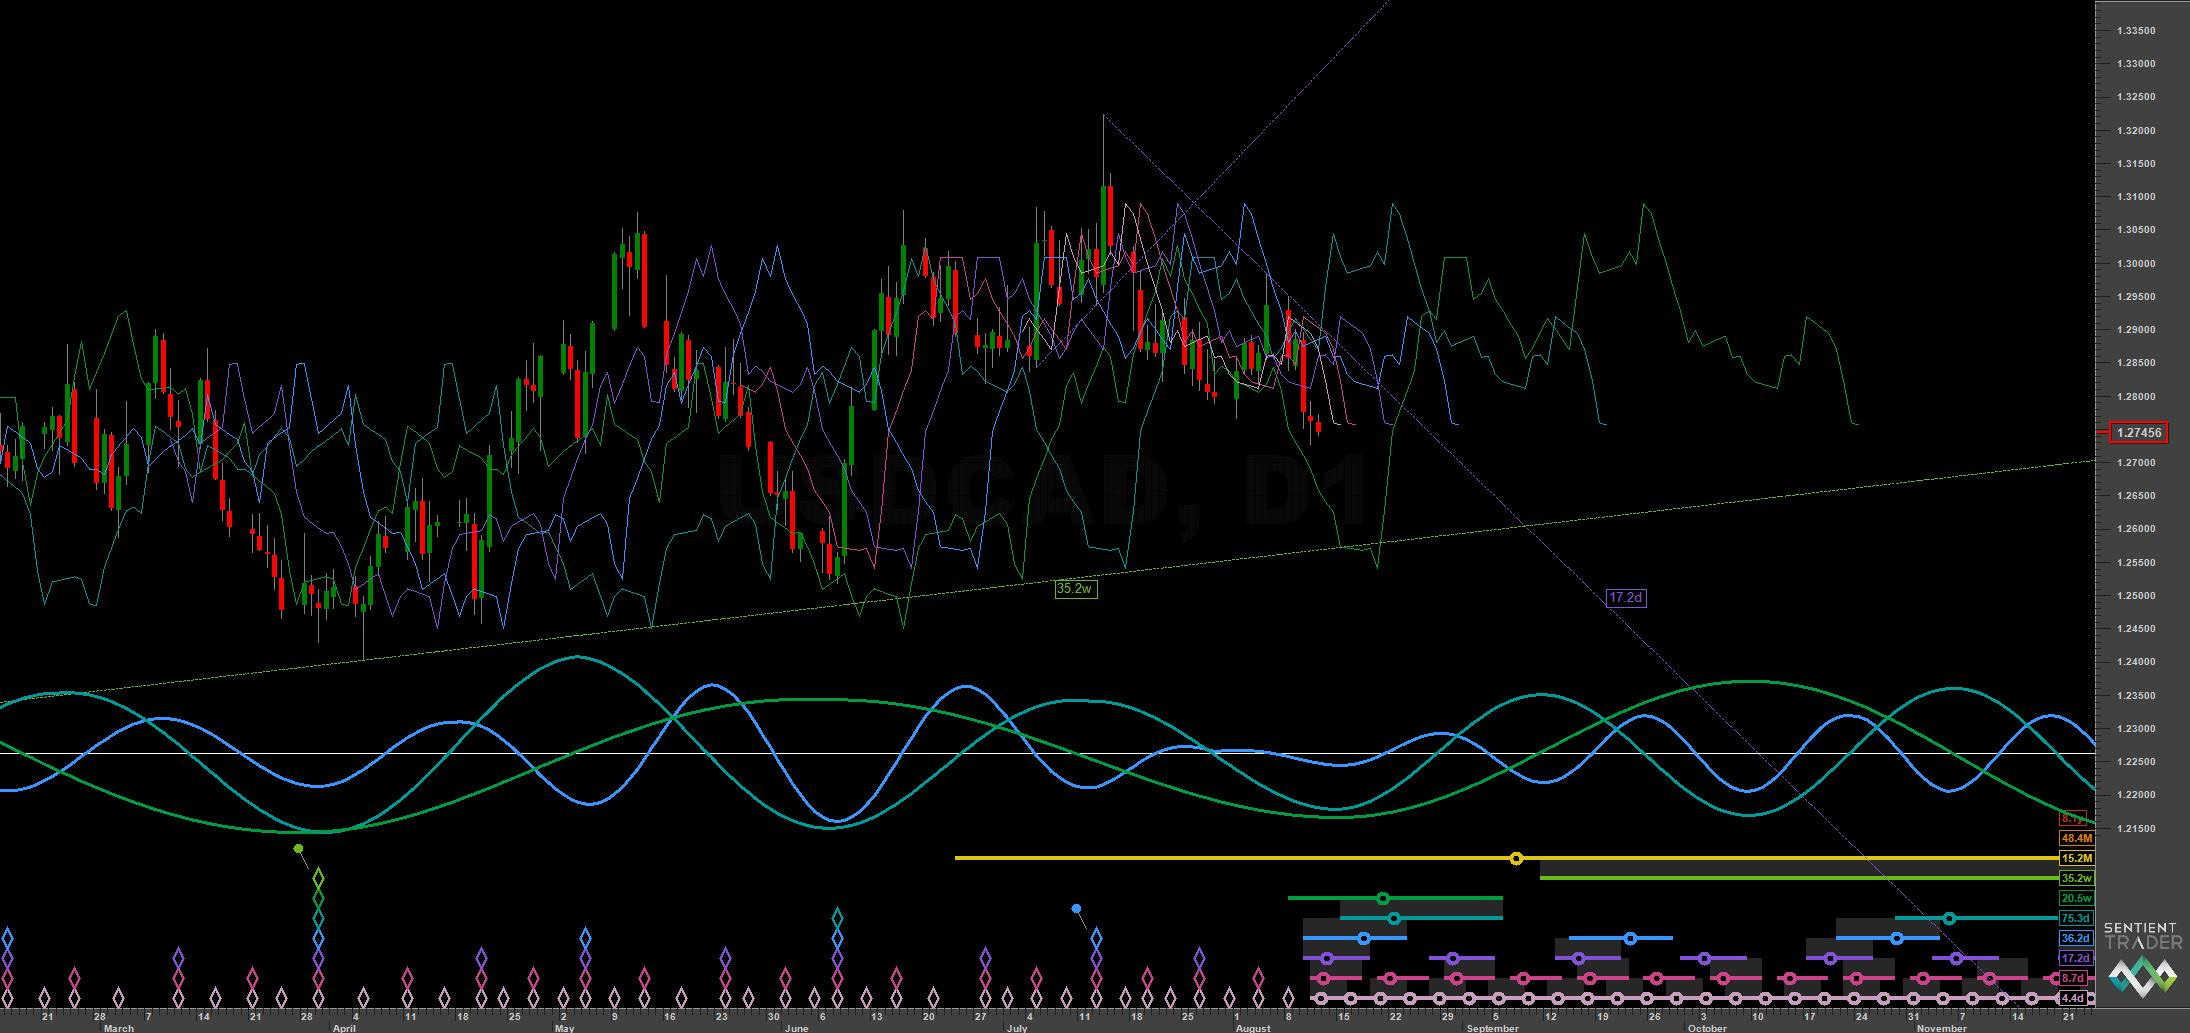
Short term the 80 day nominal component is, once again, exemplary. It is running at around 75 days from the analysis on Sentient Trader and our own bespoke time frequency analysis with minimal frequency modulation over the sample period. The strength of the signal here is due to the neutral underlying influence of larger components and the subsequent ‘sideways’ price action. This is permitting increased visual clarity and resolution of the 80 day component (and 20 week component), so long may it continue! So far, 65 days have elapsed in this current iteration, so we should be on alert for the trough and a retest of the 80 day FLD. This is expanded upon in the trading strategy below.
Phasing Analysis
Long Term
Components greater than and including the 18 month nominal cycle
Medium Term
Components less than and including the 18 month nominal cycle
Short Term
Components around the 80 day nominal cycle
Time Frequency
Wavelet convolution output targeting 80 day nominal component

Trading Strategy
Interaction Status
Interactions and price in the FLD Trading Strategy (Advanced). This looks at an idealised 40 week cycle and an array of 3 FLD signal cycles. We apply the instrument’s phasing to the model and arrive at an overall summary for the interactions with the 20 day FLD, current and forthcoming.

Sigma-L recommendation: Buy
Entry: 5 day FLD / VTL (risk on) / 10 day FLD
Stop: Below formed 80 day nominal low
Target: 1.29-1.3 (80 day FLD resistance)
Reference 20 Day FLD Interaction: A3
Underlying 40 Day FLD Status: A2
Underlying 80 Day FLD Status: E
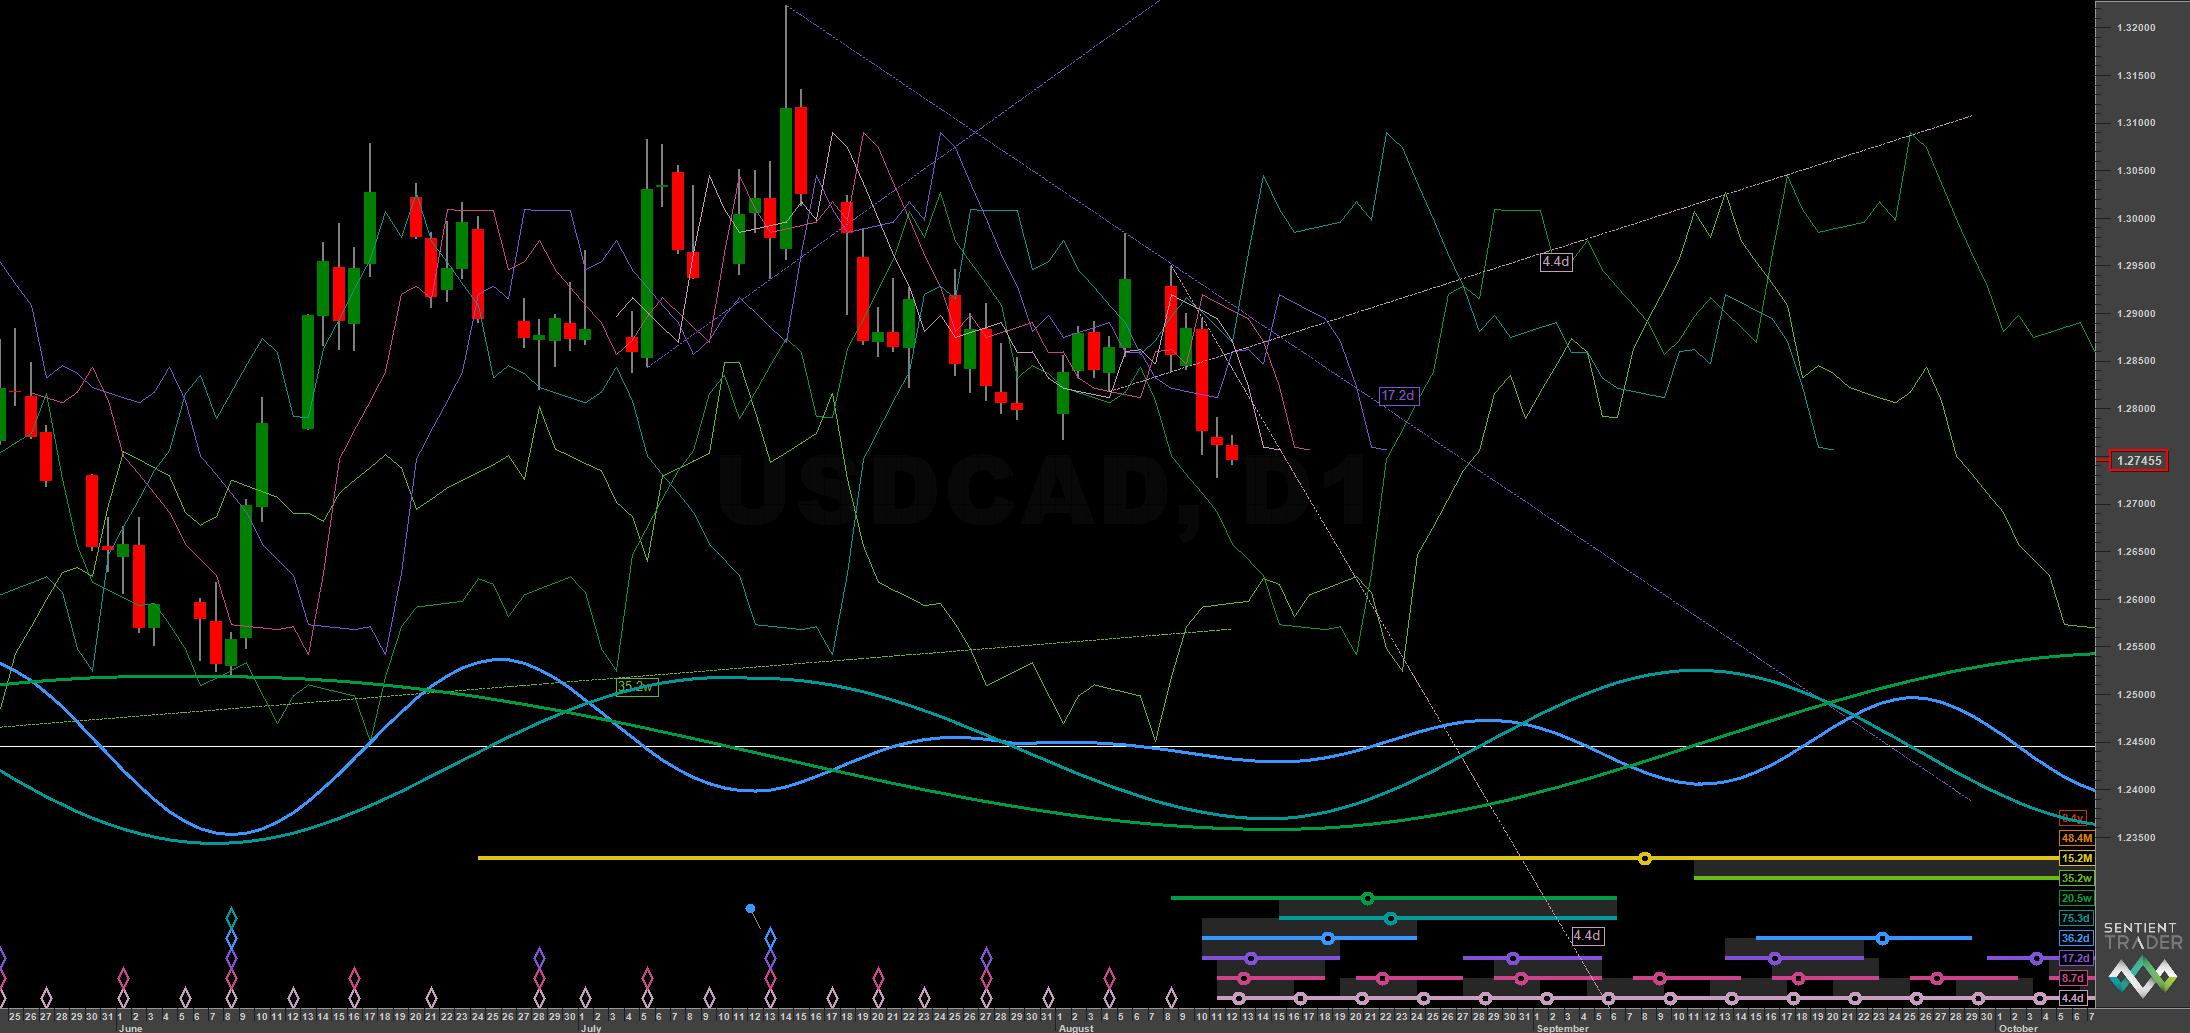
Price is currently under a fairly uneven bullish FLD cascade, indicating there may be further to fall for a better risk : reward trade long here. The strong support area, as described above, is the convergence of the 40 week upward VTL and 20 week / 40 week FLDs around 1.26, shown on the medium and short term charts.
Entries via the 5 or 10 day FLD are a valid choice here as price is very well along the wavelength of the average 80 day iteration, with the 5 day entry presenting more risk. Should price reach down to the 1.26 area there should be a better risk: reward ratio long trade available via a cross of the 10 day FLD. Indeed the 80 day FLD cross target, according to Sentient Trader at least, is 1.2529. It will be interesting to see whether that is achieved here.
At this stage of the 18 month component we should expect some resistance to price at the 80 day FLD in due course, at around 1.285-1.29. A move above the 80 day FLD to a cross target will suggest the underlying influence from the larger components is starting to influence price action more.
FLD Settings
If you do not have the use of Sentient Trader use these settings to plot FLDs in your trading software (daily scale) to more easily follow trading signals and strategy from Sigma-L.
Make sure to account for non-trading days if your broker omits them in the data feed (weekends, for example). The below offsets are given with no added calculation for non-trading days.
80 day nominal: 75.3 days | 37 day FLD offset
40 day nominal: 36.2 days | 18 day FLD offset
20 day nominal: 17.2 days | 9 day FLD offset
10 day nominal: 8.7 days | 4 day FLD offset