The Periodical: 25th November 2022
Stockmarkets surge after bullish momentum from an 18 month low in October. Crypto signals significant low while gold shows signs of life. Oil and gas cycle beautifully once more
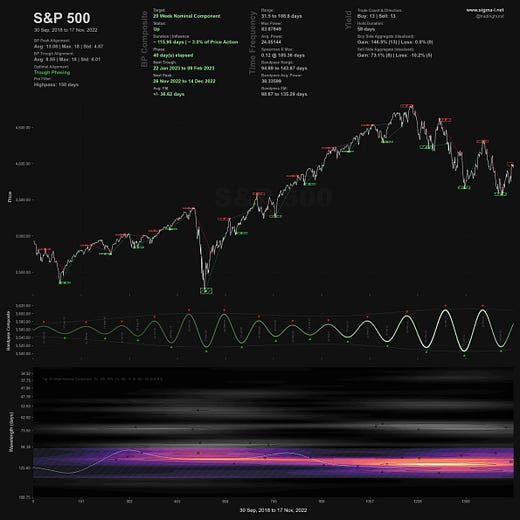
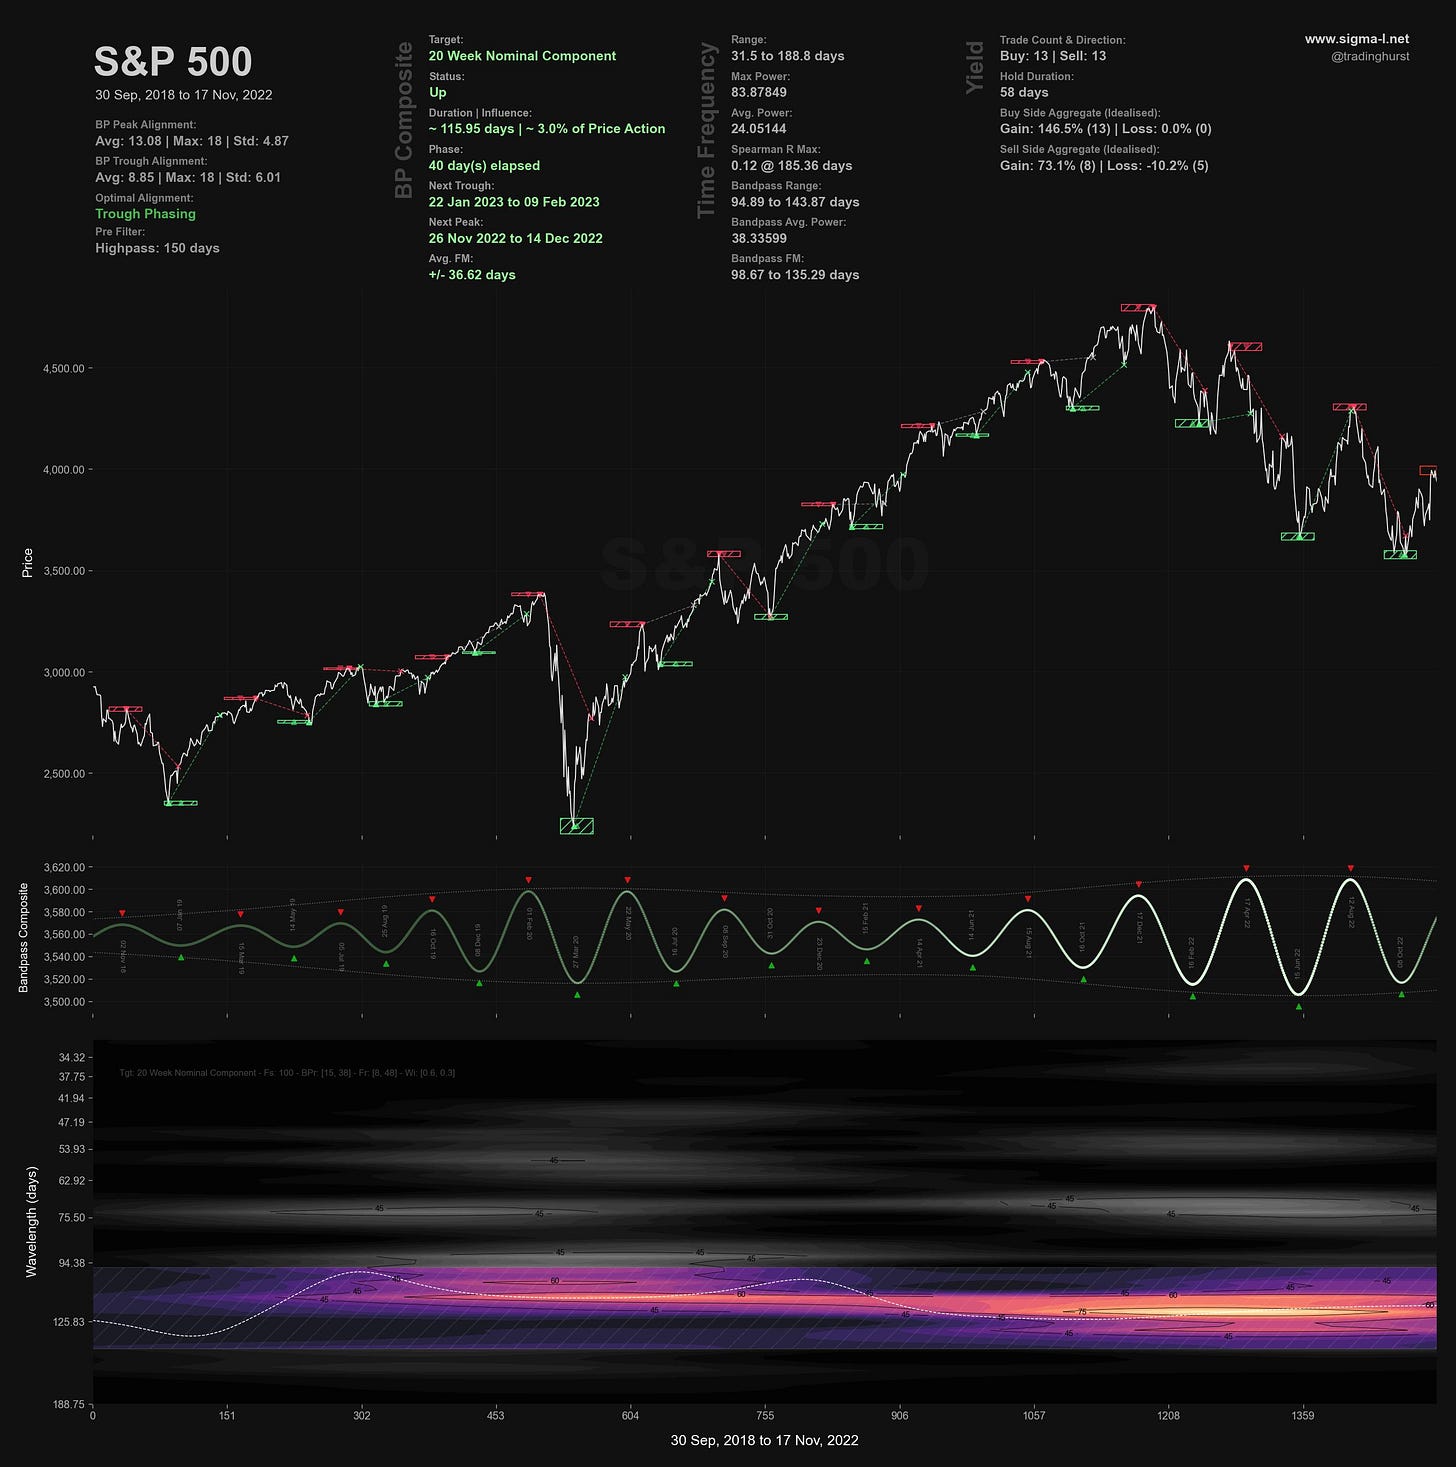
Chart Highlight: S&P 500
Round Up
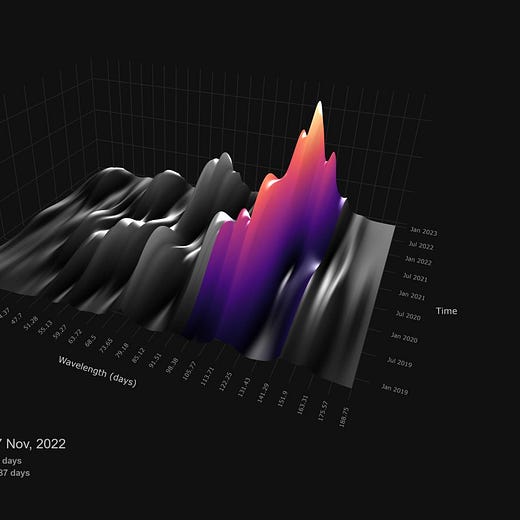
Stockmarkets have, in all likelyhood, formed an 18 month nominal low in October. The position of the low here is in line with the historical average of the 18 month component over the last few decades and reflects a slightly faster than nominal wavelength espoused by Hurst in his original nominal model. We have the tools and compute power at our disposal to really examine the true nature of periodic movement in financial markets, something Hurst did not, so we should always be open to model variation and mathematical evidence. The 20 week component, shown above, is one of the best features of all markets and I encourage readers to look at the markets they focus on, be they indices or constituents of those indices for evidence of this component. It is likely that we will see the peak of this component mid December. At the trough of the 20 week component, due early February 2023, we will have the first insight into 2023’s price action and the longer term component phase.
Cryptocurrency has, at least for the moment and at the smaller components, largely decoupled from equity markets. Whether this continues remains to be seen but the 18 month component, anticipated for several months on Sigma-L, is likely being established. Bitcoin is at the 4.5 year FLD support and should bounce strongly over the coming months. The correlation with equity markets at the longer scale dictates the bias we have for a larger low, currently favouring it to occur in 2024. As ever, smaller components, notably the 20 and 40 week waves will provide ample evidence, either way, as they unfold.
In forex both the GBPUSD and the EURUSD, correlated in their frequency components but slightly differing in amplitude, have climbed handsomely to 40 week FLD resistance. This will likely mark the peak of the 80 day component (~ 70-78 days) and possibly the 20 week component. This has all been against the backdrop of a weakening dollar, the phasing of which is becoming much more interesting as longer term components start to turn down.

In Gold and Silver we are waiting for confirmation of the 18 month component having occurred. The beacon like signal at around 55 days in Gold is also worth watching into December, being somewhat modulated in Silver and therefore less clear.


Finally, in the energy market, Oil and Gas have provided some of the best trades this quarter. A short from the 80 day nominal peak in early November a clear and classical Hurst style entry hitting the target of 78 this week. The longer term picture suggests a downside target from the 18 month FLD cross of around 50. The next bounce from a trough of the 80 day component is due soon and, should the longer term phasing be accurate, be suitably short lived. US Natural Gas has likely formed a tricky 40 week nominal low after another excellent short in mid October. A test of the area around 8 is likely prior to price peaking at the end of the 1st quarter 2023.
Twitter Highlight
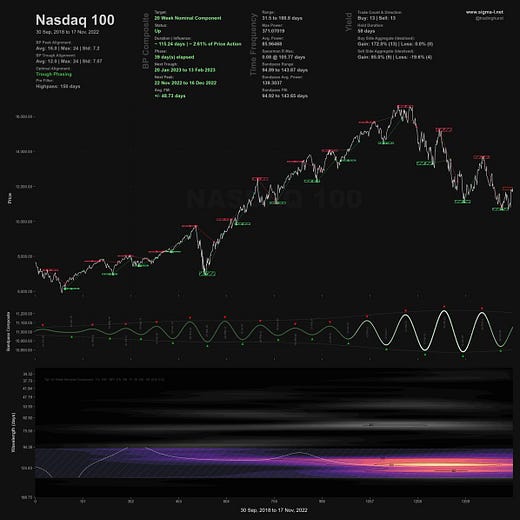
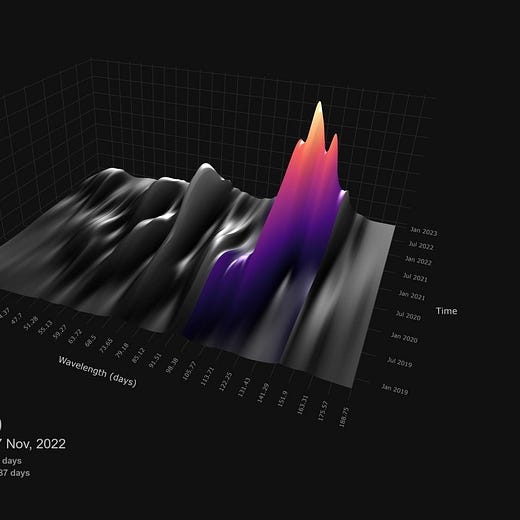
As we alluded to above, the 20 week component has been excellent in the S&P 500 for the last few years. But what about other global indices? A comparison between the SPX, Nasdaq and the Indian Nifty showed some very interesting results..


