Gold: Hurst Cycles - 21st November 2022
Gold launches in late September and late October from what is at least a 20 week nominal low. Is it also the 18 month nominal trough? We look at the evidence in this report and options going forward
Tools required: Nominal Model | FLD | FLD Trading Strategy | FLD Trading Strategy (Advanced) | Principle of Nominality | Underlying Trend
Analysis Summary
Evidence is building in Gold for the case of an 18 month nominal component trough iteration at the most recent 20 week nominal low, late September. In our last report we speculated on that possibility with a noted 20 week ‘margin of error’ built into the thinking:
From 16th September Report:
At the longer term phasing it is quite possible that the 18 month component low is going to occur here, in addition to what is at least a 20 week nominal component. This is the beauty of Hurst Cycles of course, one can be uncertain about a magnitude of a trough but aligned on direction. Only amplitude will differ. It really rests on the phasing of previous 18 month component lows, notably that of November 2019 and March 2021. Whilst this is not our primary phasing, readers should be aware of this possibility, which is more likely than a far outlier, given the difference in phasing is a margin of error at 20 week duration.
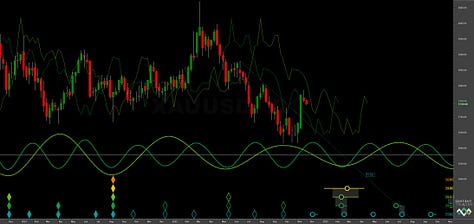
Whilst price easily met our target of 1720 from the low in September, it has been the almost vertical launch out of the low in October that has started to bias our thoughts to placing the 18 month component around this most recent collection of lows. We can begin to clarify the low by watching the next 80 day component trough, due in early December according to Sentient Trader, at least…
What is fascinating here is that the Sentient trader analysis (via the less than rigorous pattern recognition technique) is providing a compelling summary of the 80 day component at around 72 days, in stark contrast to the excellent signal from the time frequency analysis of around 55 days. How can this contrasting wavelength be rationalised? One valid and logical answer is that the 18 month component is too long in the Sentient trader analysis.
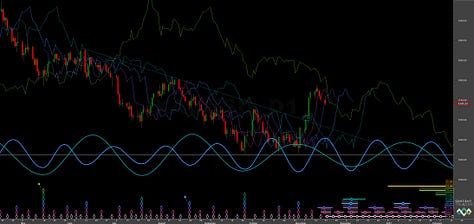
A longer term sweep using time frequency tools reveals what is likely the 18 month ‘nominal’ component from 2004, occurring at a wavelength of around 14.2 months. This is a good signal, the only area of uncertainty occurring around 2017-2018 when the component is largely flat. Interestingly too, the average frequency modulation across this component (and over 15+ iterations) is around 120 days, roughly that of a 20 week component!
What does this mean in practice going forward? Well, the higher probability strategy is to wait for the 20 week component low, due late January 2023. Should that low be a higher low, it is highly likely the trough that formed around late September-October is of 18 month magnitude, in line with the historical wavelength of this component. We can then adjust the phasing in Sentient Trader to reflect this.
At the short term price is likely peaking from the 80 day nominal component and is, in general, finding resistance here at the 40 week FLD. The next iteration of the trough of this component is due in either early December (Sentient Trader) or toward the end of December (time frequency).
Phasing Analysis
Sentient Trader
Utilising a pattern recognition algorithm and Hurst’s diamond notation


Time Frequency Analysis
Wavelet convolution targeting 80 day and 18 month nominal components


Trading Strategy
Interaction Status
Interactions and price in the FLD Trading Strategy (Advanced). This looks at an idealised 40 week cycle and an array of 3 FLD signal cycles. We apply the instrument’s phasing to the model and arrive at an overall summary for the interactions with the 20 day FLD, current and forthcoming.
Sigma-L recommendation: Neutral / No Trade
Entry: n/a
Stop: n/a
Target: n/a
Reference 20 Day FLD Interaction: n/a
Underlying 40 Day FLD Status: n/a
Underlying 80 Day FLD Status: n/a
Sidelining short trades is well advised at this point whilst uncertainties resolve around the longer component. Risk on traders may wish to enter long early December, noting and preferring the Sentient Trader analysis of the 80 day component in isolation.
Should the 18 month component have formed there will be long trade opportunities ahead in early 2023. The most notable of which would be the next 20 week low iteration. Should that begin to form a higher low that it would be a high probability long. That low, according to Sentient Trader and our time frequency analysis, is due mid January to early February.
We will be watching this market closely, along with silver and copper (which is somewhat correlated).
FLD Settings
If you do not have the use of Sentient Trader use these settings to plot common FLDs in your trading software (daily scale) to more easily follow trading signals and strategy from Sigma-L.
Make sure to account for non-trading days if your broker omits them in the data feed (weekends, for example). The below offsets are given with no added calculation for non-trading days.
80 day nominal: 71.8 days | 36 day FLD offset
40 day nominal: 35.2 days | 17 day FLD offset
20 day nominal: 17.2 days | 9 day FLD offset
10 day nominal: 8.6 days | 4 day FLD offset
Correlated Exposure
A non exhaustive list of correlated instruments for consideration
SPDR Gold Shares iShares Gold Trust IAU 0.00%↑
SPDR Gold MiniShares Trust GLDM 0.00%↑
Aberdeen Physical Gold Shares ETF SGOL 0.00%↑
Granite Shares Gold Shares BAR 0.00%↑
VanEck Merk Gold Trust OUNZ 0.00%↑
Goldman Sachs Physical Gold ETF AAAU 0.00%↑
ProShares Ultra Gold UGL 0.00%↑
Invesco DB Precious Metals Fund DBP 0.00%↑
Invesco DB Gold Fund DGL 0.00%↑
wShares Enhanced Gold ETF WGLD 0.00%↑
Barrick Gold Corporation GOLD 0.00%↑
Newmont Goldcorp NEM 0.00%↑
Wheaton Precious Metals WPM 0.00%↑
VanEck Junior Gold Miners ETF GDXJ 0.00%↑
VanEck Gold Miners ETF GDX 0.00%↑
Franklin Responsibly Sourced Gold ETF FGLD 0.00%↑
Amplify Pure Junior Gold Miners ETF JGLD 0.00%↑


