The Periodical: 15th July 2022
Equities and cryptocurrency grind to imminent lows of at least 20 week magnitude, Oil reveals bearish cracks and EURUSD / GBPUSD approach 80 day nominal troughs
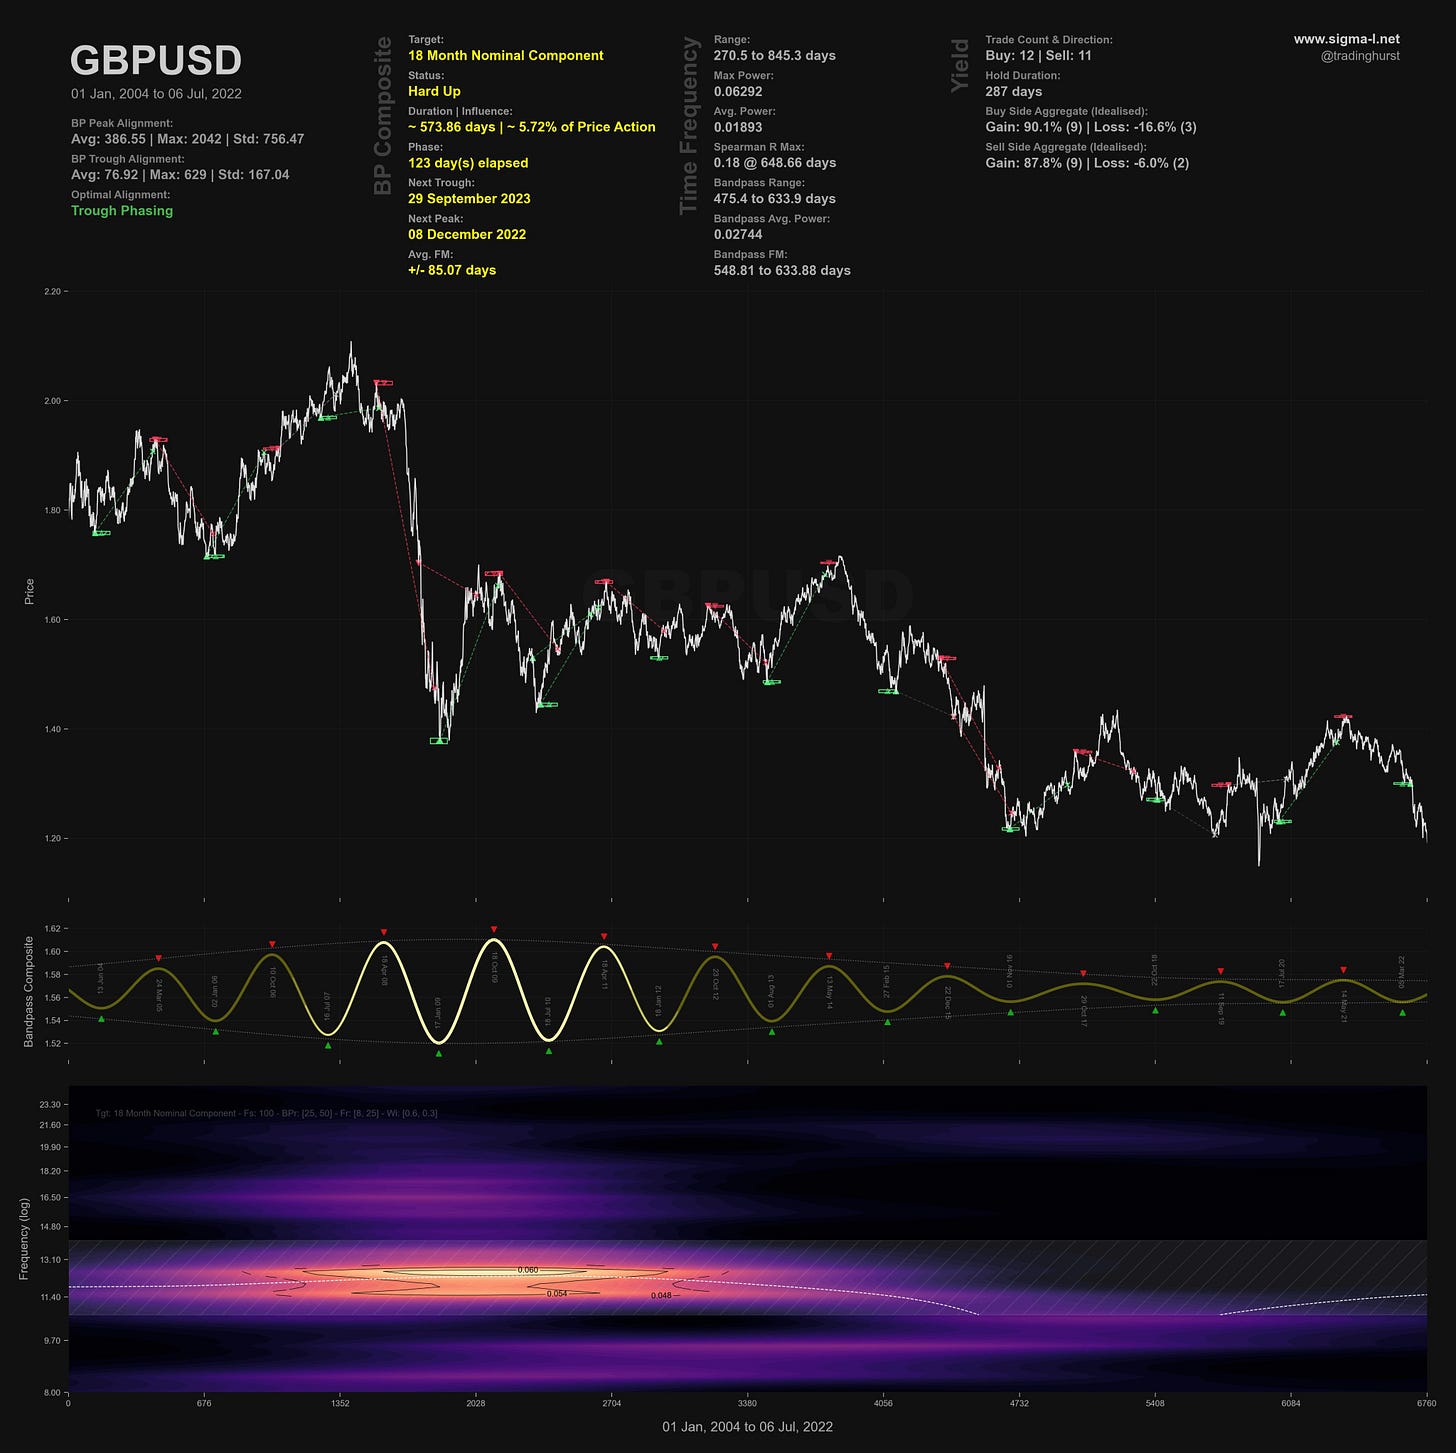
Chart Highlight: GBPUSD

Round Up
Recent weeks have seen us focus closely on cryptocurrency, stockmarkets and the energy sector. Certainly in the first two of those markets bearish pressure is waning and we have at least a 20 week nominal low to look forward to imminently. The mainstream media is, as always at market lows, replete with articles on crashing prices, most notably (gleefully?) in cryptocurrency. An excellent signal in itself for evidence to start dusting off the long positions.
In the Bitcoin analysis price has moved sideways for weeks, likely in the final 40 day component of at least a 20 week component, due to trough very soon. The same is also true of the highly correlated Ethereum. As mentioned countless times on this site and elsewhere, it is tremendously useful to be aware of correlation in periodic components and non-correlation in volatility (amplitude) of those components. Yields are much higher (in fiat currency terms) in some of the periodically correlated altcoins due to the differences in amplitude modulation. Think about this as a strategy when cycle lows or peaks are forthcoming across the main driving instruments in a sector.
The analysis in WTI Crude has highlighted for some time the waning bullish momentum as the 4.5 year component, which bottomed in 2020, starts to roll over. In all markets a large component that is peaking will, at first, neutrally affect price as it’s power is largely flat. This allows the smaller wavelength components to become more visually apparent, displaying the kind of distribution pattern and sideways volatility so evident around large cycle peaks and troughs. Subsequent to the net neutral effect is, of course, a reverse of the trend. This is now what is happening in the oil market, the first evidence of which was the recent breaching of the 80 day component low within the first 20 day iteration at the start of July. US Natural Gas is a tremendous phasing, recently moving out of it’s 80 day nominal low. Bearish traders can look forward to more downside as price moves to a 40 week nominal low in late August. That being subsequent to the current move from the 80 day nominal low (64.8 days sample average) peaking out, likely around late July.
The DJIA, S&P 500 and FTSE are all finishing off 20 week cycle components (at least), with a possible final capitulation low to come in the next week or so. The move out of that low will define whether the 18 month nominal low is to come at the end of the year or in Q1 2023.
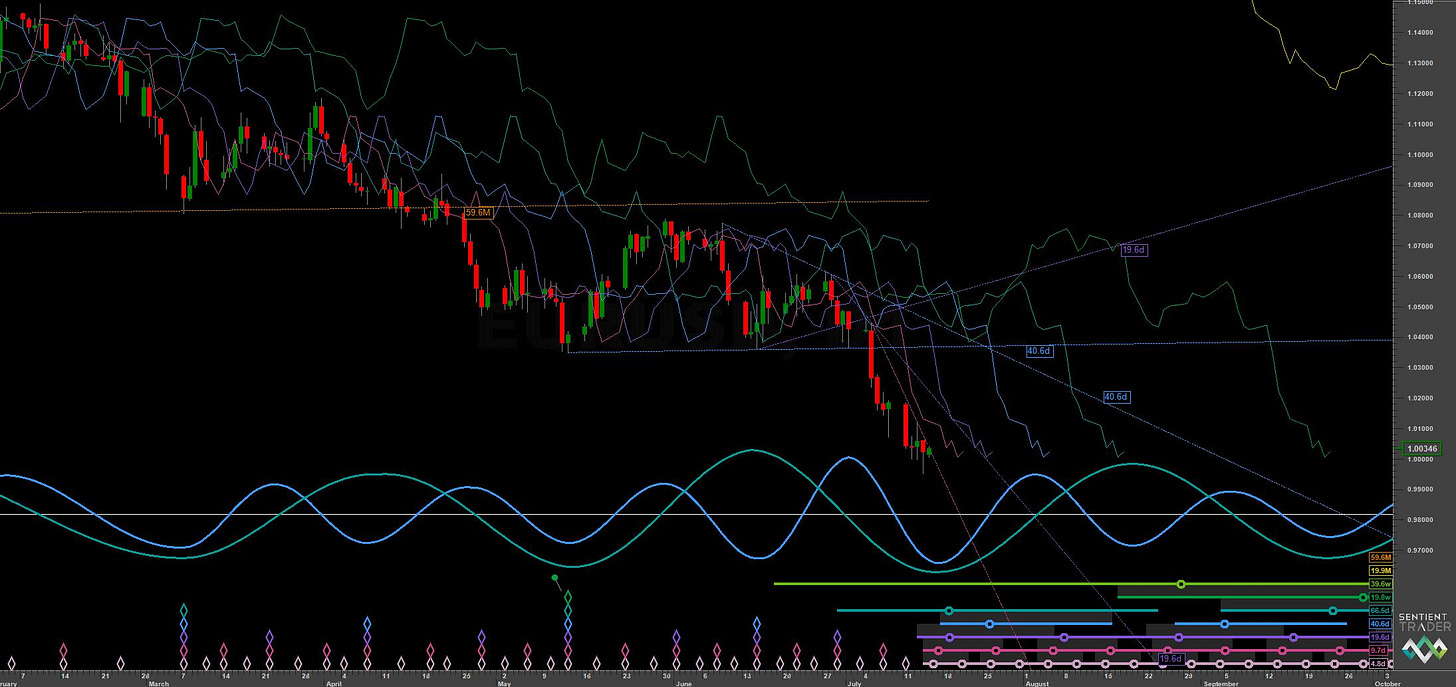
Of note in wider currency markets are the EURUSD and GBPUSD, both about to make 80 day nominal lows. Both currencies are worryingly bearish at the long term scale, shown notably with sterling above. Some short term relief for the Euro, currently around parity with the dollar, is near.


