

USDCAD: Market Cycles - 9th March 2023
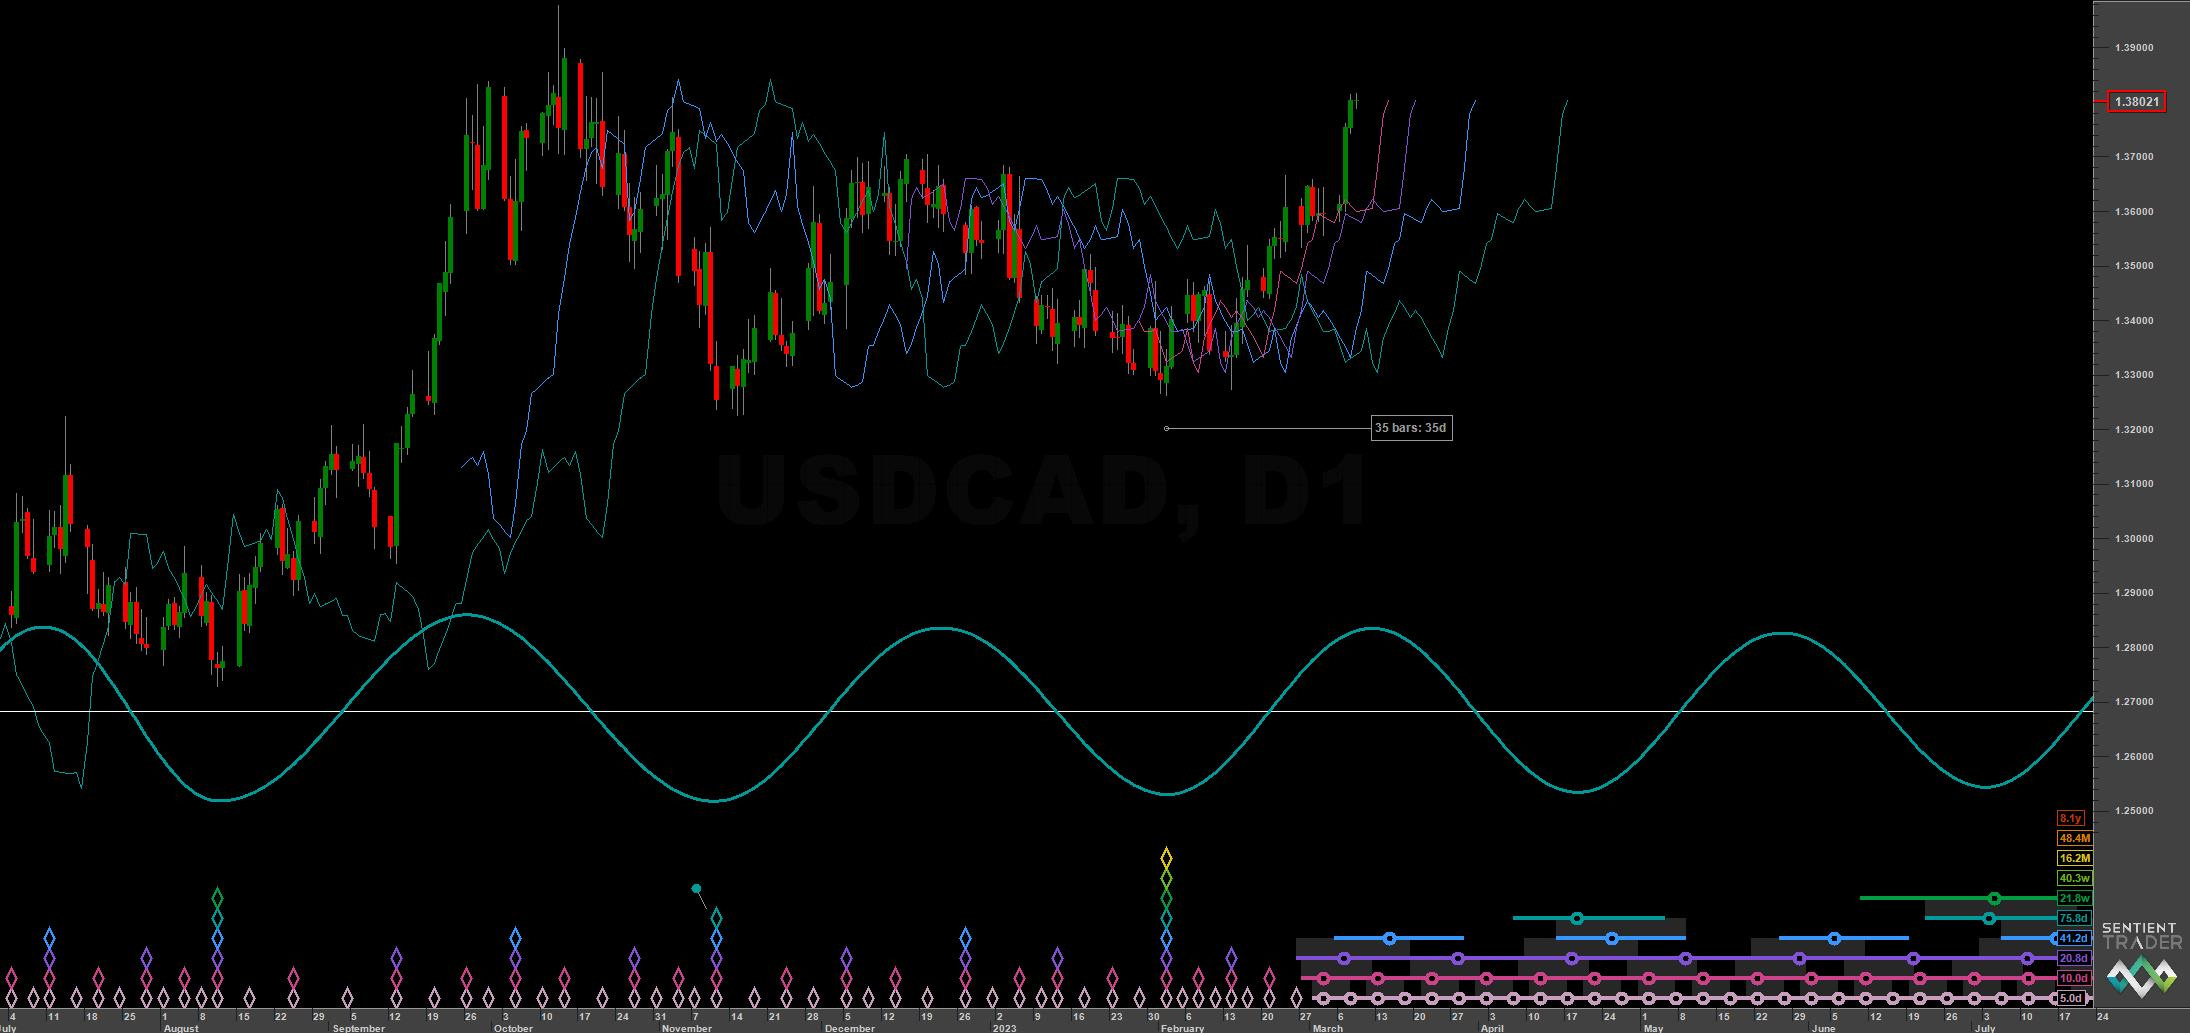
Targets of 1.36 are met thanks to the almost metronomic accuracy of the 80 day nominal wave. Price reaches up to the 1.39 target and is due a peak imminently. We look at the next moves in this report

Essentials: Nominal Model | FLD | FLD Trading Strategy | FLD Trading Strategy (Advanced) | Principle of Nominality | Underlying Trend | Time Frequency Analysis
Analysis Summary
Vying for the crown of the best periodic signal in markets currently is the outstanding 80 day ‘nominal’ component in USDCAD. Running at around 72-78 days average wavelength and remarkably stationary across a prolonged period. If any candidate is to displace the current ‘beacon’ king of signals in Gold it is this particular signal. The recent upside acceleration in price action, after many months of gentle updrift, via the 18 month component trough, has yet to substantially attenuate the shorter signal, shown in the short term TFA below.
Our upside target of 1.36 from the last report was met and exceeded. Price is, at the time of writing, approaching the secondary target around 1.39 and peaking from the 80 day wave within the next week or two. A later price peak (relative to the cycle peak) will betray the influence of the 18 month component. However, previous crests of this component have been so remarkably reliable (in terms of timing with the cycle peak) it would be a surprise to see a markedly late price crest.
Longer term, the component around 19 months will be pushing up for some time to come, peaking toward the last quarter of 2023 and due it’s next low mid 2024 . This will also be a trough of the larger component - notionally the 4.5 year wave.
Phasing Analysis
Long Term
Components including and longer than the 18 month nominal wave


Medium Term
Components between the 20 week to 18 month nominal wave

Short Term
Components shorter than the 20 week nominal wave

Trading Strategy
Interaction Status
Interactions and price in the FLD Trading Strategy (Advanced). This looks at an idealised 40 week cycle and an array of 3 FLD signal cycles. We apply the instrument’s phasing to the model and arrive at an overall summary for the interactions with the 20 day FLD, current and forthcoming.

Sigma-L recommendation: Risk Sell
Entry: 10 Day FLD / 20 Day FLD
Stop: Above forming 80 day component peak
Target: 1.36 (80 day FLD support) / 1.34 (20 week FLD support)
Time Target: 20th April 2023 (+- 4 days) (80 day component)
Reference 20 Day FLD Interaction: F
Underlying 40 Day FLD Status: D
Underlying 80 Day FLD Status: B
Assuming the 18 month component has occurred and the excellent signal around the 80 day nominal component is going to continue it’s stationarity, a peak based short is worth looking at here. Obvious support is the 80 day FLD around 1.36 but watch for price tracking the 40 week FLD (shown on ST long term chart above) all the way to the 20 week FLD at 1.34.
We have also added a time target here (perhaps an ongoing feature?) which reflects a time target to hold a position for, rather than a price target. This is a trading based extraction of the ‘time’ part of a ‘time-frequency’ analysis. Note the frequency modulation of around 4 days each side of the target date represents an exceptionally low level of modulation (principle of variation) - such is the nature of this excellent 80 day ‘nominal’ wave signal.
FLD Settings
If you do not have the use of Sentient Trader use these settings to plot common FLDs in your trading software (daily scale) to more easily follow trading signals and strategy from Sigma-L.
Make sure to account for non-trading days if your broker omits them in the data feed (weekends, for example). The below offsets are given with no added calculation for non-trading days.
80 day nominal: 75.8 days | 38 day FLD offset
40 day nominal: 41.2 days | 21 day FLD offset
20 day nominal: 20.8 days | 10 day FLD offset
10 day nominal: 10 days | 5 day FLD offset