

Gold - Market Cycles - 16th February 2023
Gold completes the 20 week nominal peak (at least) and hits our target of 1850 in a relatively standard bearish retrace. The 'beacon' component at 55 days is now due a trough, read on for more detail.

Analysis Summary
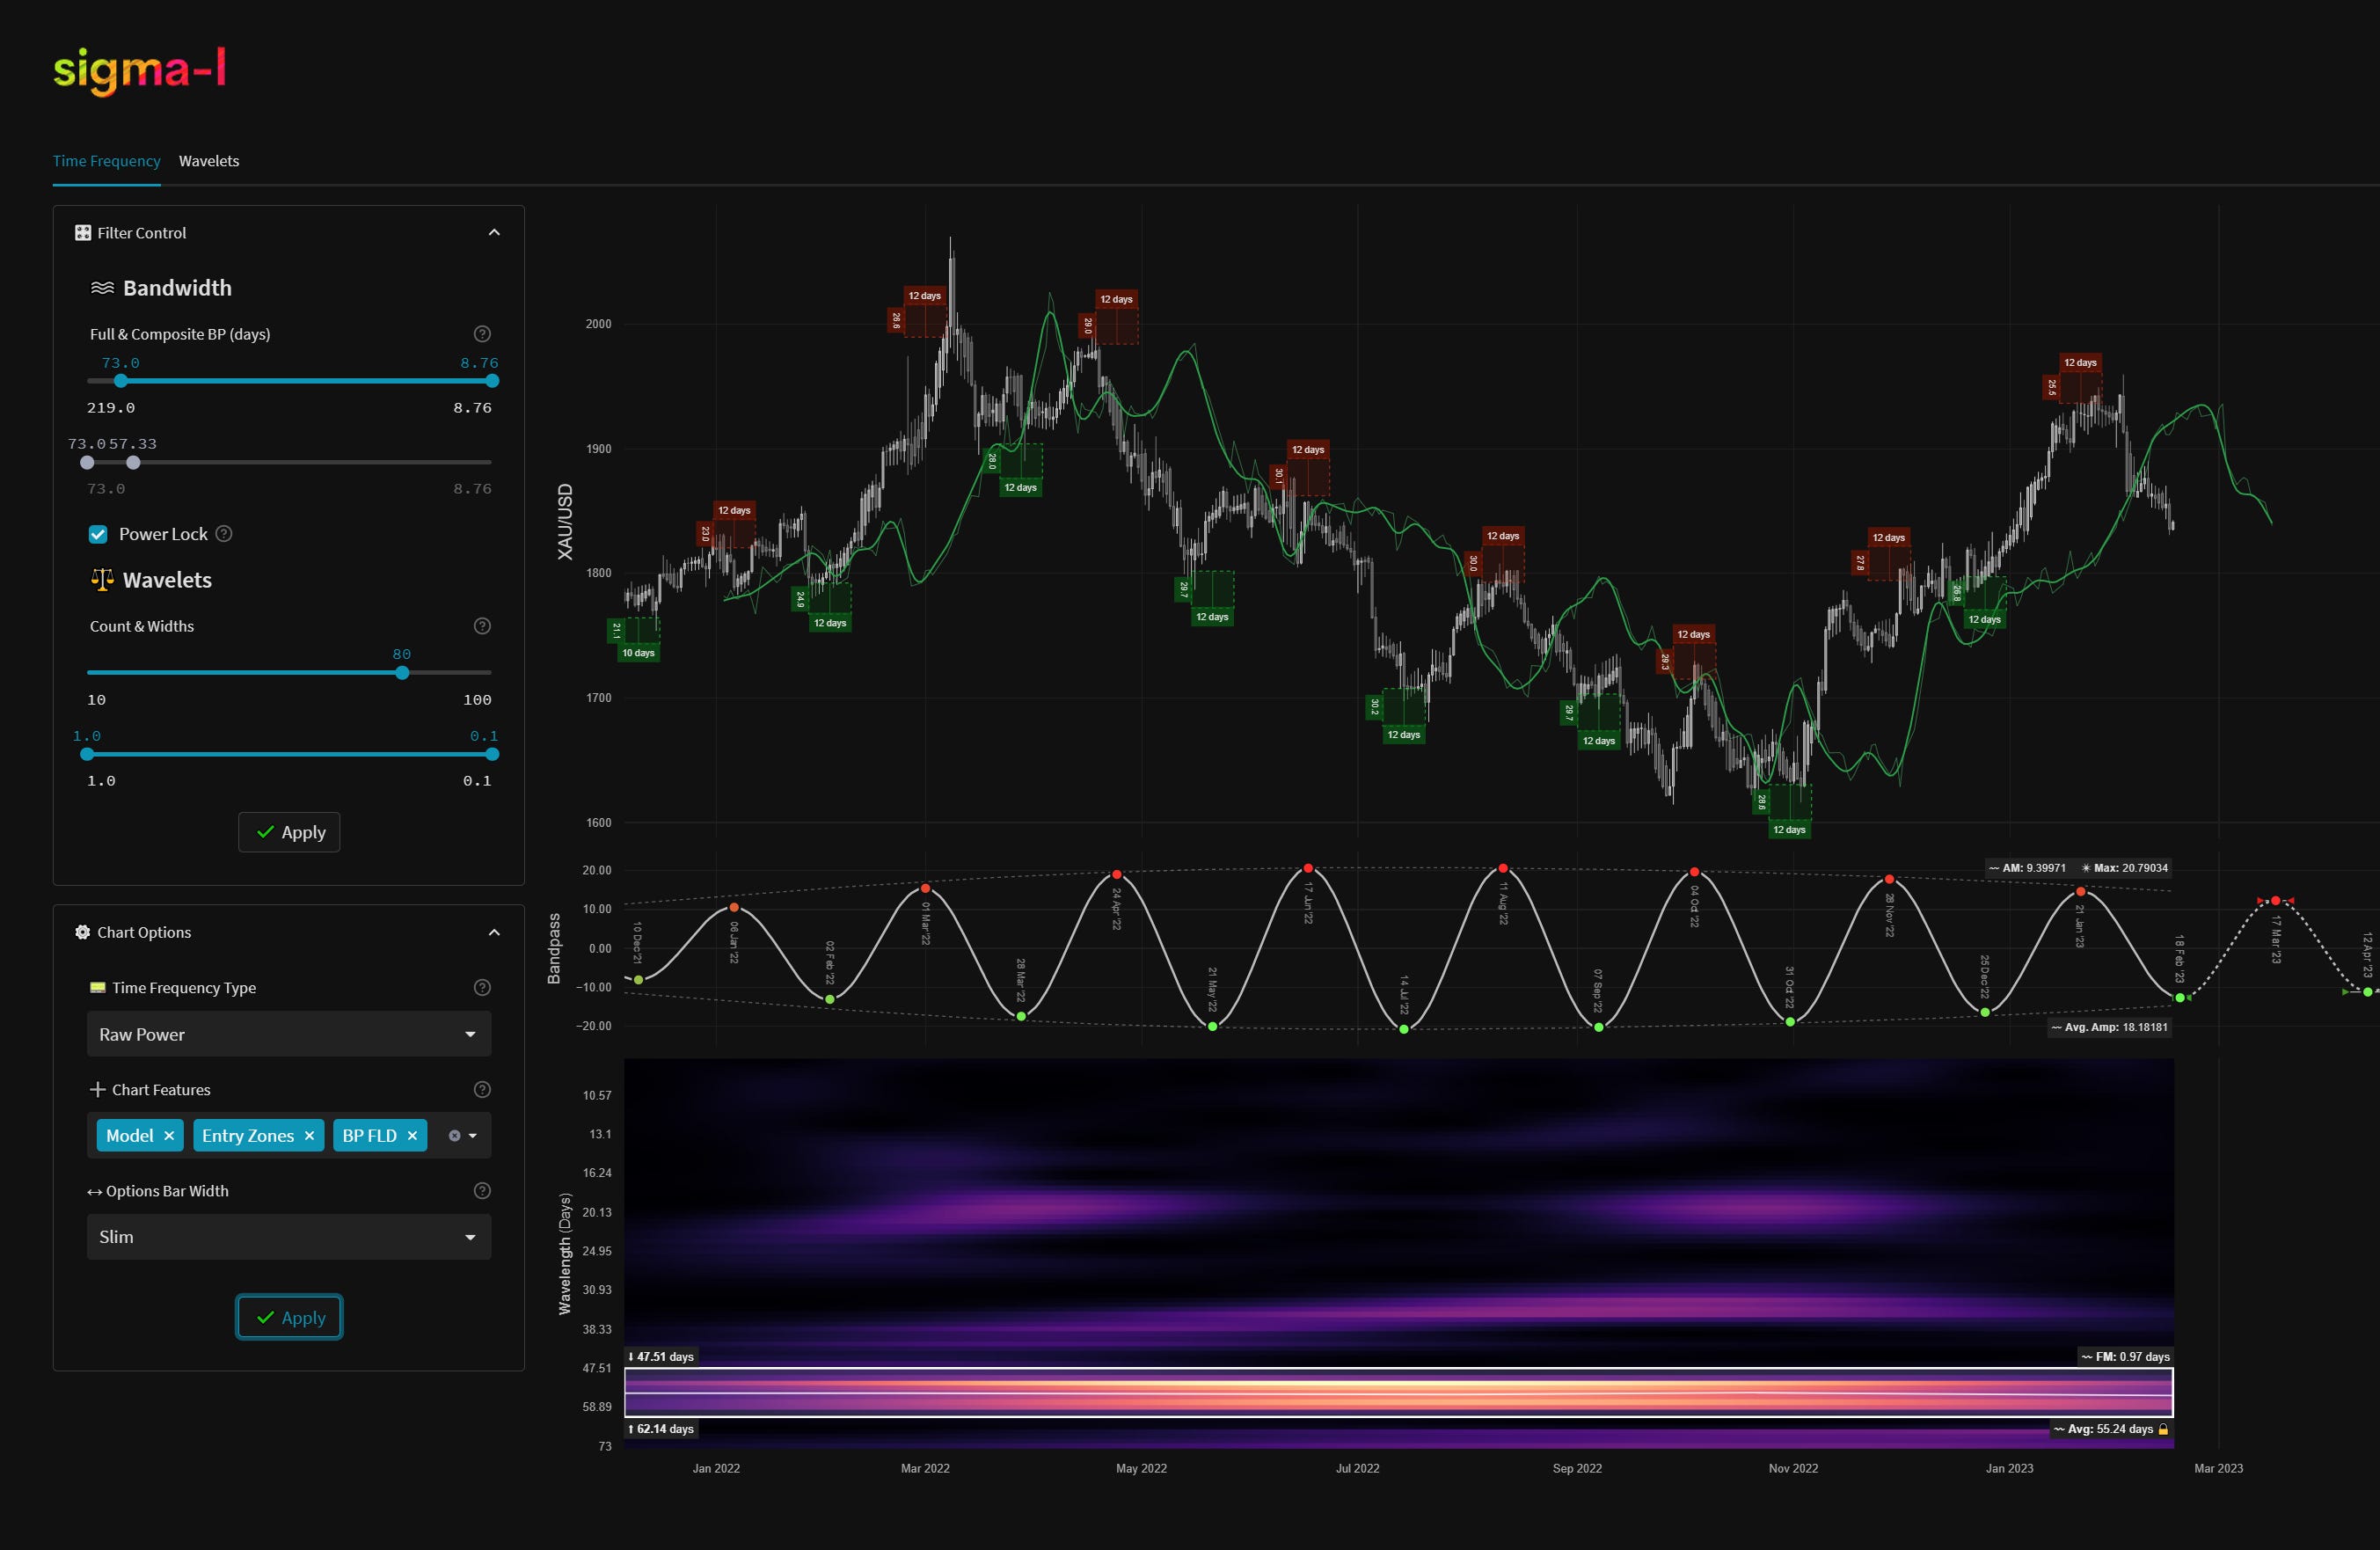
Gold peaked from the 20 week component, running at a wavelength of around 140 days from the time frequency analysis below. The excellent component at 55 days is now due a trough so this report mainly focuses on that. The longer components, namely the 18 month (~500 days) and 40 week (~ 300 days) component are pushing up. Our downside target of 1850 was reached and exceeded.
The dominant shorter wave (@ ~55 days) has been excellent for many months and there is little reason to believe it will not be the same here. The upward pressure of the 18 month component made a rare attenuation of this wave recently but we should expect it’s power to still influence price action to a tradeable degree. At the time of writing price is slightly above the 20 week FLD, to which there may be an imminent sharp drop before the trough of the shorter wave is established. The subsequent peak, due mid - late March, will show us the status of the 40 week and 18 month components.
Devotees of strict Hurst cycles will note this trough should also be a trough of 20 week ‘nominal’ magnitude too. We point out here that the principle of harmonicity and synchronicity is a vast simplification and, in reality, happens only on occasion, so be careful. Due to the phase shifting of periodic components and the contribution of random elements, synchronisation is not always present. When it is present (we call it ‘phase clustering’) it usually precedes a powerful move!
Phasing Analysis
Long Term
Components including and longer than the 18 month nominal wave


Medium Term
Components between the 20 week to 18 month nominal wave


Short Term
Components shorter than the 20 week nominal wave

Trading Strategy
Interaction Status
Interactions and price in the FLD Trading Strategy (Advanced). This looks at an idealised 40 week cycle and an array of 3 FLD signal cycles. We apply the instrument’s phasing to the model and arrive at an overall summary for the interactions with the 20 day FLD, current and forthcoming.

Sigma-L recommendation: Buy
Entry: 5 / 10 Day FLD, 10 Day VTL (risk on) / 20 Day FLD
Stop: Below formed 20 week nominal low
Target: 1900, 1950
Reference 20 Day FLD Interaction: A3
Underlying 40 Day FLD Status: A2
Underlying 80 Day Status: E
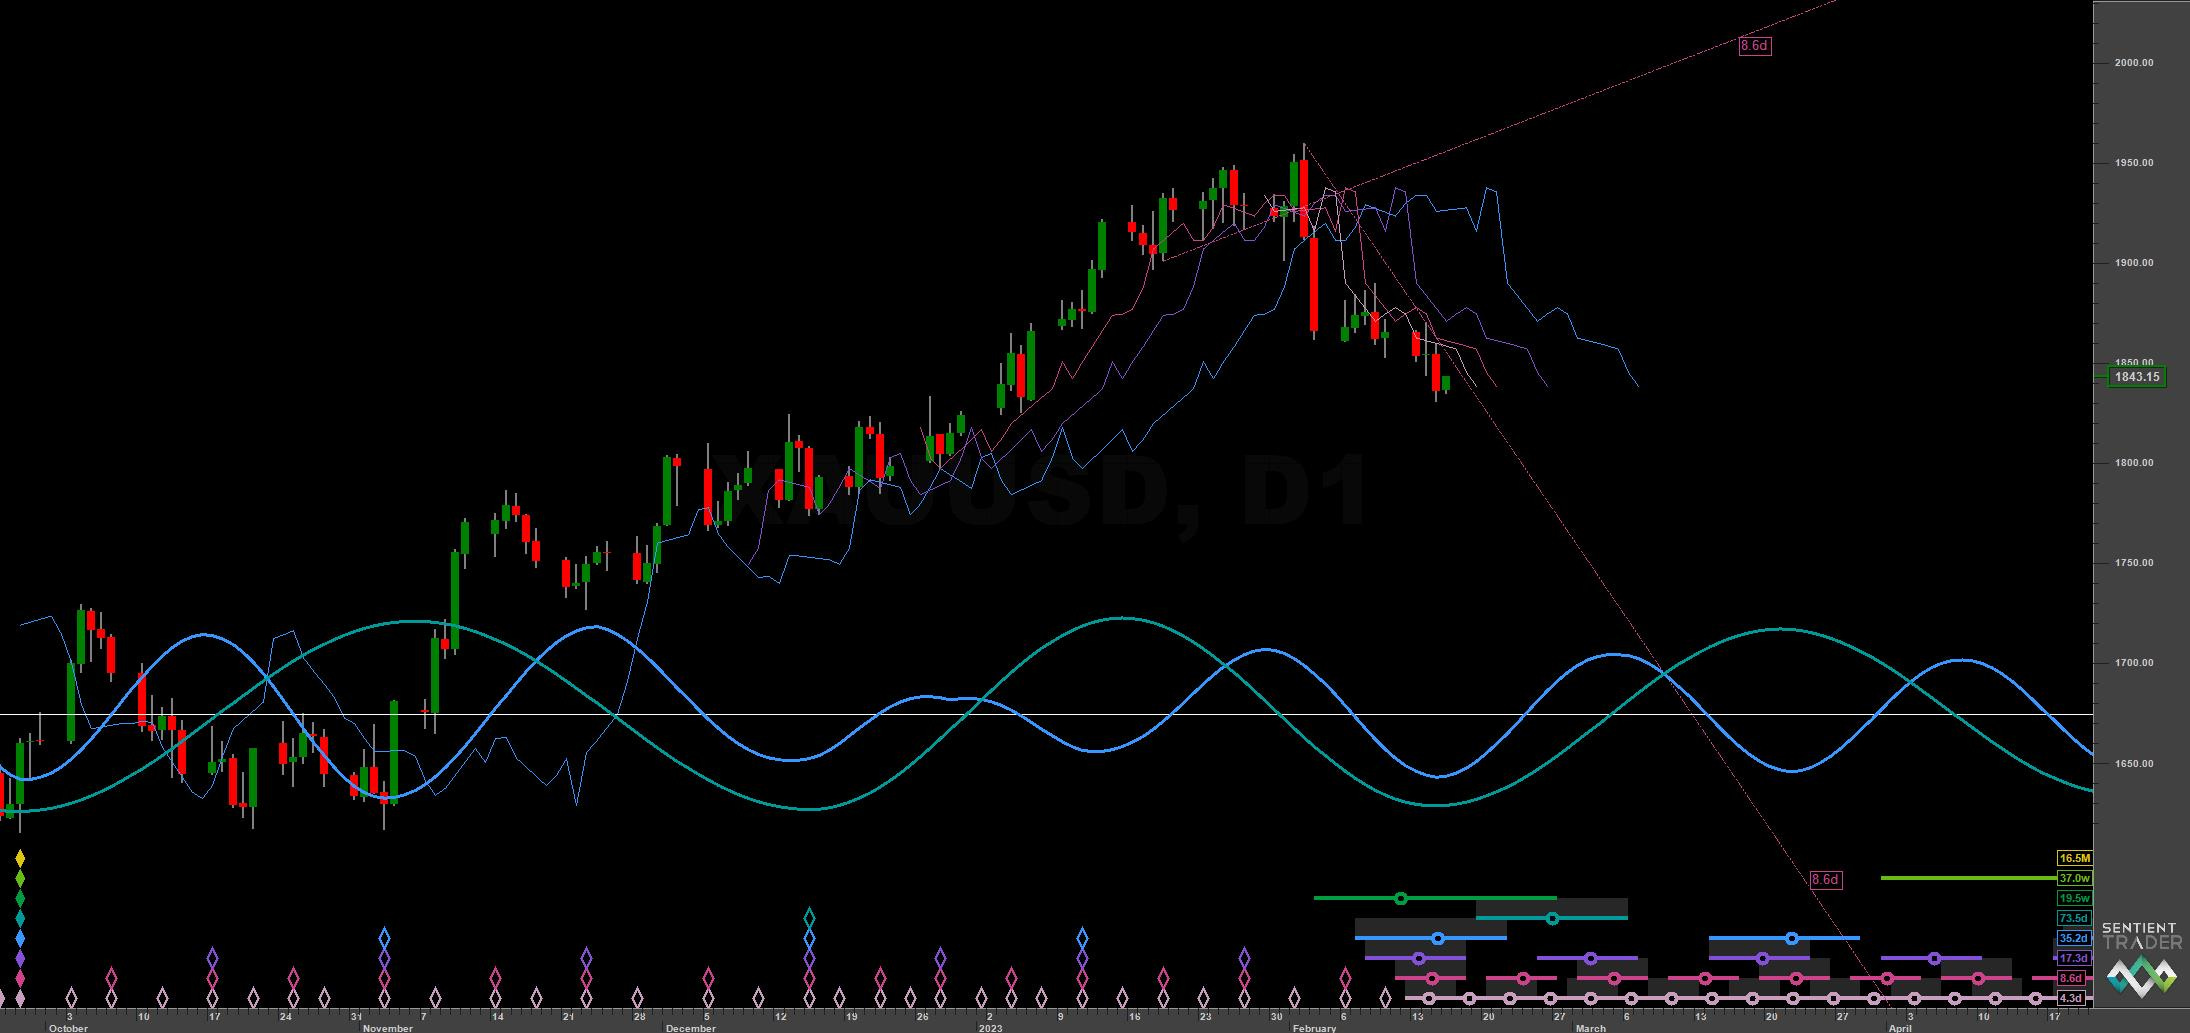
A long entry for the trough of the 55 day component shown on the TFA is a valid signal and is due. Whether price moves past the peaks around 1960 remains to be seen and will inform as to the phase of the 40 week component. Note the upside target on a cross of the 40 day FLD to come, if it is heavily exceeded this indicates bullish underlying trend.
FLD Settings
If you do not have the use of Sentient Trader use these settings to plot common FLDs in your trading software (daily scale) to more easily follow trading signals and strategy from Sigma-L.
Make sure to account for non-trading days if your broker omits them in the data feed (weekends, for example). The below offsets are given with no added calculation for non-trading days.
80 day nominal: 73.5 days | 37 day FLD offset
40 day nominal: 35.2 days | 18 day FLD offset
20 day nominal: 17.3 days | 9 day FLD offset
10 day nominal: 8.6 days | 4 day FLD offset
Correlated Exposure
A non exhaustive list of correlated instruments for consideration
SPDR Gold Shares iShares Gold Trust IAU 0.00%↑
SPDR Gold MiniShares Trust GLDM 0.00%↑
Aberdeen Physical Gold Shares ETF SGOL 0.00%↑
Granite Shares Gold Shares BAR 0.00%↑
VanEck Merk Gold Trust OUNZ 0.00%↑
Goldman Sachs Physical Gold ETF AAAU 0.00%↑
ProShares Ultra Gold UGL 0.00%↑
Invesco DB Precious Metals Fund DBP 0.00%↑
Invesco DB Gold Fund DGL 0.00%↑
wShares Enhanced Gold ETF WGLD 0.00%↑
Barrick Gold Corporation GOLD 0.00%↑
Newmont Goldcorp NEM 0.00%↑
Wheaton Precious Metals WPM 0.00%↑
VanEck Junior Gold Miners ETF GDXJ 0.00%↑
VanEck Gold Miners ETF GDX 0.00%↑
Franklin Responsibly Sourced Gold ETF FGLD 0.00%↑
Amplify Pure Junior Gold Miners ETF JGLD 0.00%↑
GMorning D. Re Uranium from 1/10 update: We look at the evidence for the incoming 18 month nominal low losing amplitude as the zone progresses. This amplitude will return with force when the 18 month component makes it’s low,looking like mid February and should be an excellent chance to exploit a bullish part of the anticipated sideways (neutral) underlying trend for a few months…looking like mid February…Assuming that the 18 month nominal low is to come a short into that low is viable for the move into mid February. Subsequent to that the 18 month nominal low will be a strong bullish move for a few months.
Can you update subscribers David, re strong bullish move for a few months there’s been a good deal of positive fundamentals recently. Thanks David
Hello David thank you for the update. In case the longer component became dominant (around 75 days) instead of the 56 days, and price kept drifting down towards the 1780 area, would the 1900-1950 target still be intact or should we redefine it in terms of reduced amplitude given the increased bearishness displayed? Have a good day. Alessandro