

Hacking the Uncertainty Principle: Time Frequency
Wavelet convolution is a powerful signal processing tool, used on Sigma-L to examine cycles in markets that are changing in power and frequency over time. We look at some of the key features

Time Frequency Analysis and the FFT
Time frequency analysis and the fast Fourier transform (FFT) are two approaches used to analyse the frequency content of a signal. Financial markets can be thought of as noisy signals, a time series that is assumed to be composed of a number of periodic functions and random components. Time frequency analysis allows for the identification of how a signal's frequency content varies over time, while the static FFT provides a snapshot of a signal's frequency content at a single point in time. The FFT squashes any temporal information out of the final analysis (how a signal is changing over time) and is solely based in the frequency domain.
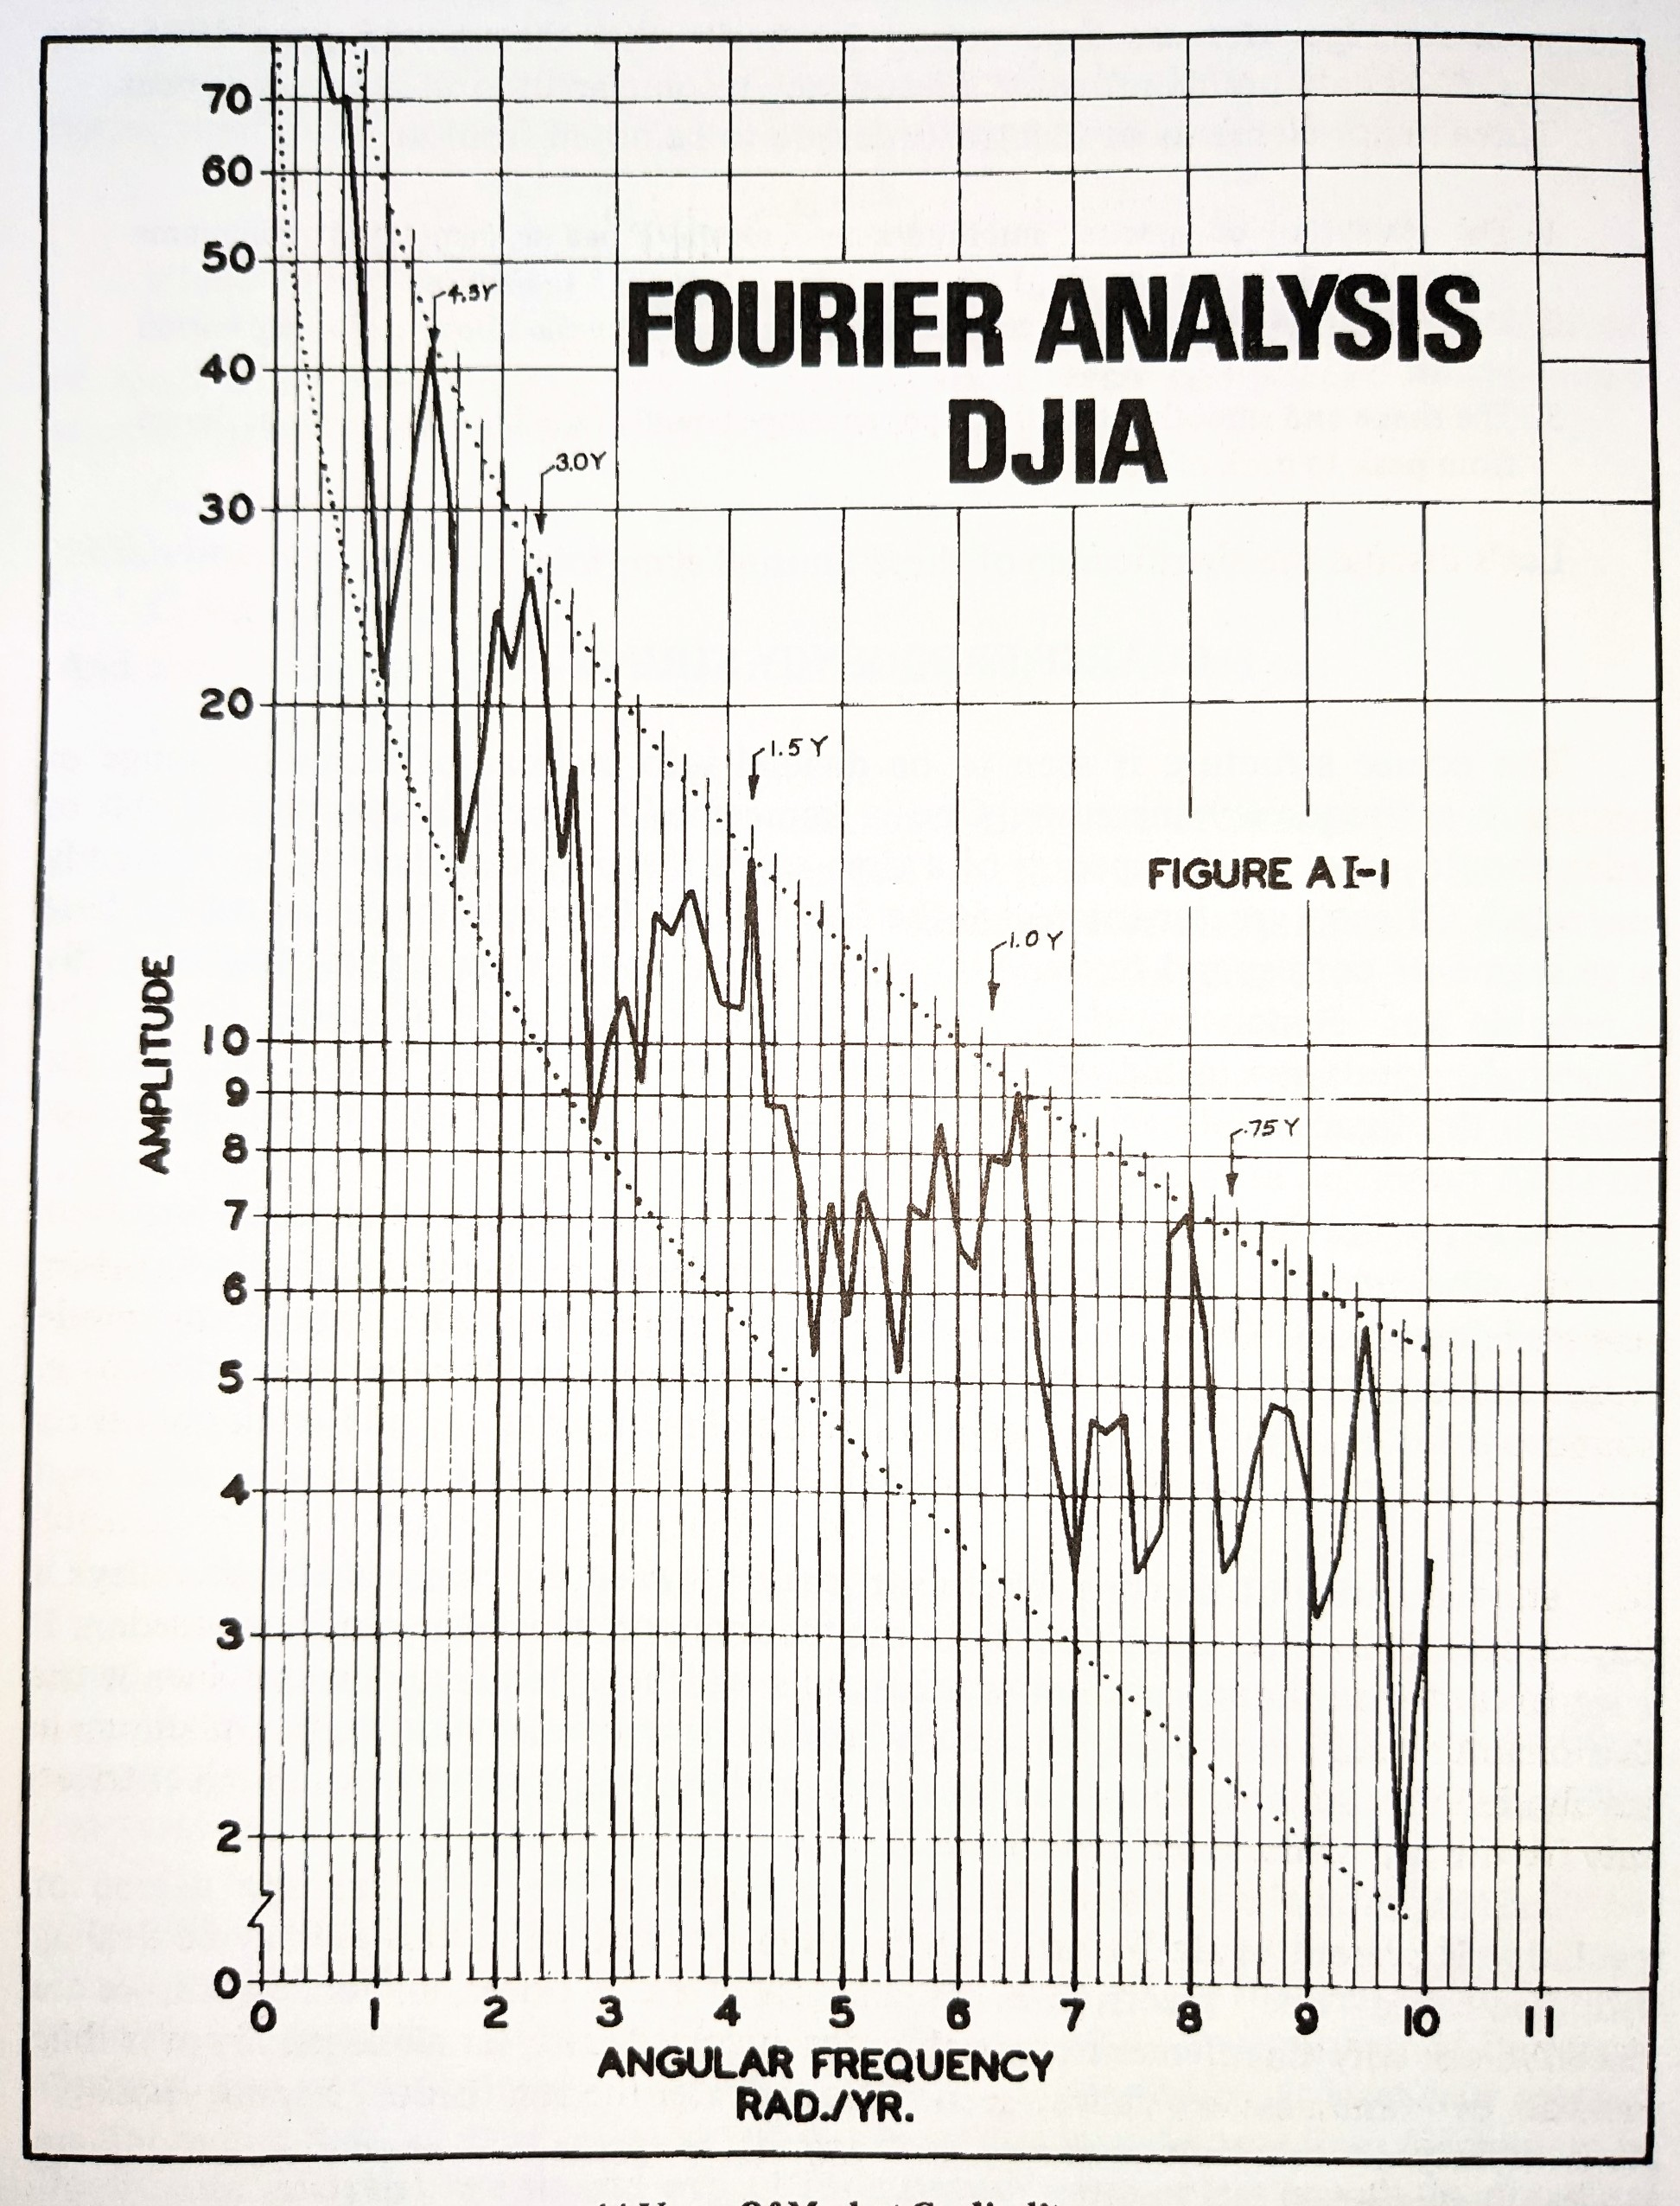
At the time of writing Profit Magic for Stock Transaction Timing there was huge excitement over the newly established FFT algorithm and it’s application across a great many disciplines. Areas of modern life we take for granted now - the internet, mobile communication, streaming video and much much more, were made possible by this algorithm
The FFT algorithm itself was conceived by Cooley and Tukey in 1965 and is now one of the most widely used and critical algorithms in digital signal processing, covering almost all areas of modern life. It certainly lays a claim to be the greatest algorithm of all time.
Prior to it’s invention, performing the discrete Fourier transform was a computationally intensive task that required a lot of time and resources, even more so with early computing power. The FFT greatly improved the efficiency of this computation, making it possible to quickly analyse signals and extract useful information related to periodic components. Today, the FFT is used in a wide variety of applications, from audio and image processing to scientific data analysis and communication systems.
The FFT is a powerful tool for analysing the frequency content of a signal, but it has some limitations. One of the more notable limitations is that the FFT only provides information about the frequency content of a signal at a single point in time. This means that it cannot capture how the frequency content of a signal varies over time. In contrast, time frequency analysis with wavelets allows for a more detailed analysis of a signal's frequency content over time. This is quite important when we look at financial markets as the signals that we assume comprise price action are modulated over time. Hurst referred to this modulation as ‘the principle of variation’.
In the 60s and despite the new algorithm, computing the FFT at scale was in the domain of supercomputers and those with the resources to hire them. So when a certain engineer was asked, well, the rest is history…
Wavelets and the Time Frequency Trade Off
A common method of time frequency analysis is wavelet convolution, which uses wavelets to decompose a signal into it’s frequency components. Wavelets are mathematical functions that can be used to break a signal down into different frequency components. The wavelet convolution process involves convolving a wavelet with a signal to extract its frequency components. This is achieved by taking the inner product of the signal and the wavelet at each point in time. The wavelet coefficients can then be used to reconstruct the signal's frequency content at each point. This is quite distinct from the static FFT which assumes all frequencies occur across all time and are crystallised into one point. Said more succinctly, the process of wavelet convolution allows for the identification of how the frequency content of a signal varies over time.
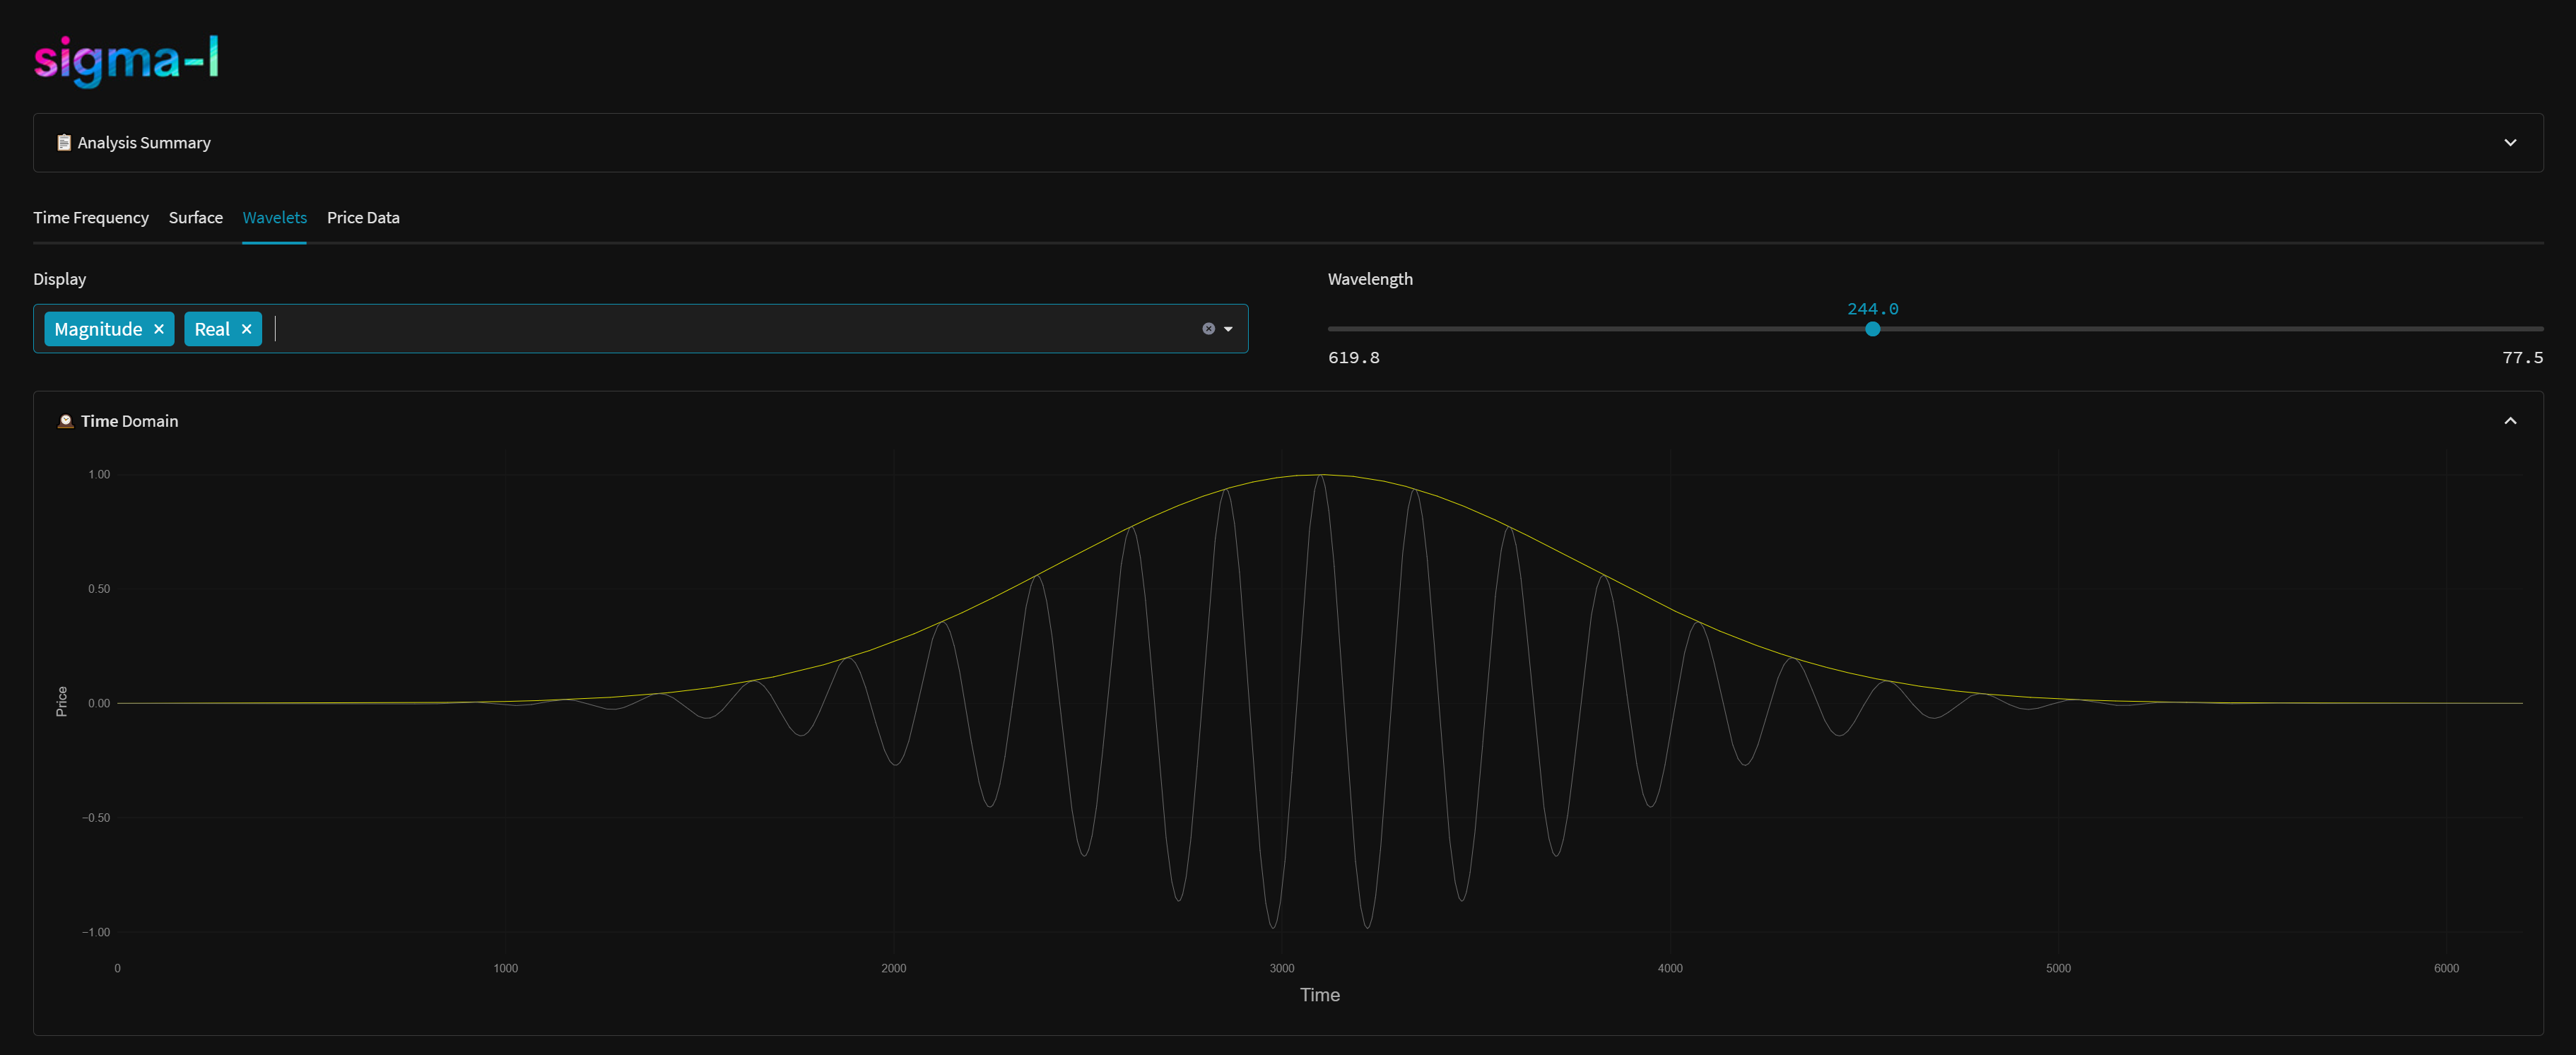
One type of wavelet that is commonly used in time frequency analysis is the Morlet wavelet. The Morlet wavelet is a sinusoidal function multiplied with a Gaussian. This makes it well-suited for analysing signals featuring changes in frequency and amplitude, such as those in financial markets. To perform wavelet convolution, a signal is convolved (multiplication in the frequency domain) with the wavelet to obtain the wavelet coefficients.
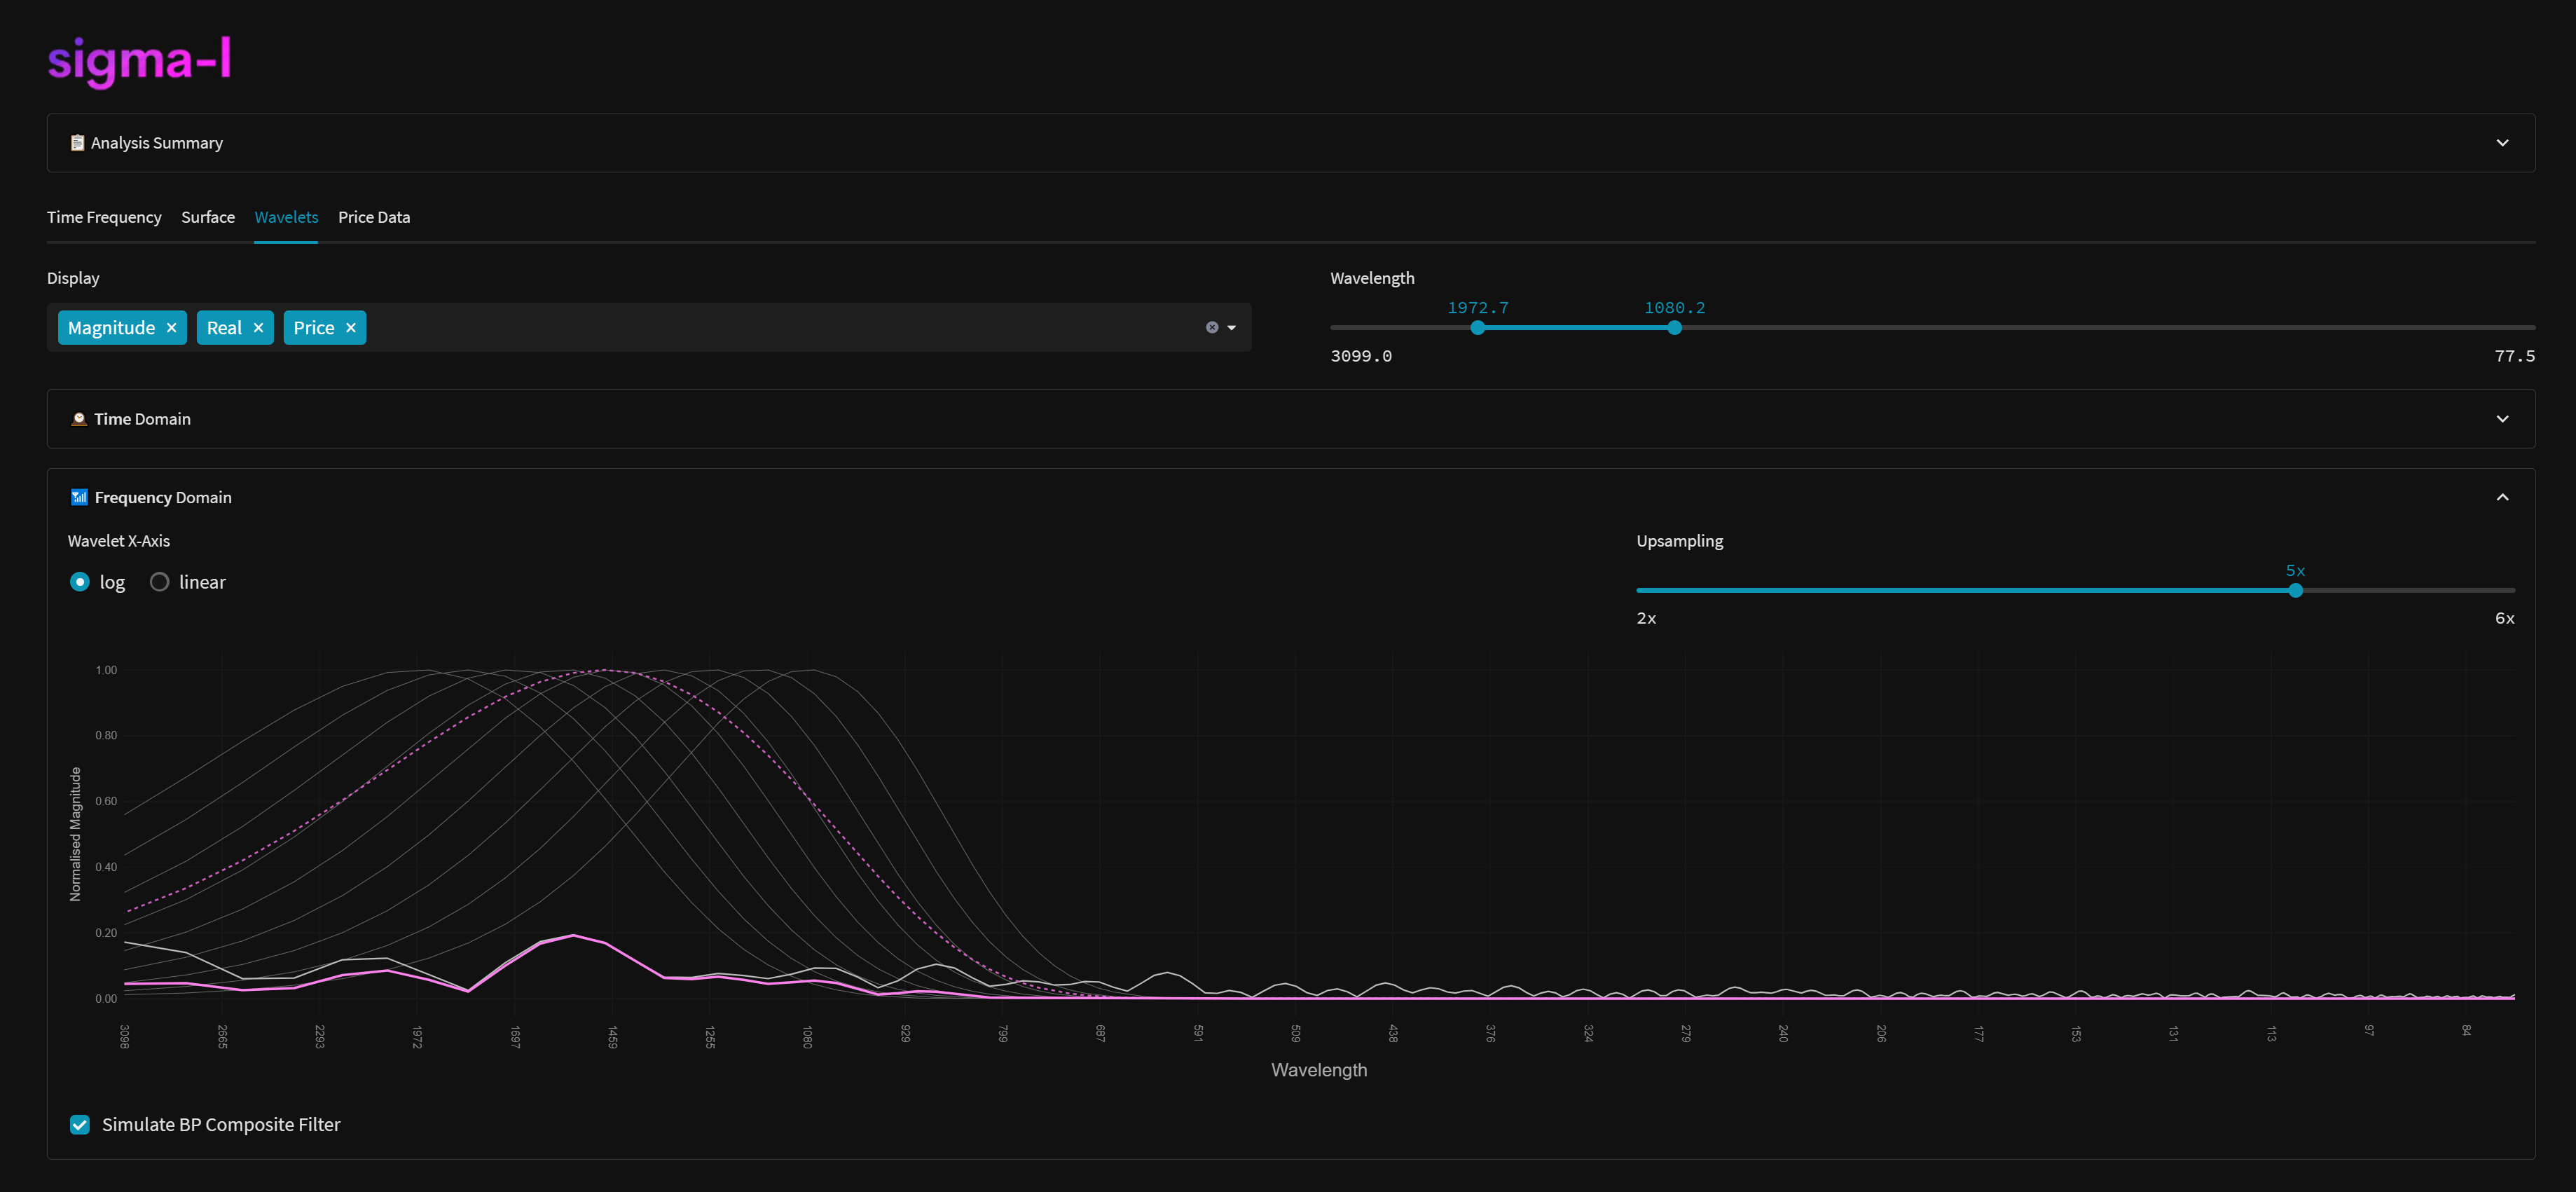
One advantage of using wavelets for time frequency analysis is that the parameters of the wavelet can be adjusted to better suit the characteristics of the signal being analysed. This can help to overcome the general uncertainty principle, which states that it is impossible to simultaneously measure both the time and frequency of a signal with perfect accuracy. The static FFT only caters for the frequency side of that uncertainty.
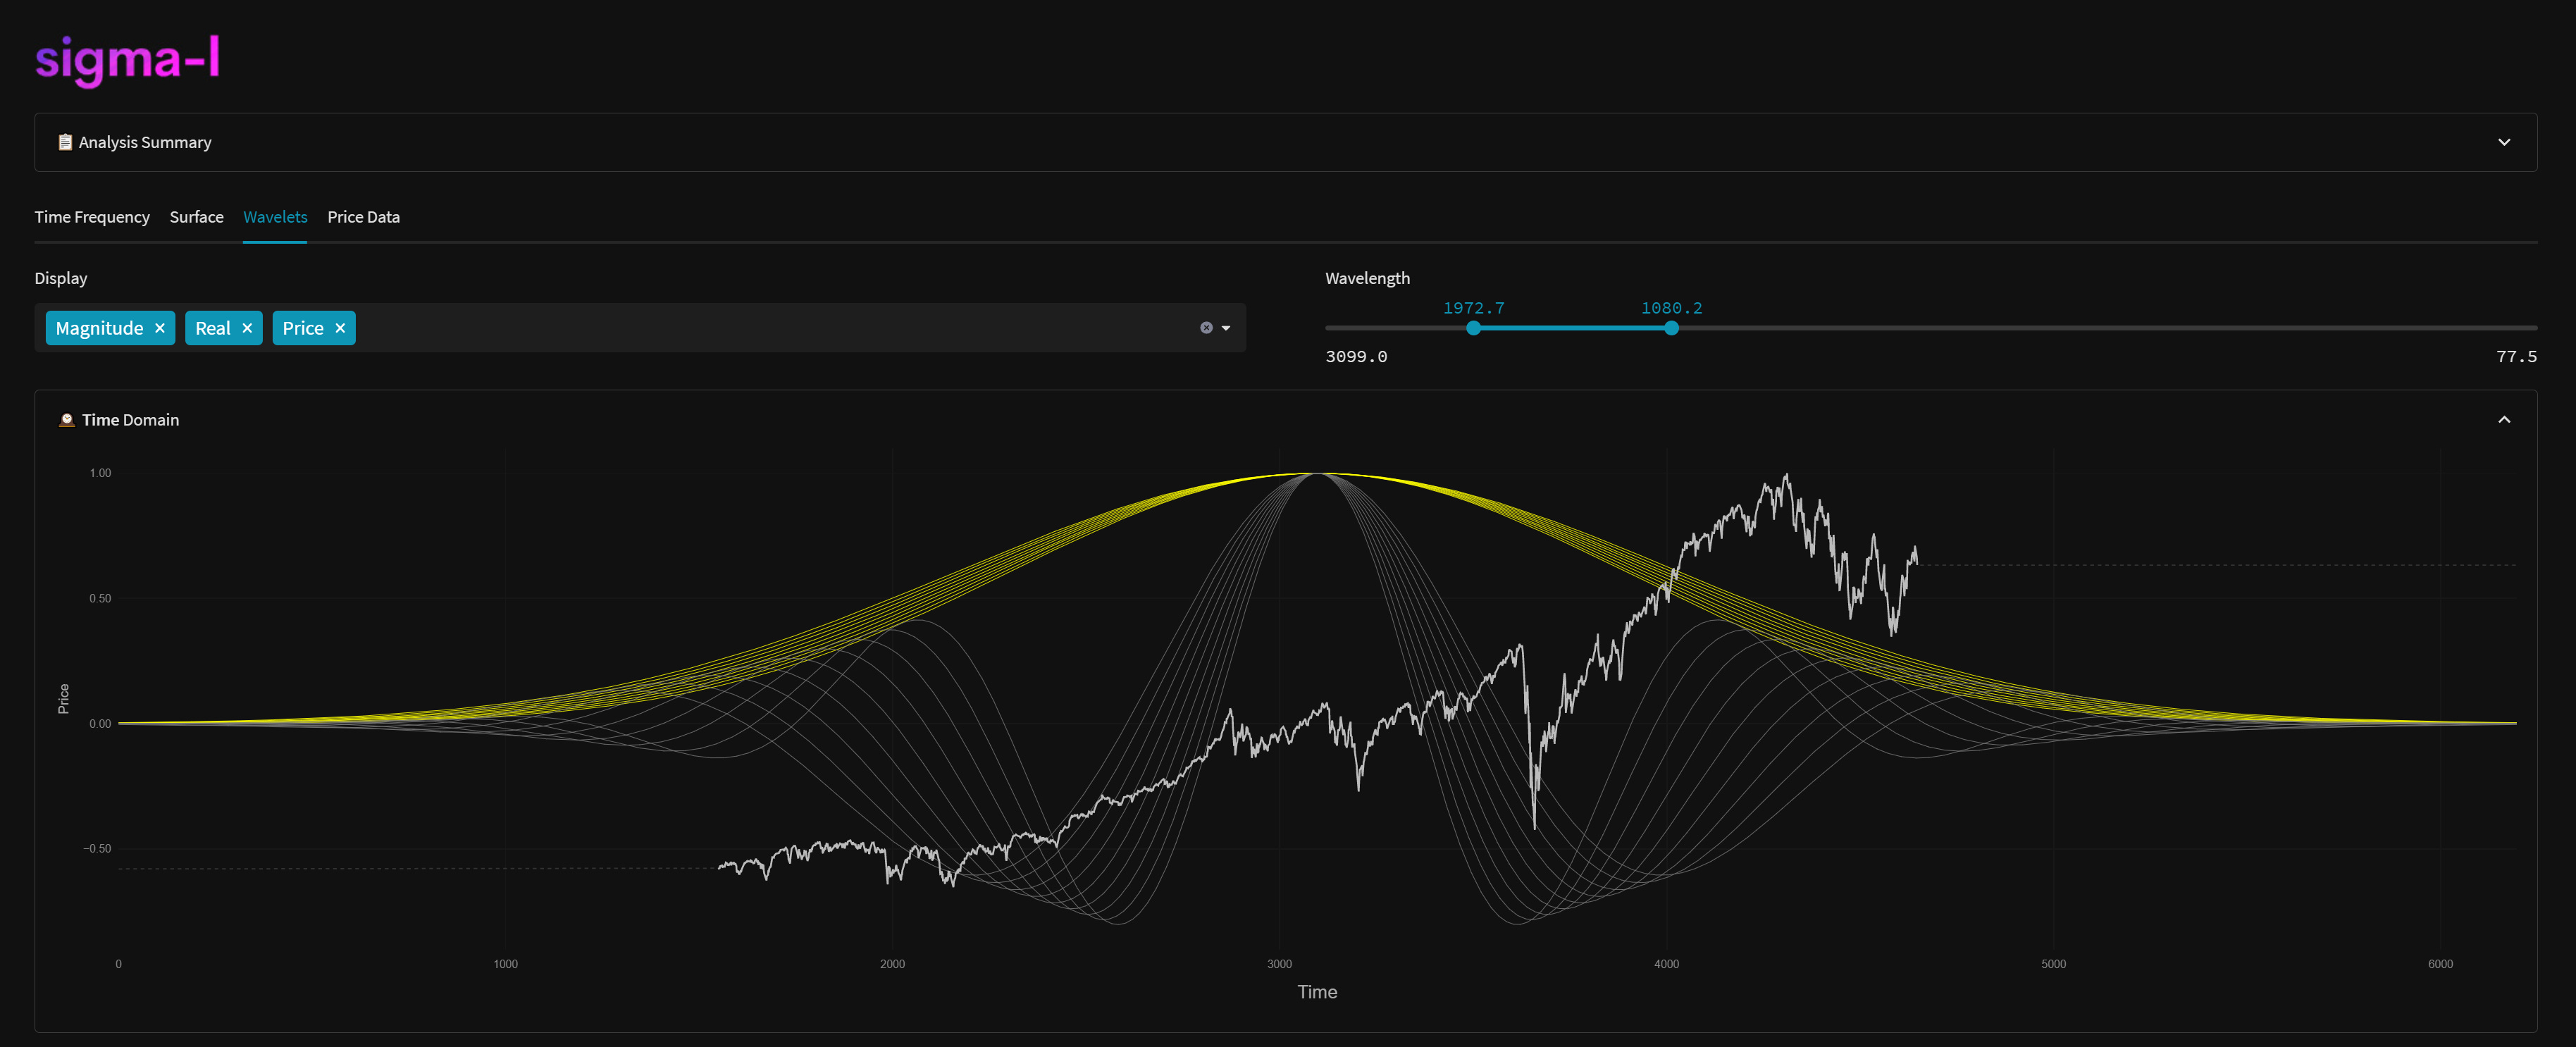
By adjusting the parameters of the wavelet, such as the central frequency and the width of the Gaussian envelope, it is possible to tune the wavelet to the characteristics of the signal. This can help to reduce the uncertainty in the measurements of the signal, allowing for a more accurate analysis of its frequency content over time. We do this with our own analysis, changing the width of the Gaussian over frequencies to capture components in the most coherent way.
The video below from ubermath youtuber 3blue1brown gives an excellent insight into the process of convolution.
If that video piques your interest then the following tour de force of the wavelet transform as a mathematical microscope is awesome, from Artem Kirsanov:
Time Frequency in the Wild
Time frequency analysis is a powerful tool that can be used in a variety of applications:
Speech recognition: In speech recognition systems, time frequency analysis can be used to analyse the frequency content of speech signals. By identifying how the frequency content of a speech signal varies over time, it is possible to differentiate between different words and sounds. This can be useful for improving the accuracy of speech recognition systems.
Structural health monitoring: Time frequency analysis can be used to analyse the frequency content of signals from vibrating structures, such as bridges or buildings. By identifying changes in the frequency content of these signals over time, it is possible to detect potential problems with the structure. This can be useful for ensuring the safety of structures and preventing accidents.
Electroencephalography (EEG): In neuroscience, time frequency analysis can be used to study brain activity. Electroencephalography (EEG) involves recording the electrical activity of the brain using electrodes placed on the scalp. Time frequency analysis can be used to analyse the frequency content of these signals, which can provide insights into brain function and help to diagnose neurological disorders. Some of the techniques employed on Sigma-L use insight from this field.
Seismology: In seismology, time frequency analysis is used to study earthquakes and other seismic events. By analysing the frequency content of seismic waves over time, it is possible to identify the location and magnitude of earthquakes, as well as the properties of the materials that the waves are traveling through. This can be useful for predicting and mitigating the effects of earthquakes.
Music: Time frequency analysis can also be used in music. By analysing the frequency content of a musical signal over time, it is possible to identify the different notes and chords that make up a piece of music. This can be useful for music transcription and other applications in music analysis.
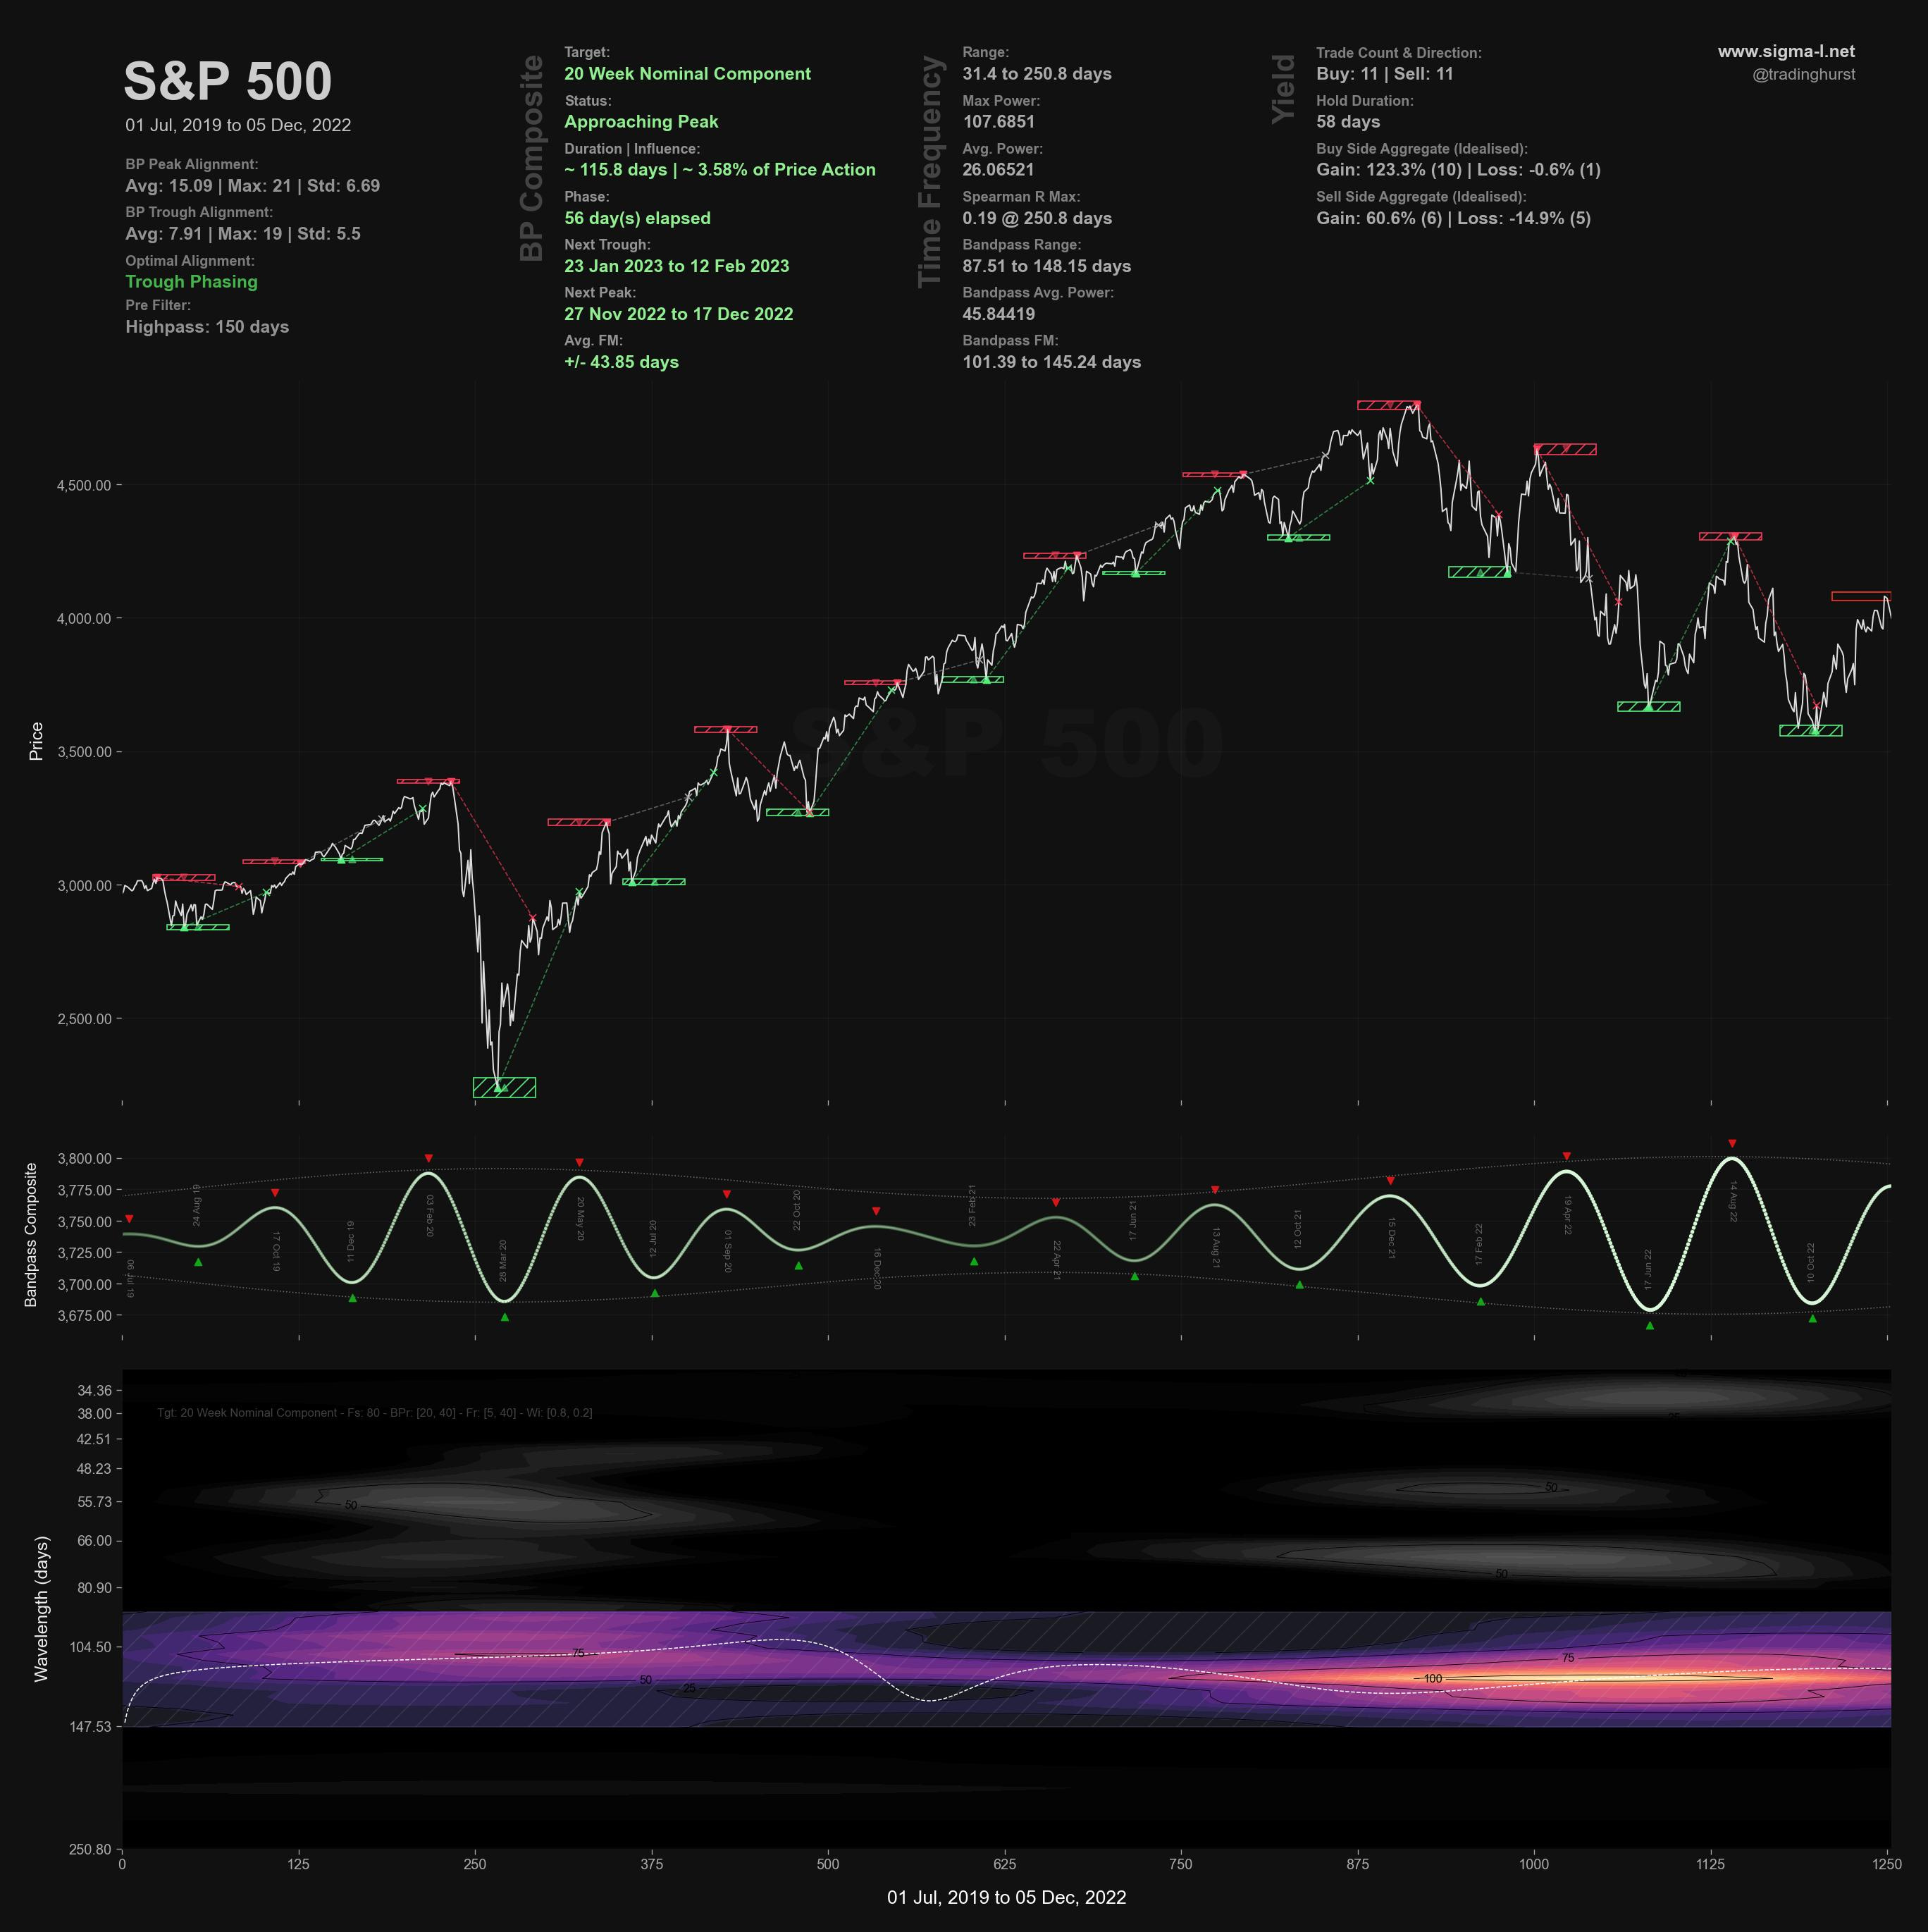
Of course on Sigma-L we also use this technique quite widely to compliment the more established methods. It is more objective than other pattern based techniques and allows us to really see any significant periodic activity. Below is the S&P 500 and the wonderful 20 week component, a familiar sight for subscribers.
Time frequency analysis with wavelets provides a more detailed and flexible approach to analysing the frequency content of a signal than the FFT. By adjusting the parameters of the wavelet, it is possible to overcome the uncertainty principle somewhat and obtain more accurate measurements of a signal's frequency content over time. Whilst the FFT is a powerful tool for quickly computing the frequency content of a signal, time frequency analysis with wavelets allows for a more insight into any modulation. This modulation motivated Hurst to apply his comb filter technique, shown in the appendix of Profit Magic for Transaction Timing and equivalent to a low resolution wavelet convolution. We have compute power orders of magnitude above what Hurst could leverage in the 60s, it makes sense to use it.
In Summary
Time frequency analysis and the fast Fourier transform (FFT) are two approaches used to analyse the frequency content of a signal.
Time frequency analysis allows for the identification of how a signal's frequency content varies over time, while the FFT provides a snapshot of a signal's frequency content at a single point in time.
One common method of time frequency analysis is wavelet convolution, which uses wavelets to decompose a signal into its frequency components. The parameters of the wavelet can be adjusted to better suit the characteristics of the signal being analysed, which can help to overcome the uncertainty principle.
The FFT is a powerful tool for quickly computing the frequency content of a signal, but it has some limitations. It only provides information about the frequency content of a signal at a single point in time, and it assumes that the signal being analysed is wholly periodic.
Time frequency analysis with wavelets provides a more detailed and flexible approach to analysing the frequency content of a signal than the FFT. By adjusting the parameters of the wavelet, it is possible to overcome the uncertainty principle and obtain more accurate measurements of a signal's frequency content over time.
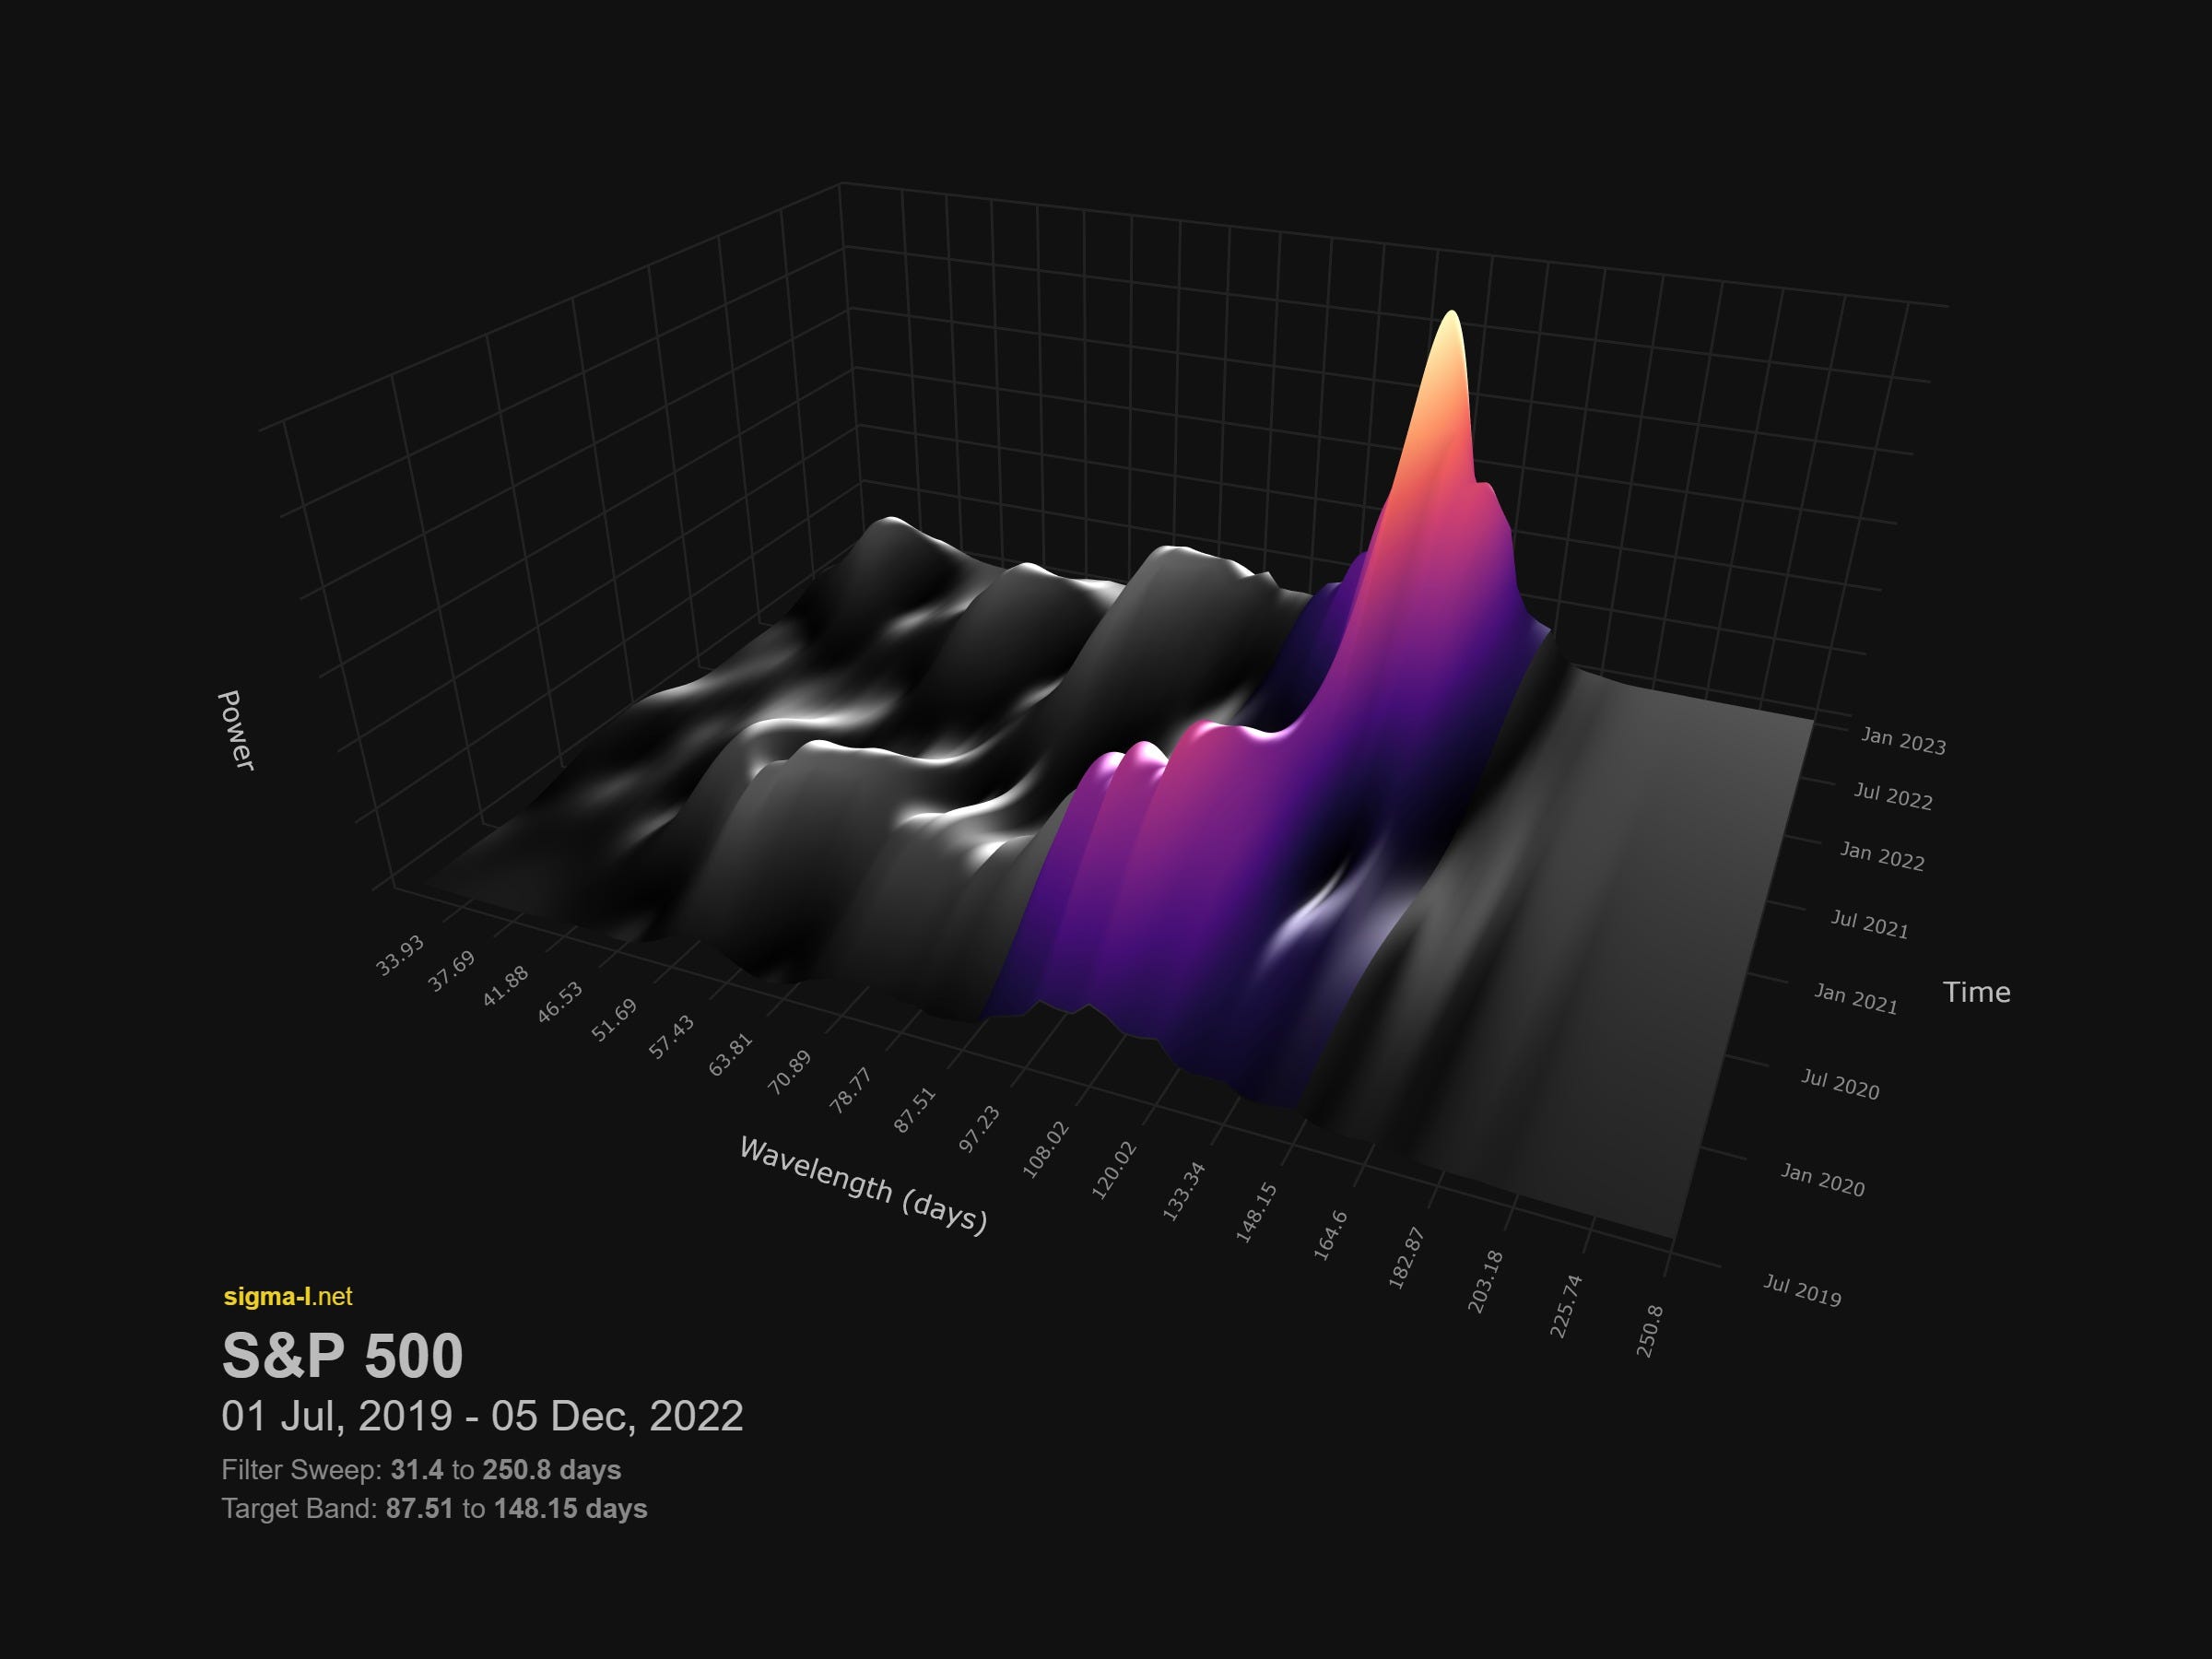
Hi David. May I know what toolbox or code did you use to 3d-plot these wavelets? They look much much prettier than the default ones in Matlab.
What to do when spectral analysis results suggest the existence of more cycles in the price series than proposed by Hurst Nominal Model? Ie. I get distinct peaks at:
13 23 27 34 39 45 54 67 81 96 121 157 195 day wave lengths. How do I decide which of those should be dismissed? Because even if I fully trust Hurst's model how do I decide between 34, 39 and 45 or 67 and 81 when all fall close to 40 and 80 respectively? And why 54-day cycle has to be dismissed even though its 2nd harmonic at 27 days is present?