

Sigma-MT v1.0 User Guide, Part 4: Yield Mode & Reading Historical Performance
Learn how the Sigma-MT EA quantifies a cycle's past quality via the inbuilt 'yield mode'. Test the viability of a cycle by shifting the yield back into the past and viewing it's performance.

The Sigma-MT Suite is available now for new VIP Cycle Analysts (founding members). Please contact me (on X or Substack chat) once you have joined or upgraded from standard membership to receive the software.
Prerequisites: the quick start, the spectrogram guide, detection guide and the projection guide. You should be comfortable reading the spectral properties of a signal and a bandpass. You should understand that the bandpass is the dominant cycle extracted cleanly from the price action at the targeted bandwidth.
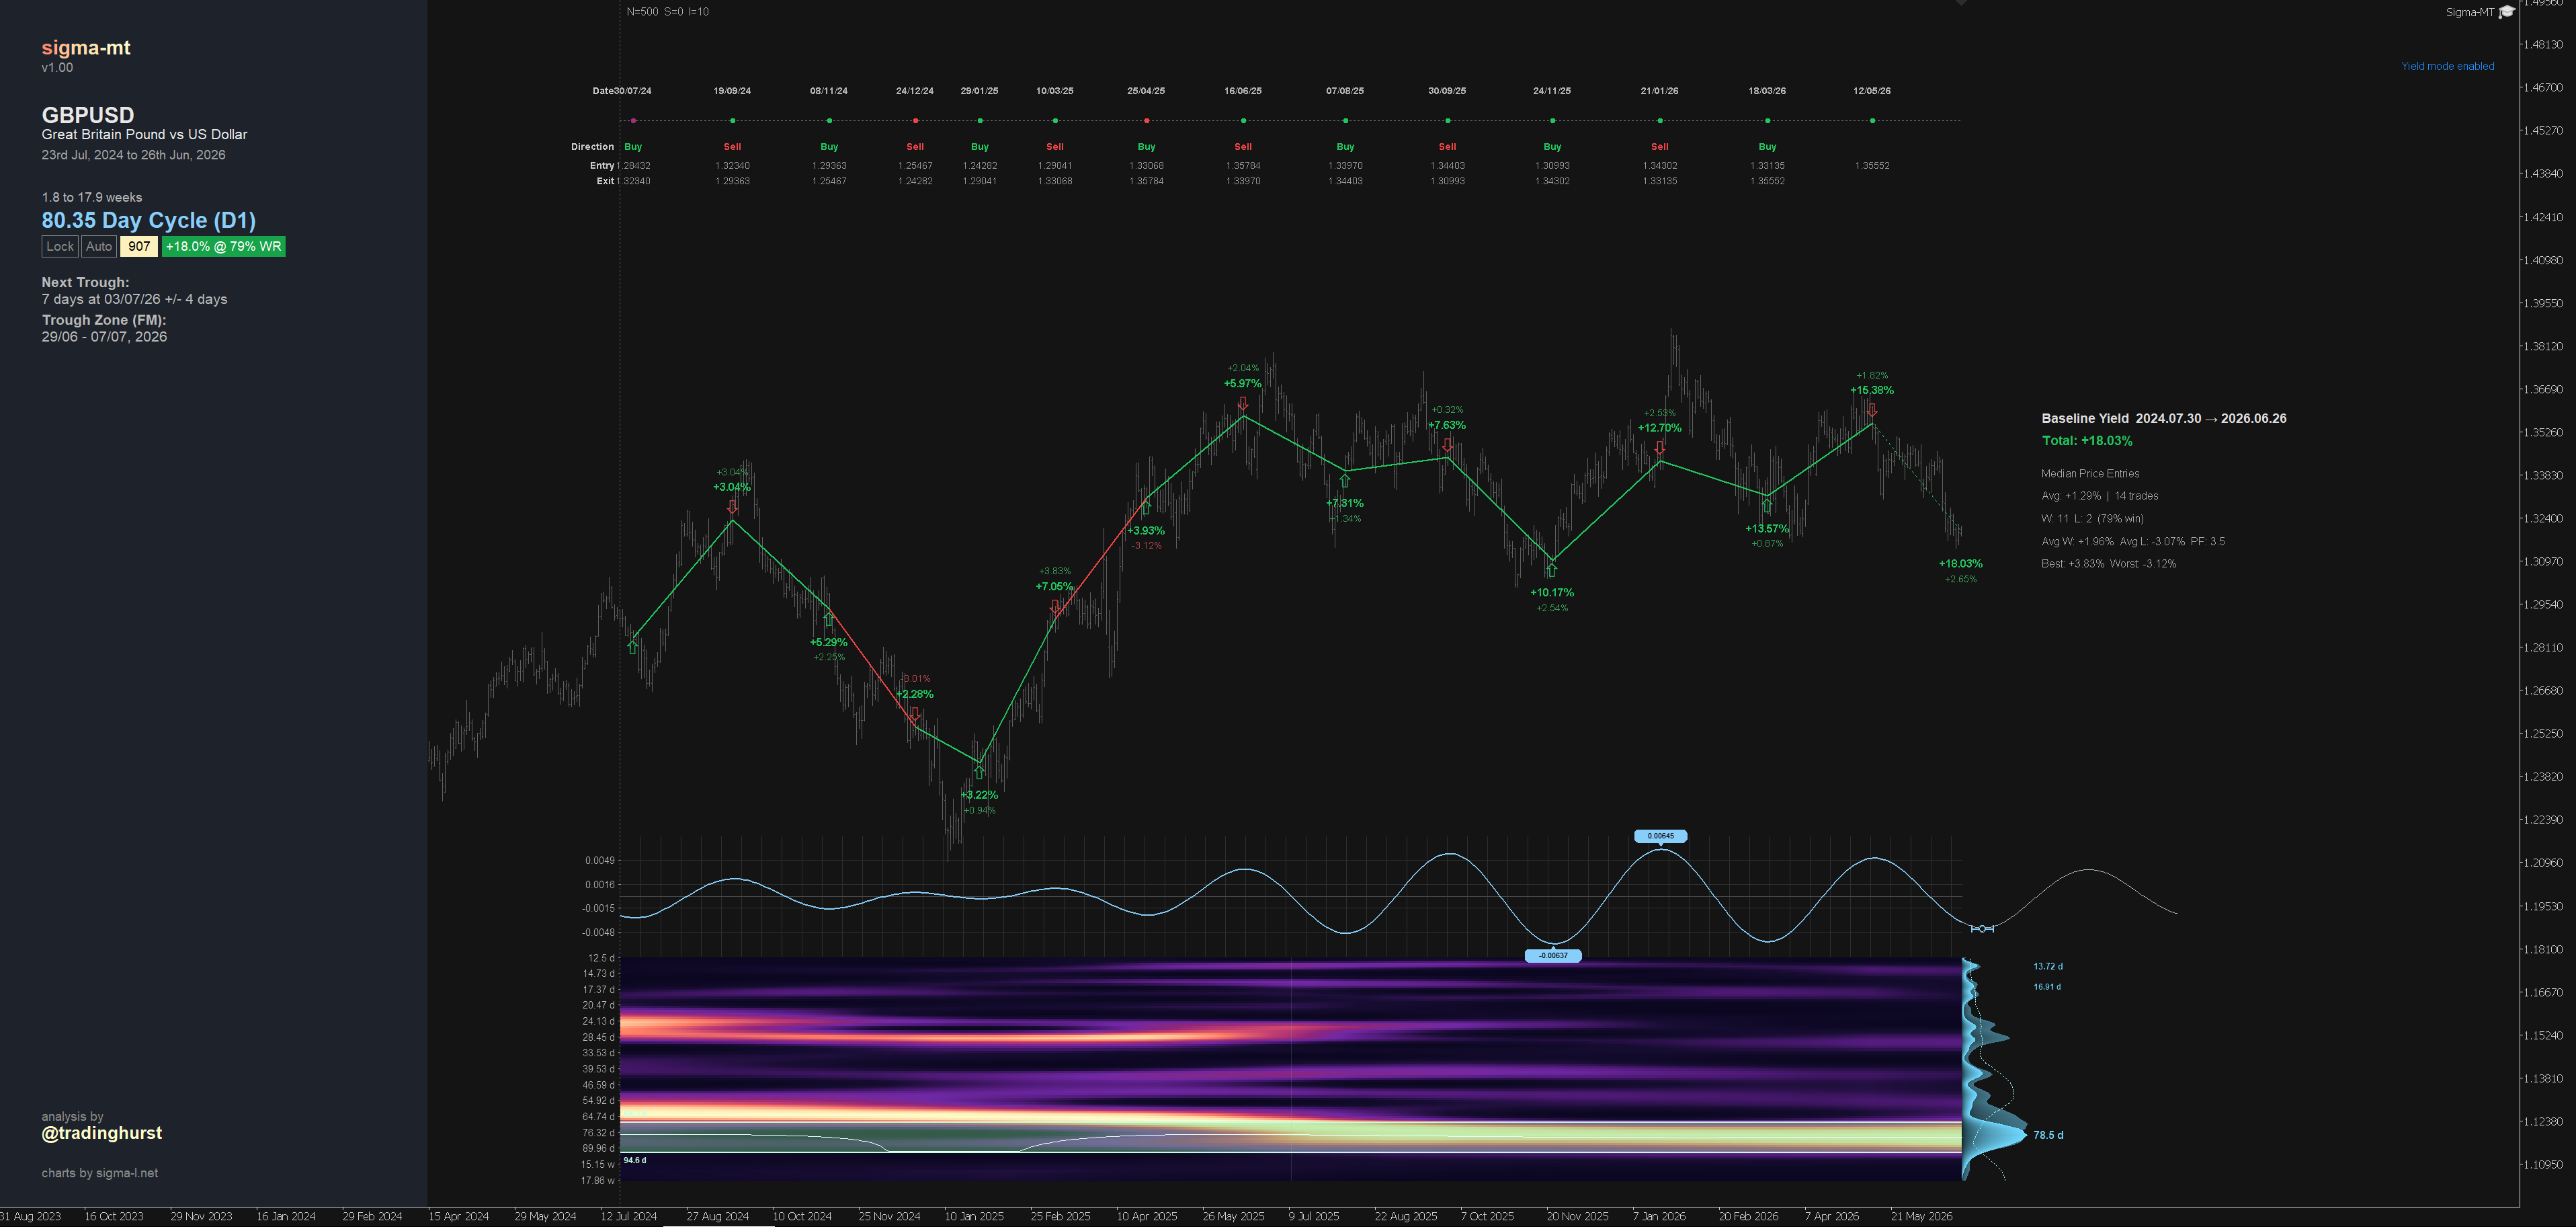
Every guide so far has pointed forward: detect the cycle, score it, project it, box the next turn. This one turns around and looks back historically, giving an estimation of past performance. Yield mode, on the Y key, asks a simple question of the cycle currently on your chart: if you had traded this rhythm across the visible window, buying every trough and selling every peak, what would it have returned? The answer is one of the most useful sanity checks in the software, and also one of the easiest to misread, so this guide is as much about what the number does not mean as what it does.
What yield mode actually does
Press Y and the engine walks the weighted bandpass from the oldest bar to now-time, finding every inflection point along the way. It then lines these up into a sequence of trades, which the software calls legs, always starting from a trough so that the first move is a buy. Trough to the next peak is a long; peak to the next trough is a short. The cycle is simply traded in both directions, turn by turn, across the whole window.