

Sigma-MT v1.0 User Guide, Part 1: Reading the Spectrogram & the Time-Frequency Engine
Read the spectrogram fluently, understand what the engine is actually computing and combine the short, medium and long-term layers into a single multi-timeframe view.

The Sigma-MT Suite is available now for new VIP Cycle Analysts (founding members). Please contact me (on X or Substack chat) once you have joined or upgraded from standard membership to receive the software.
Prerequisites: the quick start guide. You should already have Sigma-MT on a chart and recognise the spectrogram, bandpass panel and info panel by sight.
The quick start guide told you what the spectrogram is. This guide tells you what it means, and why a picture built from wavelet convolution is a fundamentally more honest way to look at market cycles than counting peaks on a chart. Everything that follows in the course (detection, projection, yield, composites, the Scanner) is built on the foundation laid here, so this is the one guide worth reading twice.
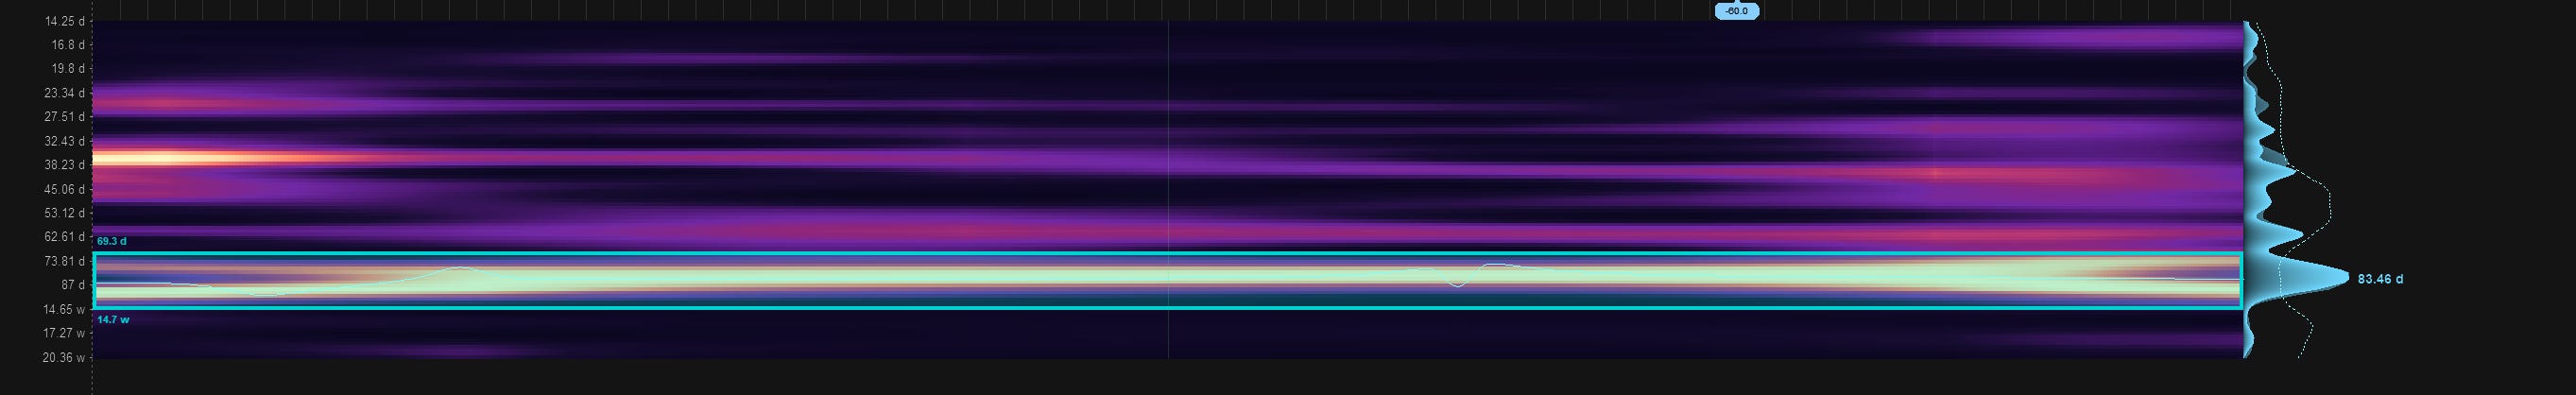
The problem with counting cycles..
Classical cycle analysis, the kind you find in most trading literature and some descending from the work of J.M. Hurst, begins by simple counting of visually apparent inflection points. You find two lows, measure the bars between them, and declare a cycle of that length. The trouble is that this is subjective and brittle. Two analysts looking at the same chart can pick different lows and arrive at different cycles, and a single noisy swing can throw the count off entirely. Indeed higher frequency features can often have bursts in power than exceed the power of the longer cycle, influencing price in a transitory and misleading (to the cycle counter) manner. Worse, it assumes a cycle has one fixed length, when real market rhythms drift in period (frequency modulation) and fade in and out of strength (amplitude modulation) over time. The real marker of a quality cycle is the minimisation of any modulation (or a high degree of stationarity), since modulation is a constant in financial market cycles.