The Periodical: 7th October 2022
GBPUSD rockets from the 40 week nominal low after a bearish media frenzy, gold and silver lift from 20 week nominal lows and stock markets move up from a likely 40 day nominal low
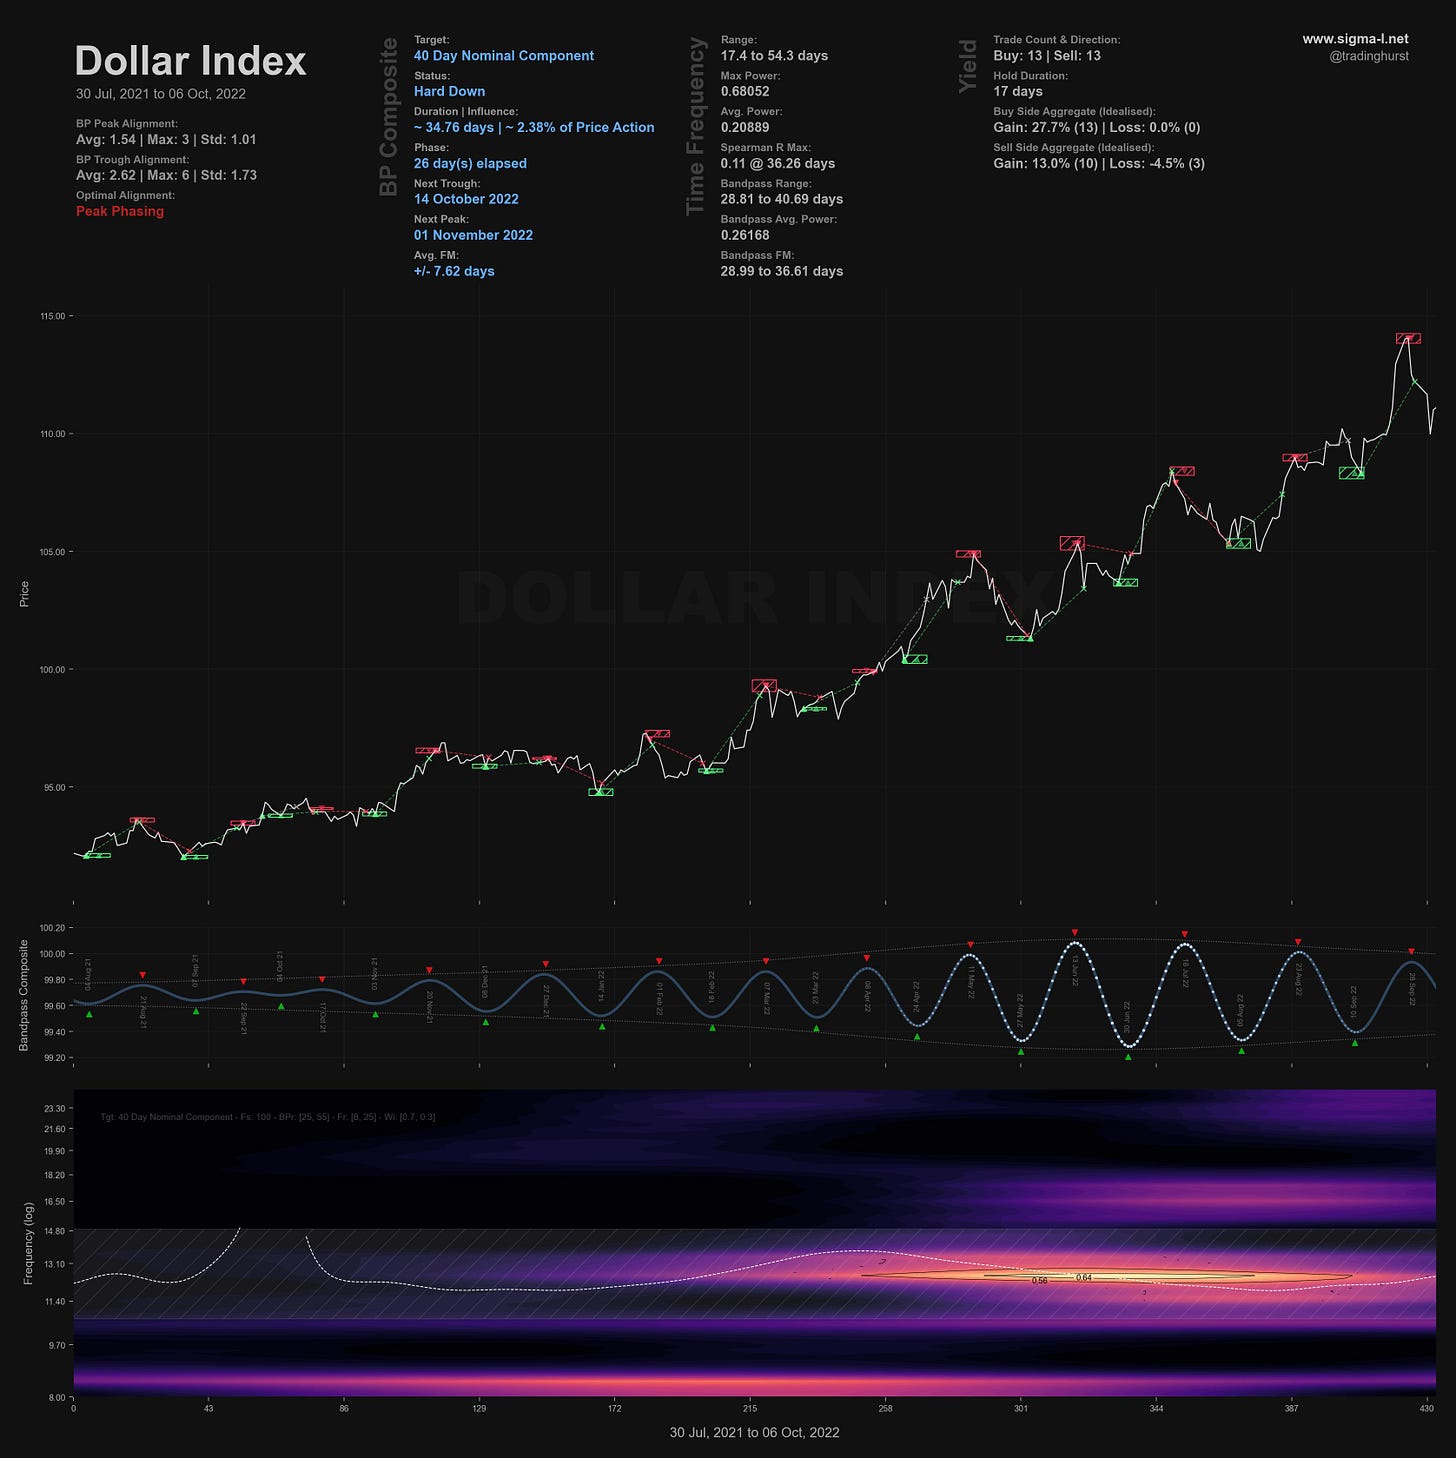
Chart Highlight: Dollar Index

Round Up
It has been a good couple of weeks from a Hurstonian perspective, once again proving the robust nature of this approach with contrarian and correct calls in huge global markets, namely Gold, Silver, Equity indices and GBPUSD/EURUSD.
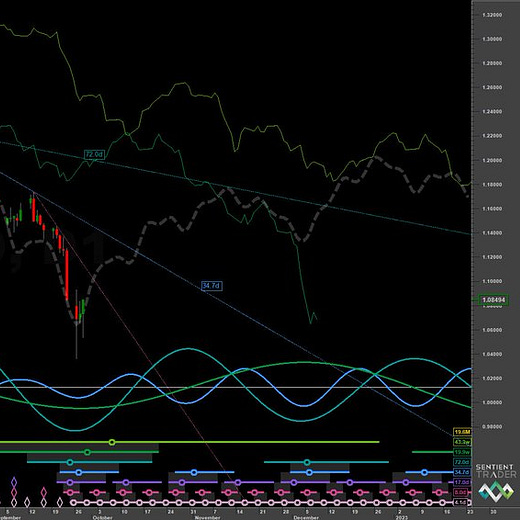
Starting with the currency markets and the stand out story to tell is that of at least a 20 week nominal low in GBPUSD (and other USD crosses) occurring on the 26th of September. This low was anticipated for many weeks (even months) by our phasing analysis so it is immensely satisfying to see such a sharp reaction at concisely timed areas. This so often will happen at large lows or peaks and is a time of maximum opportunity. Hurst would refer to this area of buying as an ‘edge band transaction’, being as it would be touching the edges of a constant width, curvelinear envelope, drawn to identify important periodic components in a time series.
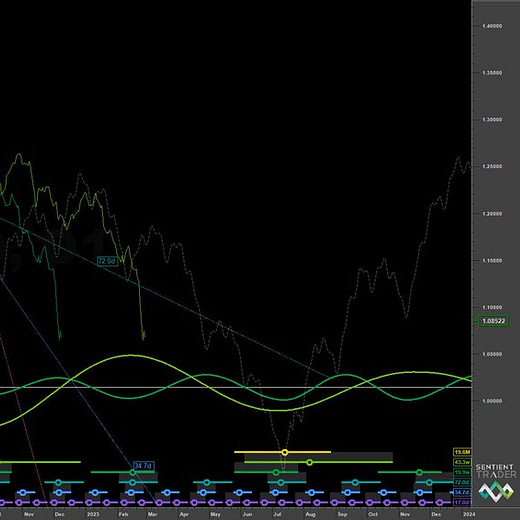
Indeed the mainstream media in the UK exhibited classic bear market capitulation panic with column inch after column inch of space dedicated to the imminent collapse of the currency. As we mentioned in the last Periodical, parity and below is likely coming, just not quite yet.
Oil has made what is at least a 40 day nominal low on the 26th/27th and has proceeded to our target of 85-90 in fairly short order. Price is now at the 80 day FLD which should provide some resistance if the low is only of 40 day magnitude. Watch for price tracking this FLD in the coming weeks. Natural Gas has likely also made a 40 day nominal low, we will be updating the phasing on that next week to reflect the weaker than expected 40 week magnitude low and the possible positioning of it.
Stockmarkets around the world have formed what is likely a 40 day nominal low, although uncertainty is present - it may well be the 80 day component low too. Evidence will come at the first 20 day component low, due around the 17th. A full retrace of the recent move up would put to bed any doubts as to the current phasing. The FTSE, DJIA and S&P 500 all reached their respective targets of 7050, 30000 and 3800 detailed in our reports and now sit below the 40 day FLD, a likely area of resistance and trigger for the next leg down, should the phasing be accurate. Strong support at the 20 day FLD, on the other hand, around the 17th, will increase the probabilities of the outlier phasing. The 40 day component’s expected wavelength remains unchanged in both scenarios and is anticipated to form it’s next trough at the end of October (~ 30 - 33 days average wavelength).
Cryptocurrency is being keenly watched. We have been anticipating the 18 month nominal low for several weeks now and have seen a grinding move lower, the attention on Bitcoin and it’s offspring diminished for now. Price is creeping toward the 54 month FLD support. It’s close, very close.
Finally Gold and Silver round off this Periodical in fine style, forming lows of at least 20 week magnitude on the 28th of September. Gold recently achieved it’s target of 1720 and currently sits just below the 80 day FLD, a likely area of resistance. What was interesting about this particular low was the divergence of amplitude in Silver at the 20 day component in early - mid September. This caused a few raised eyebrows amongst traders, speculating whether the larger low was indeed established. A very good use case for the principle of commonality here - similar instruments move with very similar frequency components, only amplitude modulation occurs.
In the case of Silver, amplitude modulation in the form of an increase occurred at the 20 day component. However, the frequency/wavelength of the component(s) is largely identical to Gold. A look at commonality instruments reveals a more accurate position for the phasing of the 80 day / 20 week component.
Using phase correlation like this is useful for resolving uncertainties caused by amplitude modulation and, as shown below, can also identify better yielding instruments than the underlying class. This can then be exploited by the knowledge of timing, derived from the much more stationary frequency characteristics of the components under scrutiny.

Twitter Highlight
As stock markets turn down consistently, our attention is drawn to the phase of the larger components. At this point, it is highly likely the 54 month component has formed a price peak in January this year. Assuming the previous 54 month component trough was in 2020 (as shown in the tweet below), the next trough is due in the first quarter of 2024.


