

DJIA: Hurst Cycles - 30th September 2022
Price briefly bounces from 80 day nominal low in early September to reach our target of 32500. A sharp decline subsequently brings into focus the terminal phase of the 18 month component

Tools required: Nominal Model | FLD | FLD Trading Strategy | FLD Trading Strategy (Advanced) | Principle of Nominality | Underlying Trend
Analysis Summary
In our last report on the DJIA, we anticipated the next trough iteration of the 80 day component in early September. The bounce from that low was suitably weak, tracking the 40 week FLD once again (medium term chart below) before falling into what is an imminent 40 day component low, expected in the next few days. Despite the weakness, modest targets up at around 32500 from our last report were achieved:
From 1st September Report:
Resistance at the 40 week FLD is clear and that resistance reduces over the coming month as the FLD moves up. Expect price to track it to the level of around 32500 to 33000, a convergence of both 20 and 40 week FLDs.
Price in all major equity markets is approaching a major low (likely 18 month magnitude). There are several uncertainties (as ever) but we serve to minimise these by our approach in Hurst Cycles. The short term uncertainty involves the 40 day component low coming, which may infact be an 80 day component low. The robustness of the approach dictates that regardless of the uncertainty as to the magnitude of the low we can be fairly certain about direction. Only amplitude will vary. This leaves the excellent prospect of the next 40 day iteration trough being a strong buy, being as it will be either the anticipated larger low or the 40 day low after the larger low.
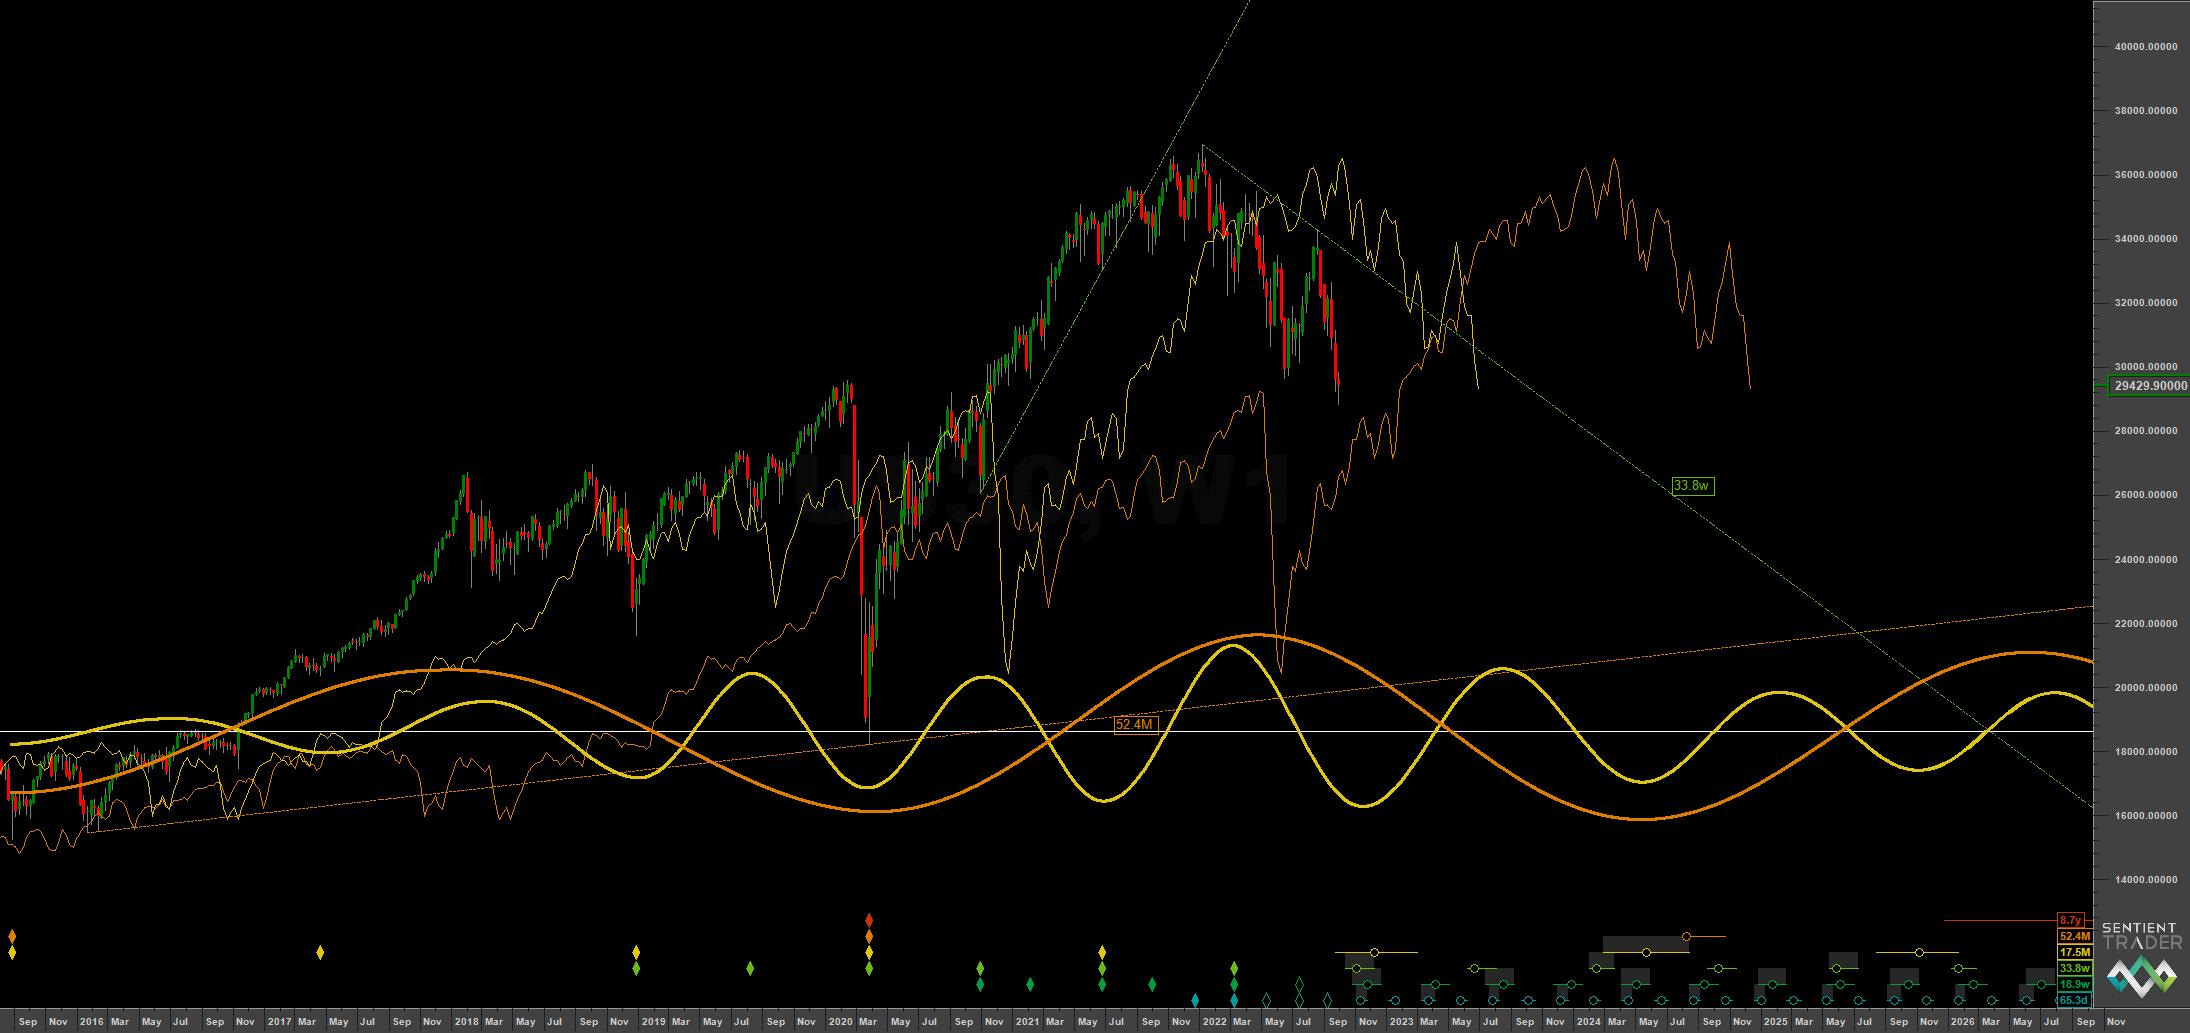
At the medium term the 20 week component is visually apparent in the decline from early 2022 and is expected to trough with support from the 54 month FLD (orange) mid-late October. By the principle of synchronicity this should also be the 18 month nominal low according to the current phasing. There is still some uncertainty as to the position of the most recent 40 week component low (may have been July) but working with the 20 week component will suffice for all but academic purposes. Within the next couple of months we will resolve these uncertainties and that should be an interesting task in itself.
Expect some major macro events in mid 2023 to be rationalised for any further fall as the final 18 month component starts to turn down with influence from underlying trend. At that point price should have been tracking the 54 month FLD up as support after the 18 month nominal low we are anticipating soon. The larger, 54 month nominal low is currently expected to land 1st quarter 2024, assuming the previous trough occurred in 2020.
Phasing Analysis
Long Term
Components greater than and including the 18 month nominal cycle
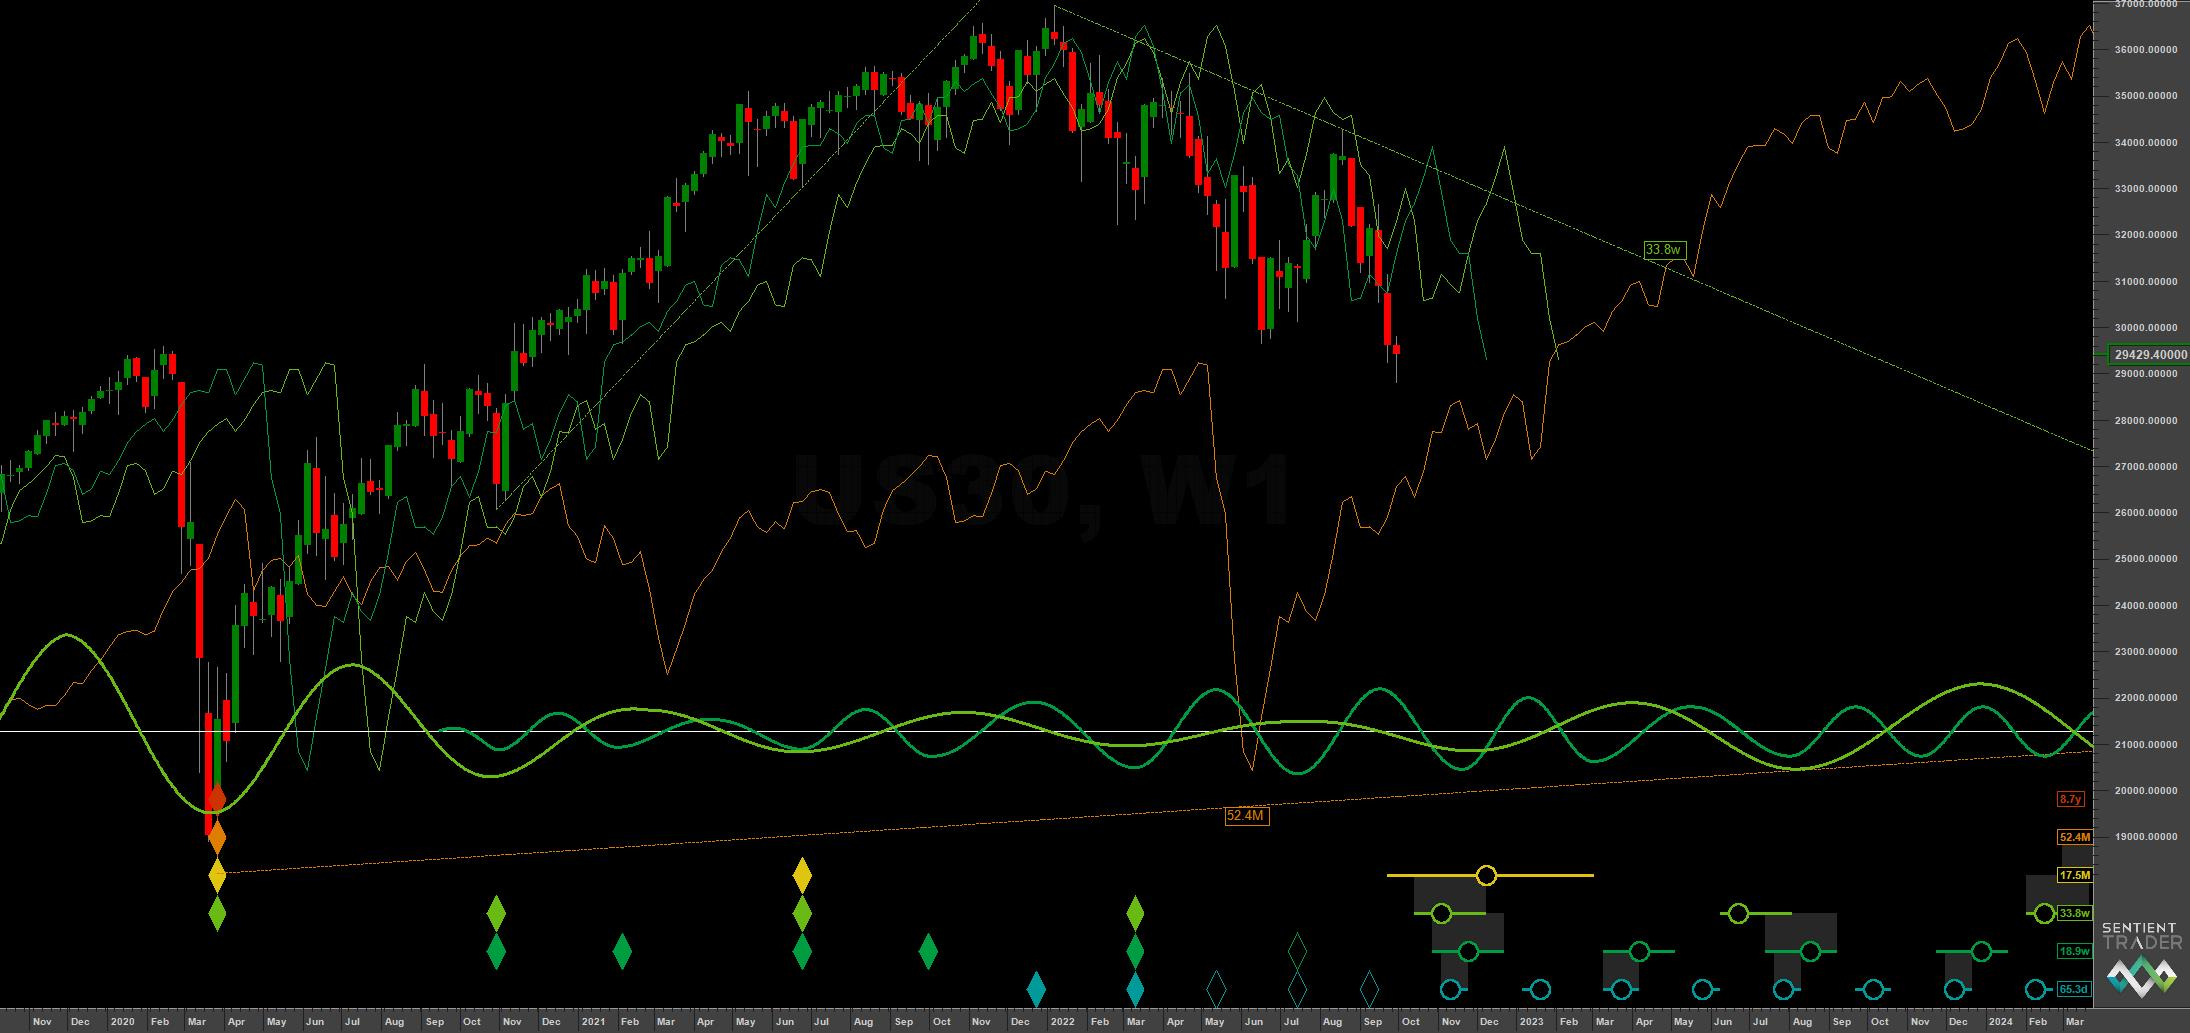
Medium Term
Components less than and including the 18 month nominal cycle
Short Term
Components around the 80 day nominal cycle

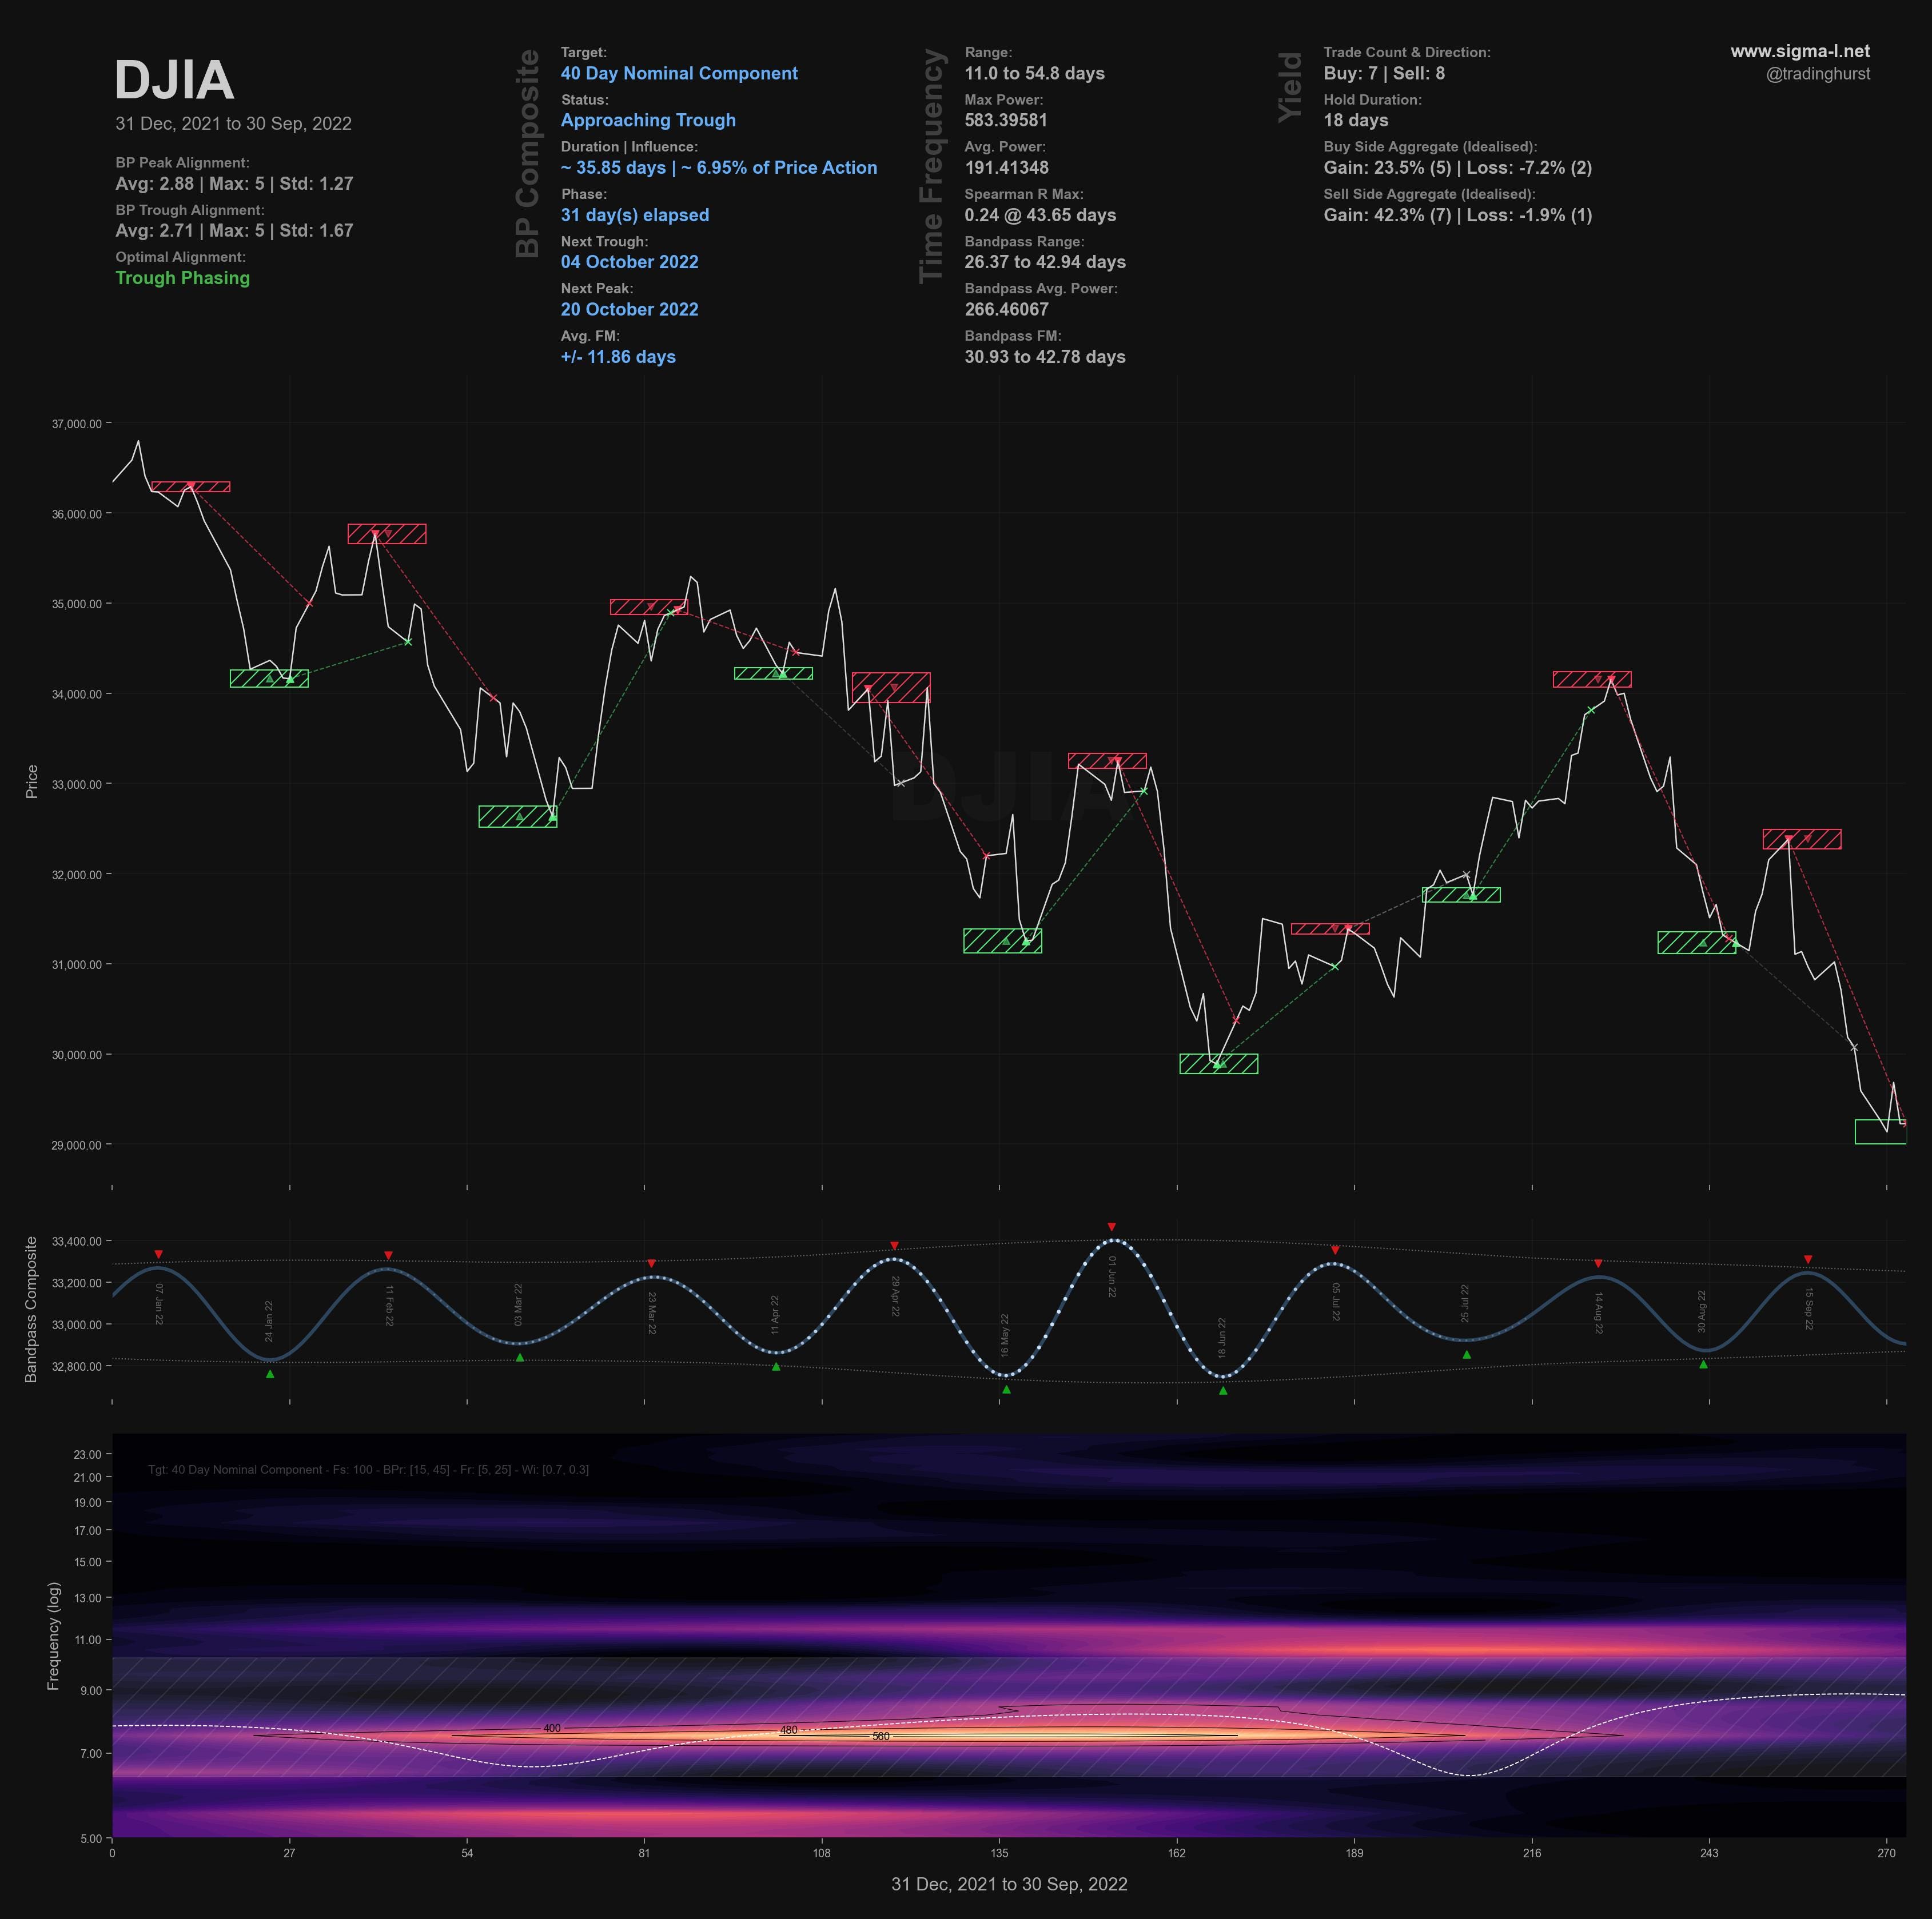
Time Frequency
Wavelet convolution output targeting 40 day nominal component
Trading Strategy
Interaction Status
Interactions and price in the FLD Trading Strategy (Advanced). This looks at an idealised 40 week cycle and an array of 3 FLD signal cycles. We apply the instrument’s phasing to the model and arrive at an overall summary for the interactions with the 20 day FLD, current and forthcoming.

Sigma-L recommendation: Neutral / Risk Buy
Entry: 10 Day VTL / FLD
Stop: Below formed 40 day nominal low
Target: 30000
Reference 20 Day FLD Interaction: E4
Underlying 40 Day FLD Status: G2
Underlying 80 Day FLD Status: H
Assuming the incoming low is only of 40 day magnitude we should expect a weak bounce here.
Traders may wish to await the incoming short to the larger low coming mid-late October via resistance at the 40 day FLD (blue on short term chart).
The 54 month FLD is down at around the 28000 area.
FLD Settings
If you do not have the use of Sentient Trader use these settings to plot FLDs in your trading software (daily scale) to more easily follow trading signals and strategy from Sigma-L.
Make sure to account for non-trading days if your broker omits them in the data feed (weekends, for example). The below offsets are given with no added calculation for non-trading days.
80 day nominal: 65.3 days | 33 day FLD offset
40 day nominal: 30.5 days | 15 day FLD offset
20 day nominal: 15.3 days | 8 day FLD offset
10 day nominal: 7.7 days | 4 day FLD offset
Correlated Exposure Options
A non exhaustive list of correlated instruments for consideration
SPDR Dow Jones Industrial Average ETF Trust DIA 0.00%↑
Global X Dow 30 Covered Call ETF DJIA 0.00%↑
iShares Dow Jones U.S. ETF IYY 0.00%↑