

USDCAD Market Cycles - 18th April 2023
The superb, profitable signal around the 80 day 'nominal' wave continues as price targets of 1.36 and 1.34 are met to the downside. Now a trough of the same component approaches, we look at the latest

Essentials: Nominal Model | FLD | FLD Trading Strategy | FLD Trading Strategy (Advanced) | Underlying Trend | Time Frequency Analysis
Analysis Summary
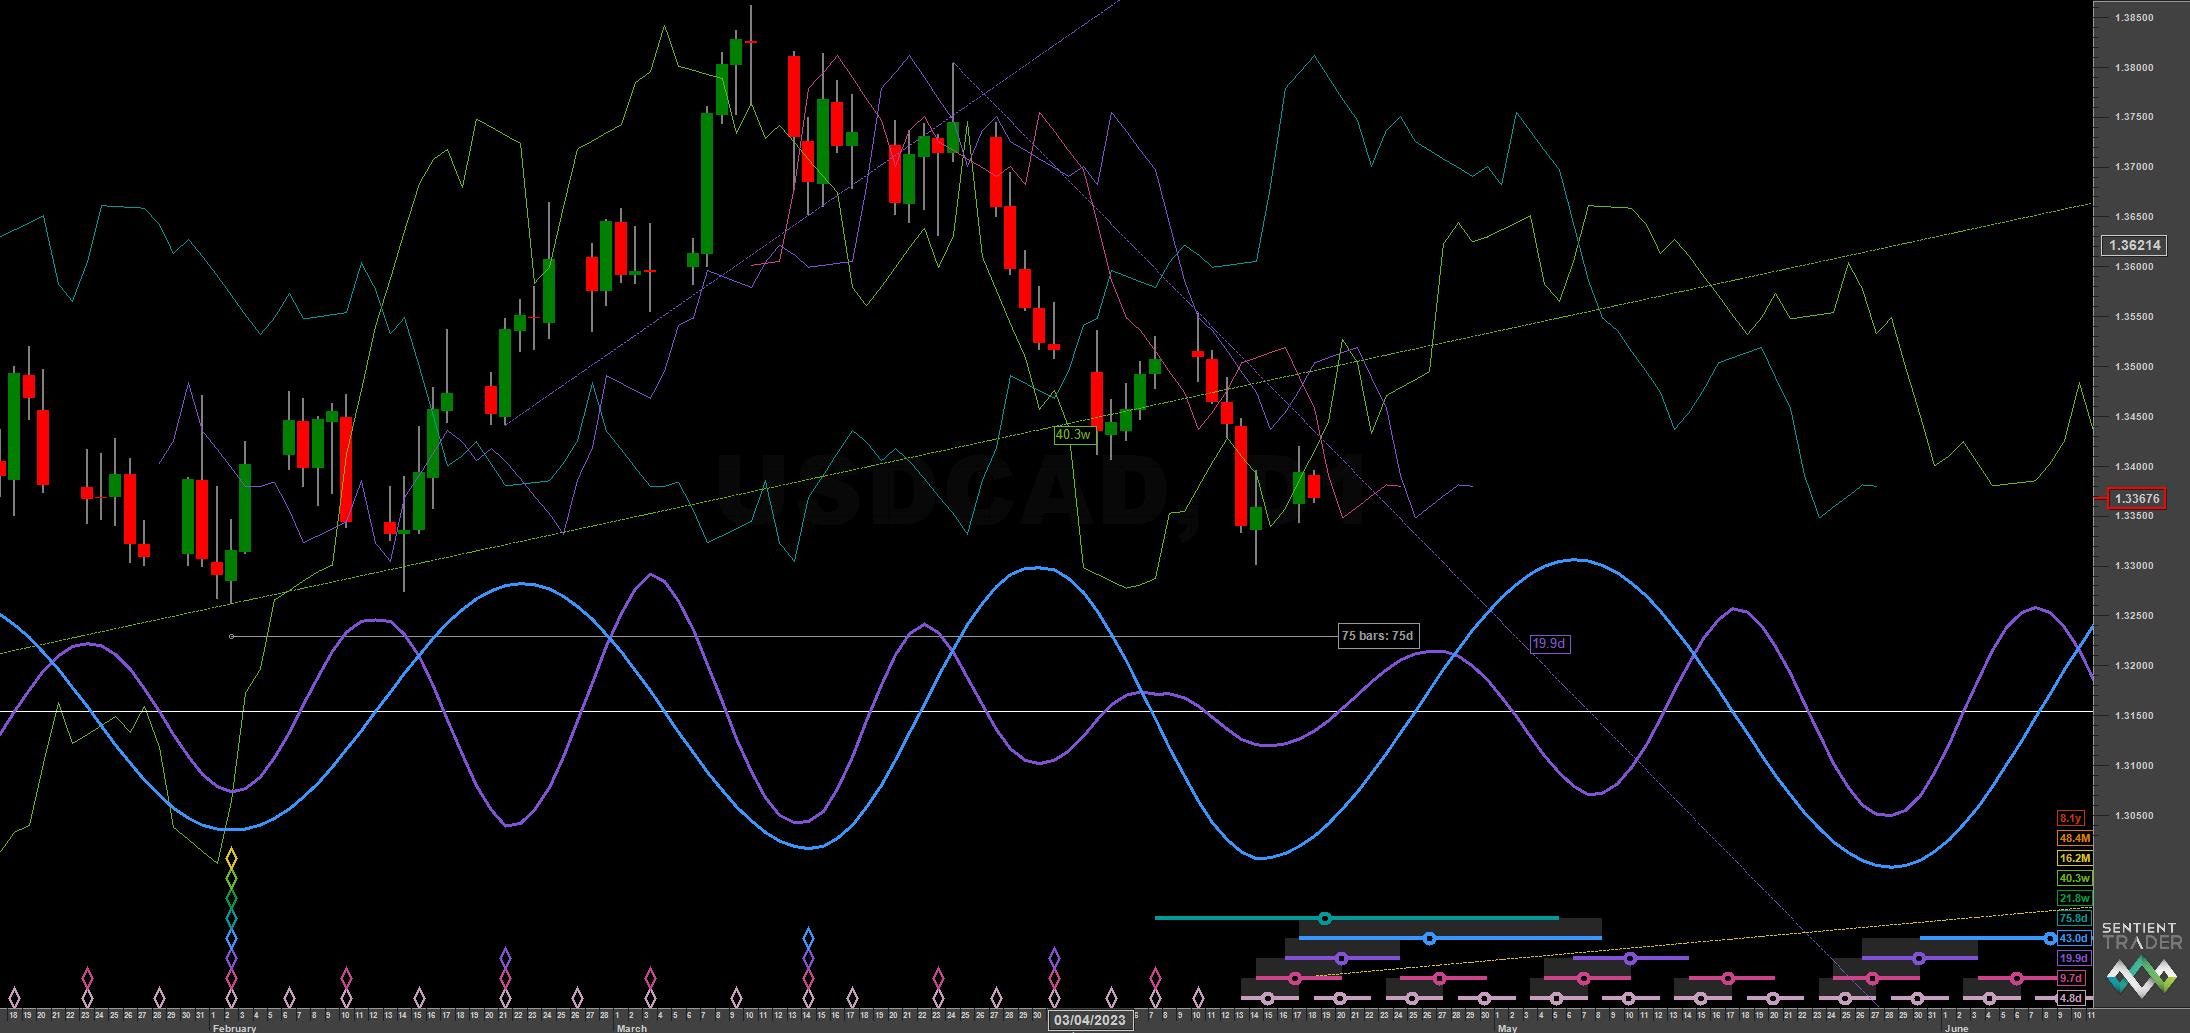
It is for good reason the component around 75 days in USDCAD made it to number 3 in our recent Wow! Signals in Financial Markets list, collating some of the most profitable signals in markets today. It’s remarkable stationarity testament to a non random process occurring in this particular instrument (and also present in other CAD crosses, take a look!). Price targets of 1.36 and 1.34 from our last report were all met and exceeded. Nearby the 20 week component is also superb, shown at the medium term view below.
There is little to add in this report aside from letting subscribers know that the component around 75 days is due to trough imminently. It is currently 75 days along it’s phase if counted from the last pinpointed low price from Sentient Trader (somewhat flawed concept but practical in this case). A more interesting inflection point may be the peak of this component, due late May at the current wavelength.
The longer phasing suggests the 18 month low is pushing up so a retrace of this magnitude is quite a bearish sign. Against that is the fact the 80 day nominal component FLD cross target at 1.3149 has yet to be met. Should this target be undershot we can assume some retained bullish power in Sigma-L (underlying trend!).
Phasing Analysis
Long Term
Components including and longer than the 18 month nominal wave

Medium Term
Components between the 20 week to 18 month nominal wave


Short Term
Components shorter than the 20 week nominal wave

Trading Strategy
Interaction Status
Interactions and price in the FLD Trading Strategy (Advanced). This looks at an idealised 40 week cycle and an array of 3 FLD signal cycles. We apply the instrument’s phasing to the model and arrive at an overall summary for the interactions with the 20 day FLD, current and forthcoming.

Sigma-L recommendation: Risk Buy
Entry: 10 Day FLD (risk on) / 20 Day FLD / 20 Day VTL
Stop: Below forming 80 day component low
Target: 1.36
Reference 20 Day FLD Interaction: A2
Underlying 40 Day FLD Status: E
Underlying 80 Day FLD Status: B-C
The 80 day FLD cross target of 1.3149 has not yet been met so caution is due here. We can reasonably expect price to find resistance at the 40 week and 80 day FLD around 1.36 in due course.
Sentient trader chart above shows potential entry points being the 10/20 day FLDs and 20 day downward VTL.
FLD Settings
If you do not have the use of Sentient Trader use these settings to plot common FLDs in your trading software (daily scale) to more easily follow trading signals and strategy from Sigma-L.
Make sure to account for non-trading days if your broker omits them in the data feed (weekends, for example). The below offsets are given with no added calculation for non-trading days.
80 day nominal: 75.8 days | 38 day FLD offset
40 day nominal: 43 days | 21 day FLD offset
20 day nominal: 19.9 days | 10 day FLD offset
10 day nominal: 9.7 days | 5 day FLD offset