

Uranium: Market Cycles - 29th March 2023
The 18 month nominal component in Uranium (via URA) is now due, we look at the evidence for the formation of it and, in addition, the path of price over the coming months

Essentials: Nominal Model | FLD | FLD Trading Strategy | FLD Trading Strategy (Advanced) | Underlying Trend | Time Frequency Analysis
Analysis Summary
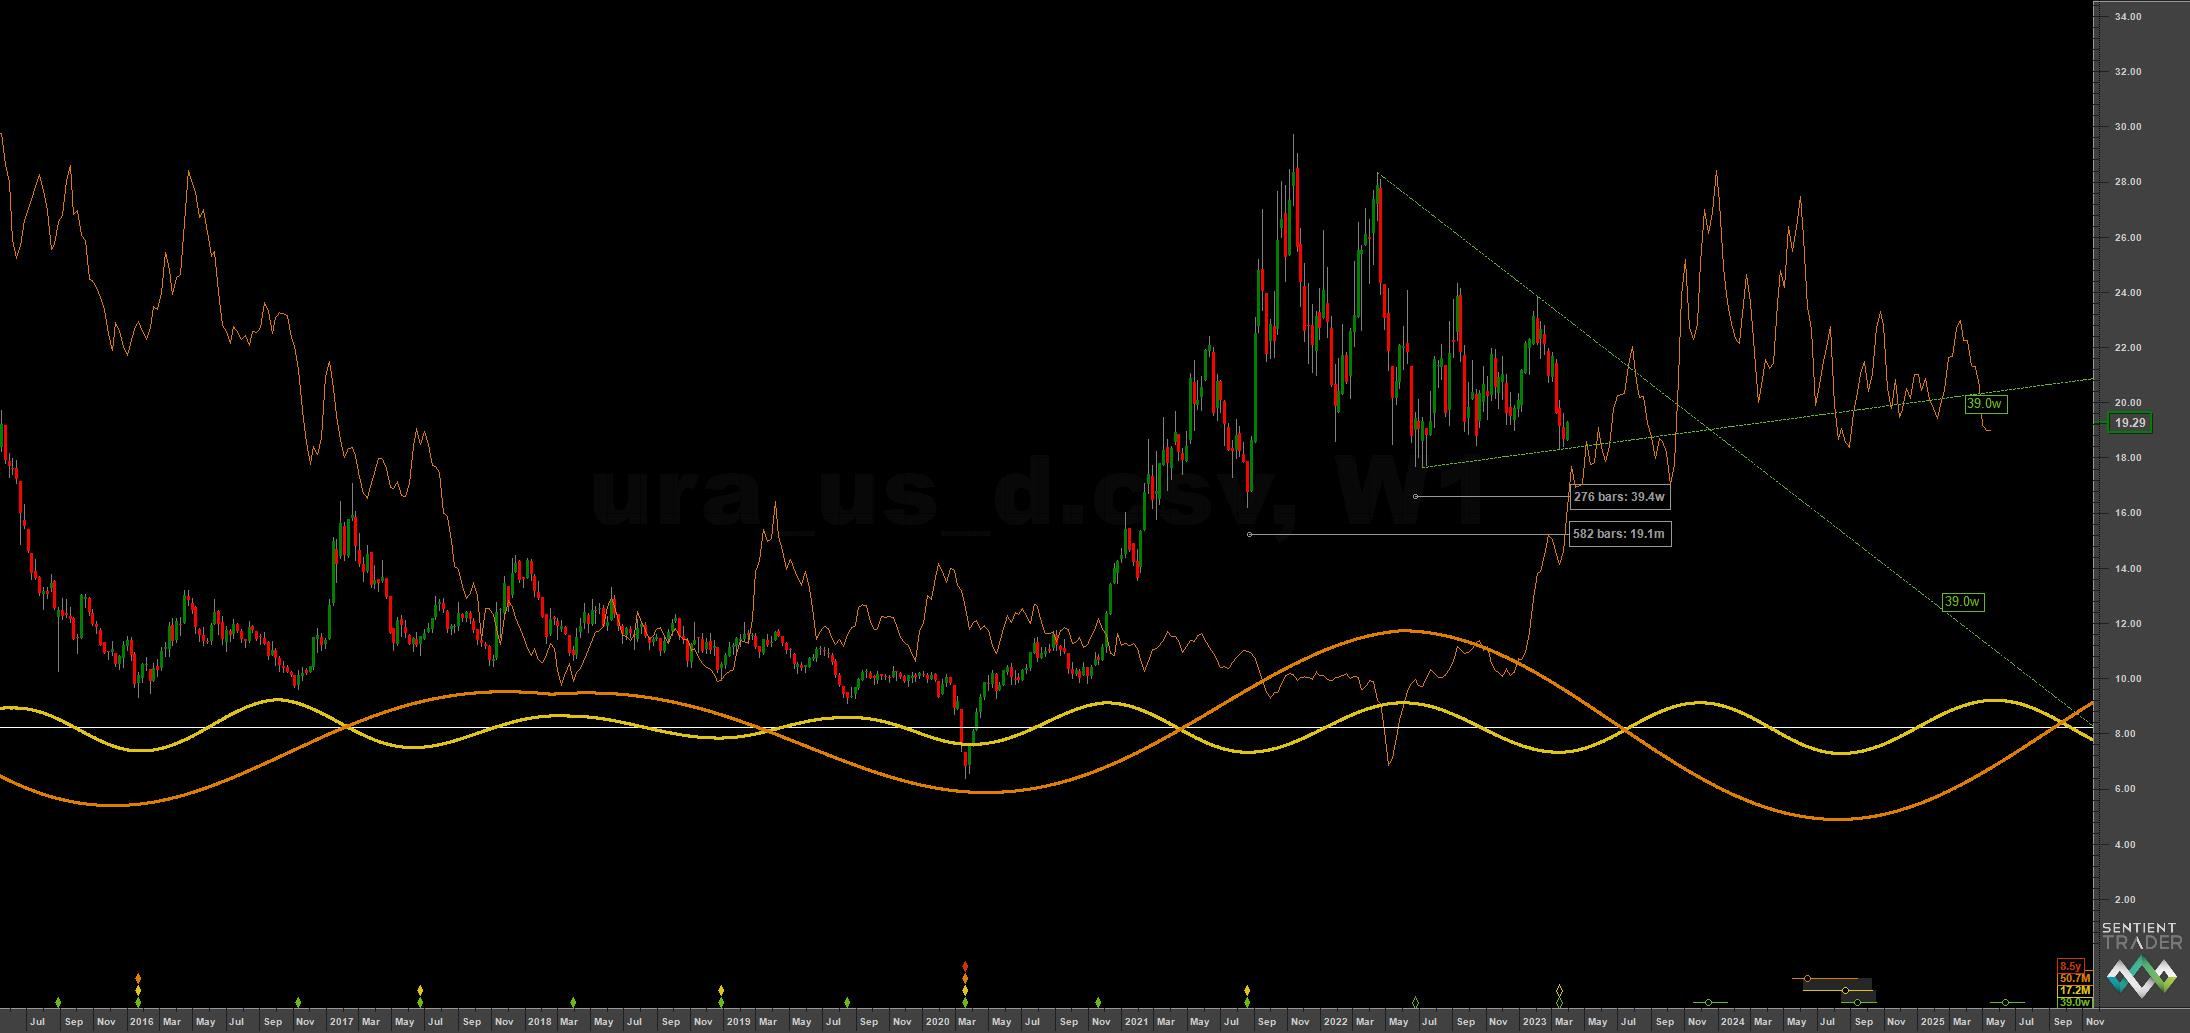
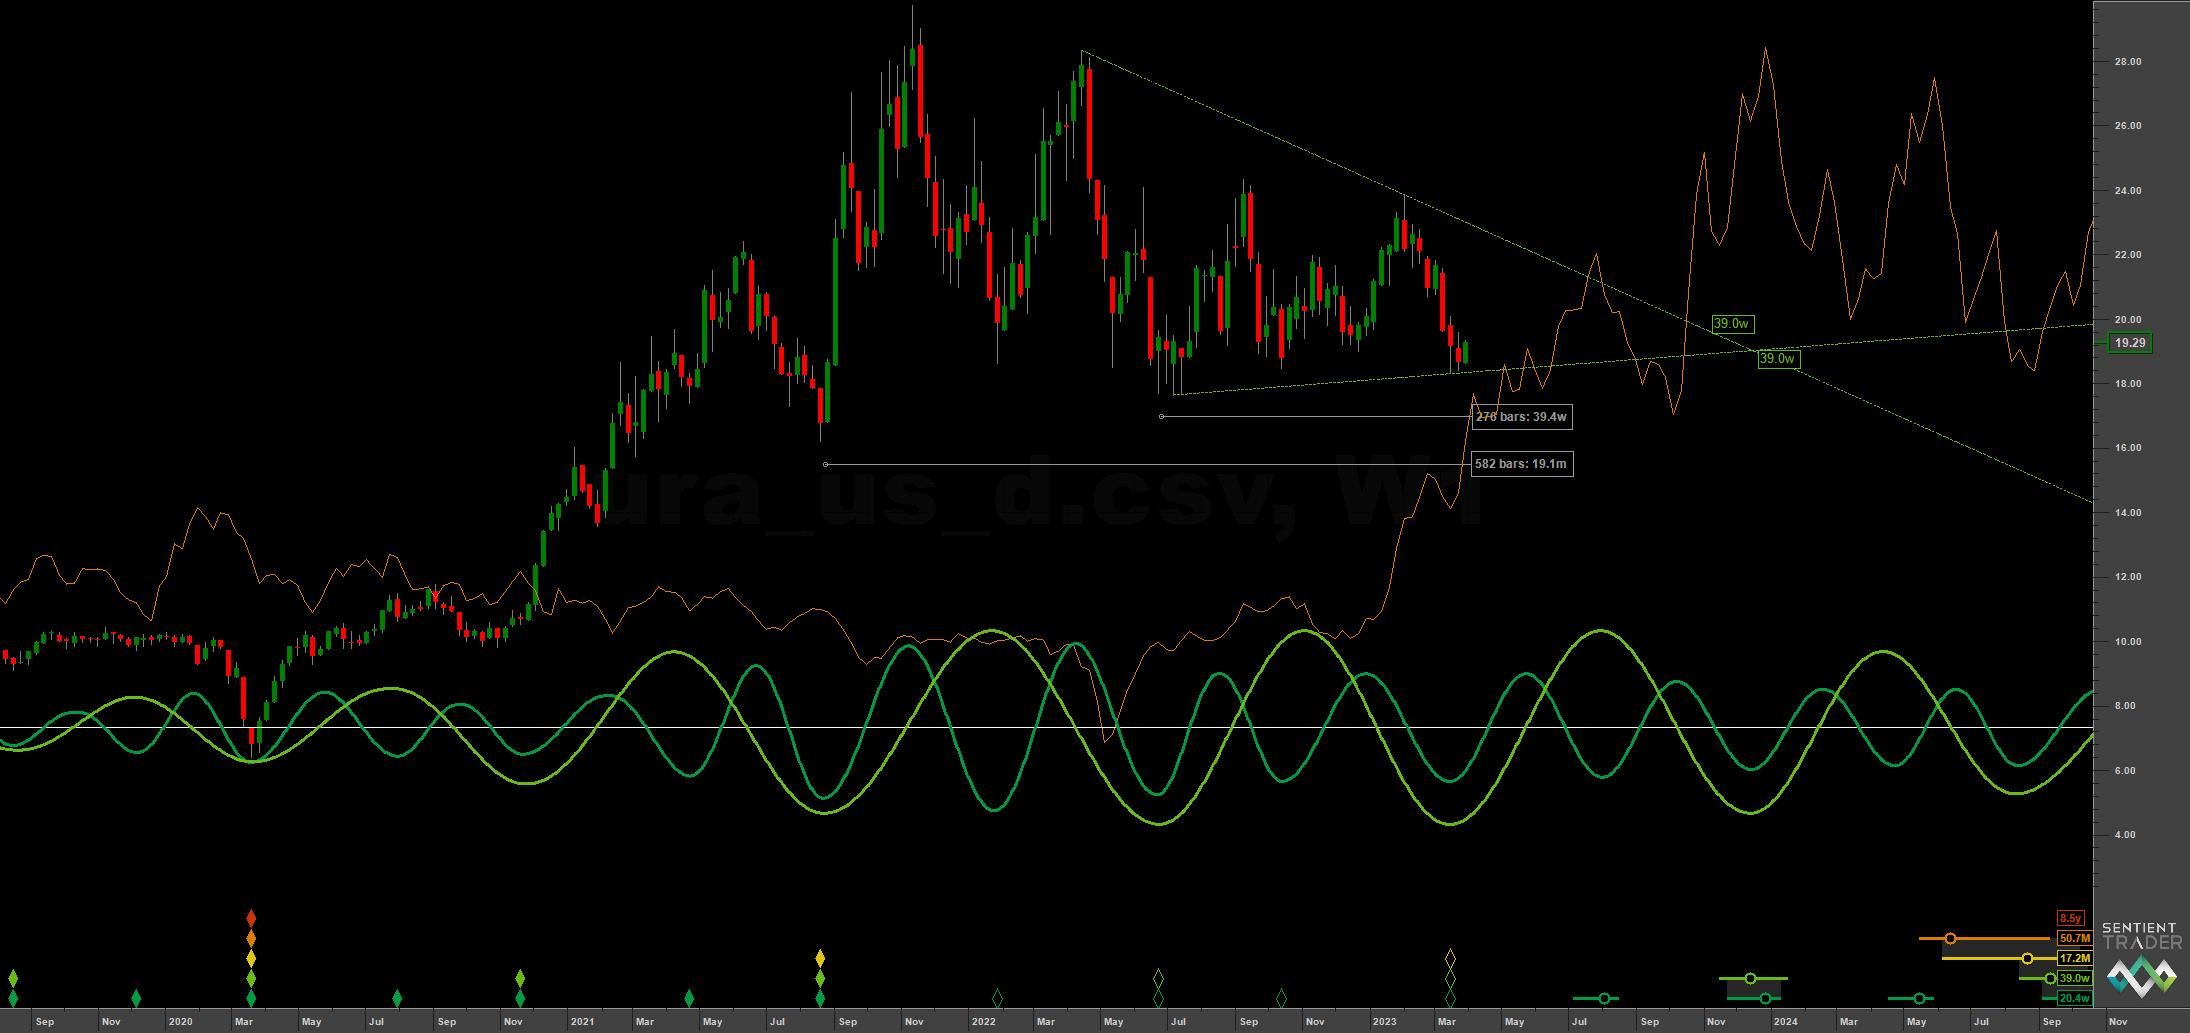
Uranium, phased in the main via the Global X ETF URA 0.00%↑ is very near an 18 month nominal low. This has been anticipated for several months since the 18 month peak and retrace of early 2022 formed and as the slow triangulation, that typified price action over recent months, begins to resolve. Price is very near the 54 month FLD (shown on the long term ST analysis below) and is in an excellent position for both price and time inflection points.
The 20 and 40 week components at the medium term are dictating most of the power in price and that should be retained in the next move up, tempered somewhat by longer components. Time frequency analysis below demonstrates the clarity of the 20 week wave in particular. The longer component (nominally the 54 month wave) suggests a lower low in mid-late 2024, the approach to which may be fairly sideways and track the FLD, a bullish sign. This assumption makes the reasonable inference that the trough in early 2020 was of 9 year magnitude. The proposed low in 2024 will be a tremendous buying opportunity in Uranium and we will track the progress of this next 18 month component with anticipation of that.
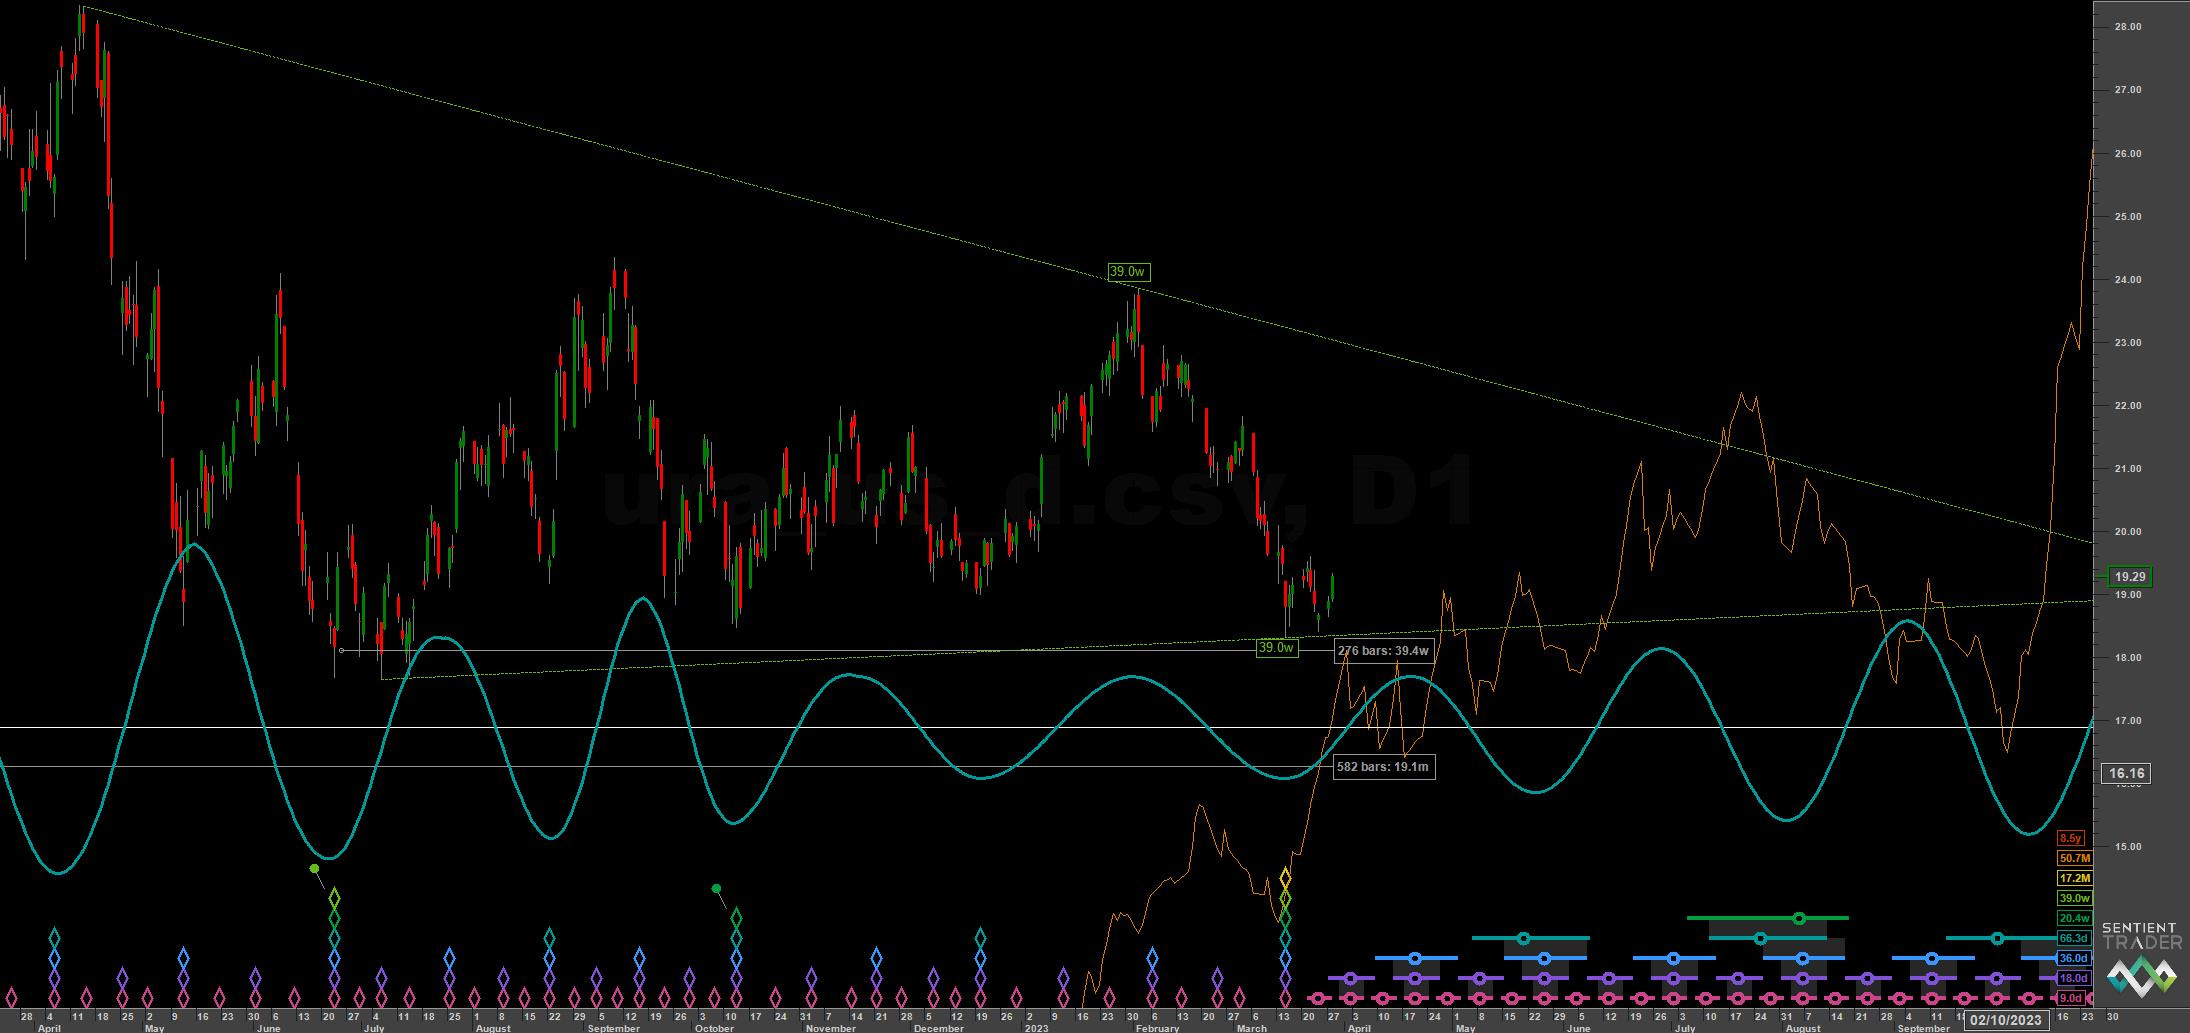
Formal confirmation of the 18 month component low occurring will be a median weekly price cross of the 40 week downward VTL, shown on the Sentient Trader chart below in green. This VTL also formed the top plane of the triangulation in recent months. The cycle peak of the 18 month component, at current wavelengths, is due at the end of the year.
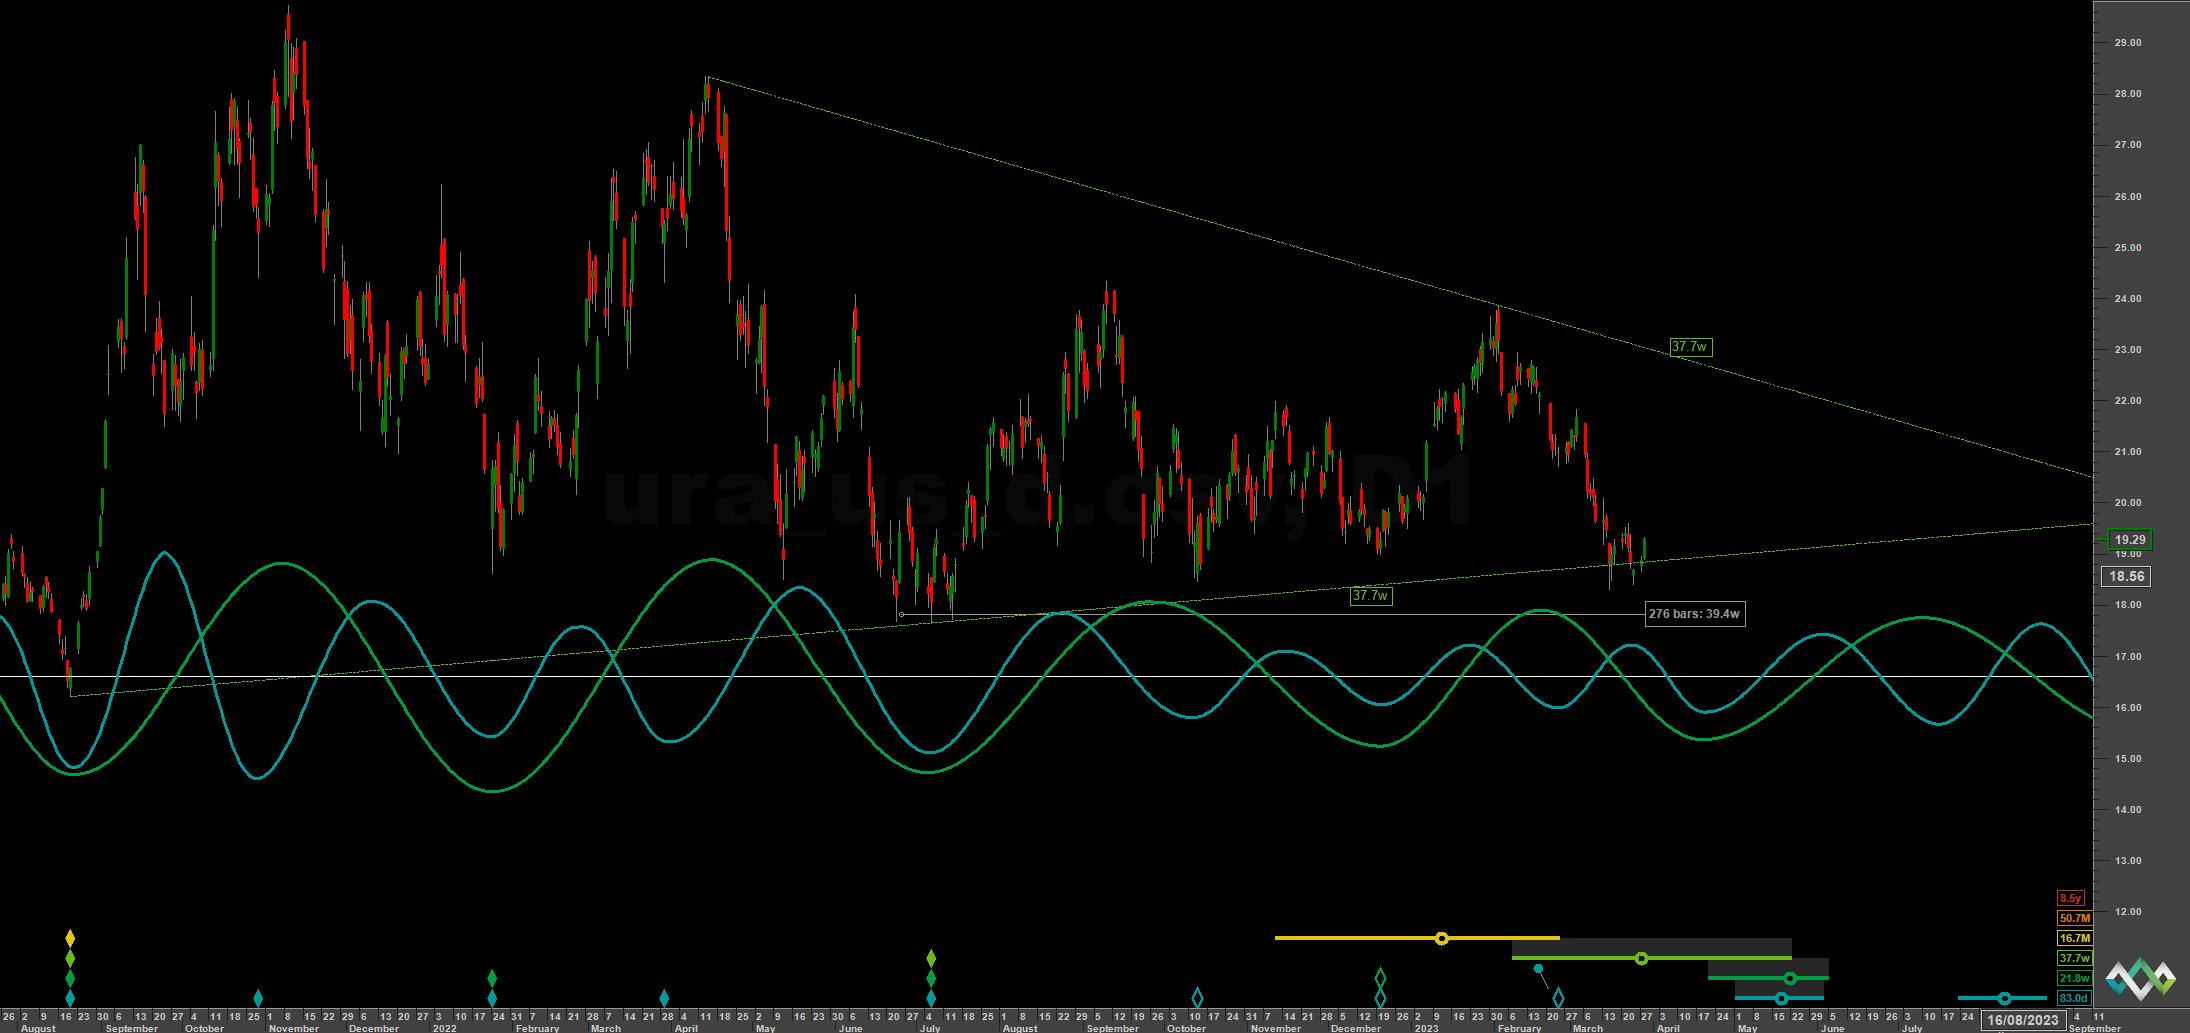
At the shorter term we have added several analysis of the prominent component around 75 days, notionally the 80 day nominal wave in Hurstonian nomenclature. Both URA 0.00%↑ and URNM 0.00%↑ have a very similar structure (as you may expect) and show excellent stationarity at this degree. Sentient Trader has a similar looking phasing via it’s biased pattern analysis approach.
We have included the phasing analysis of a slight outlier scenario identified with a 40 day component margin of error. Should this phasing be accurate the 18 month component will occur mid April following a further fall to the 54 month FLD support. Watch this initial move up for signs of weakness should that scenario be correct.
In all other cases…
A higher low for the 40 day component in mid April will suggest strongly that the 18 month component low has indeed occurred mid-late March 2023.
Phasing Analysis
Long Term
Components including and longer than the 18 month nominal wave
Medium Term
Components between the 20 week to 18 month nominal wave

Short Term
Components shorter than the 20 week nominal wave


Trading Strategy
Interaction Status
Interactions and price in the FLD Trading Strategy (Advanced). This looks at an idealised 40 week cycle and an array of 3 FLD signal cycles. We apply the instrument’s phasing to the model and arrive at an overall summary for the interactions with the 20 day FLD, current and forthcoming.

Sigma-L recommendation: Buy
Entry: 10 Day FLD / 20 Day FLD
Stop: Below possibly forming 18 month nominal low
Target: 22 (40 week VTL) then 24
Reference 20 Day FLD Interaction: A (H)
Underlying 40 Day FLD Status: A (H2)
Underlying 80 Day FLD Status: A (F4)
The two scenarios outlined above are listed here, interactions first reflect the scenario where the 18 month has occurred and, in brackets, the interactions should there be one more 40 day component to come.
If the former is accurate a move back up to 24 is entirely possible. Initially price will have to formally confirm the 18 month nominal low by making a median weekly price cross of the 40 week downward VTL, shown on the ST charts above in green.
FLD Settings
If you do not have the use of Sentient Trader use these settings to plot common FLDs in your trading software (daily scale) to more easily follow trading signals and strategy from Sigma-L.
Make sure to account for non-trading days if your broker omits them in the data feed (weekends, for example). The below offsets are given with no added calculation for non-trading days.
80 day nominal: 73.8 days | 37 day FLD offset
40 day nominal: 37.2 days | 18 day FLD offset
20 day nominal: 18.3 days | 9 day FLD offset
10 day nominal: 9.2 days | 5 day FLD offset
Correlated Exposure
A non exhaustive list of correlated instruments for consideration
Global X Uranium ETF URA 0.00%↑
North Short Global Uranium Mining ETF URNM 0.00%↑
Cameco CCO 0.00%↑
Uranium Energy Corp UEC 0.00%↑
Rio Tinto RIO 0.00%↑