

Uranium: Hurst Cycles - 10th January 2023
Uranium via URA is finishing the triangulation that has typified this instrument over the last 9 months. We look at the evidence for the incoming 18 month nominal low and examine the similar UEC

Essentials: Nominal Model | FLD | FLD Trading Strategy | FLD Trading Strategy (Advanced) | Principle of Nominality | Underlying Trend | Time Frequency Analysis
Analysis Summary
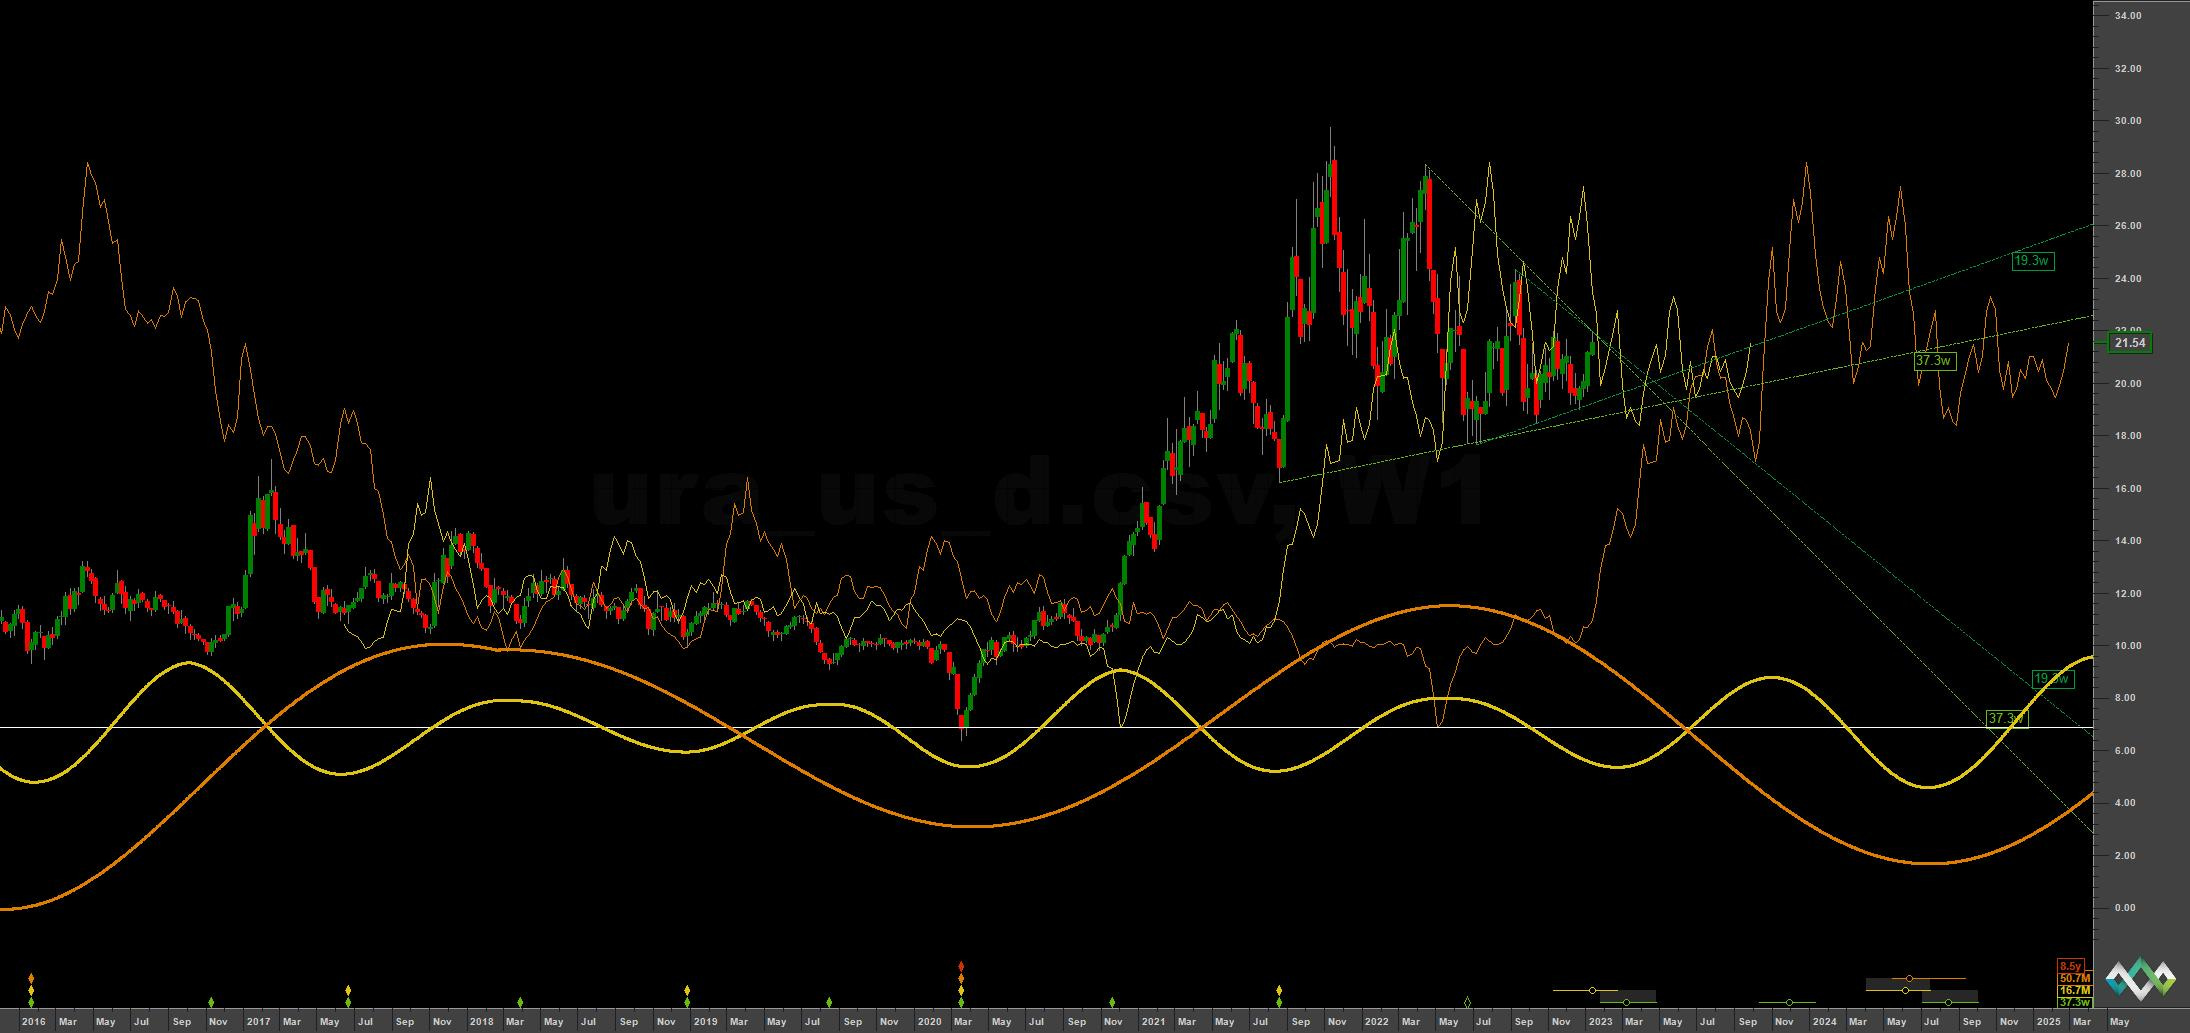
Uranium, via our favourite analogue URA 0.00%↑, has continued to generally move sideways, spiking briefly from the most recent 80 day component low iteration which occurred around late November - mid December 2022. As mentioned in previous reports, price has formed a very obvious triangulation ‘pause zone’ in the run up to the next 18 month nominal low, which is due imminently.
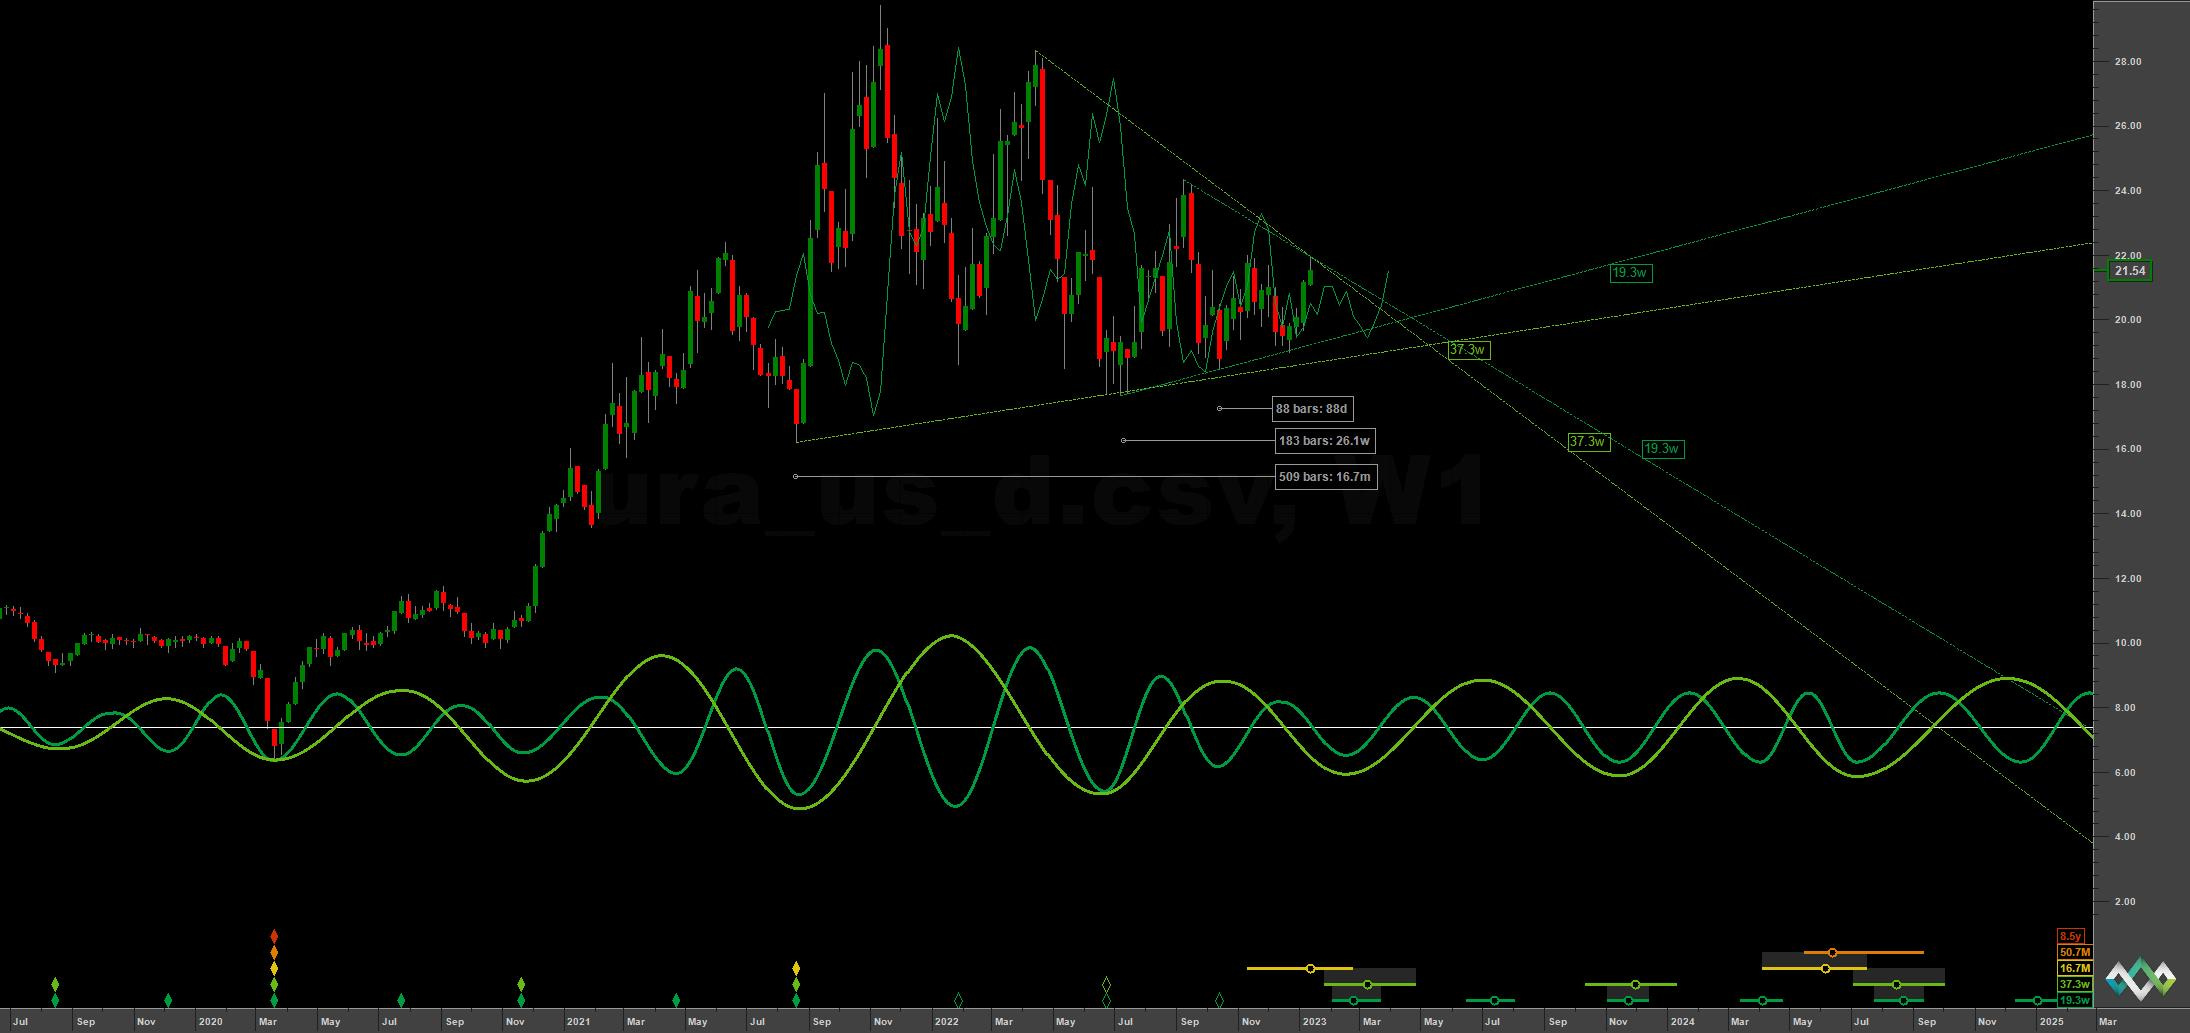
Triangulation occurs when the larger component (in this case the 54 month wave) starts to push down in opposition to smaller components pushing up. In this case the 18 month component pushed up initially in August 2021 and thereafter the inner structure of the triangle has been defined by the excellent 40 and 20 week components. Each one losing amplitude as the zone progresses. This amplitude will return with force when the 18 month component makes it’s low, which is looking like mid February according to the current phasing, in URA. That said the most recent 80 day component low December 20th is well within the average wavelength of the longer component at around 16.7 months. The outlier scenario - but supported by compelling evidence of a 20 week nominal low occuring at that point in UEC 0.00%↑
From 30th November Report:
Medium term price is likely forming the peak (or has formed) of the 20 week component. The 40 week VTL down at around 18 is likely to be tested and this forms the lower bound of the triangulation. Triangulation in itself is simply amplitude modulation over time, the larger components exerting downward pressure in a visually apparent manner. The 18 month nominal low is expected in February 2023 and should be an excellent chance to exploit a bullish part of the anticipated sideways (neutral) underlying trend for a few months.
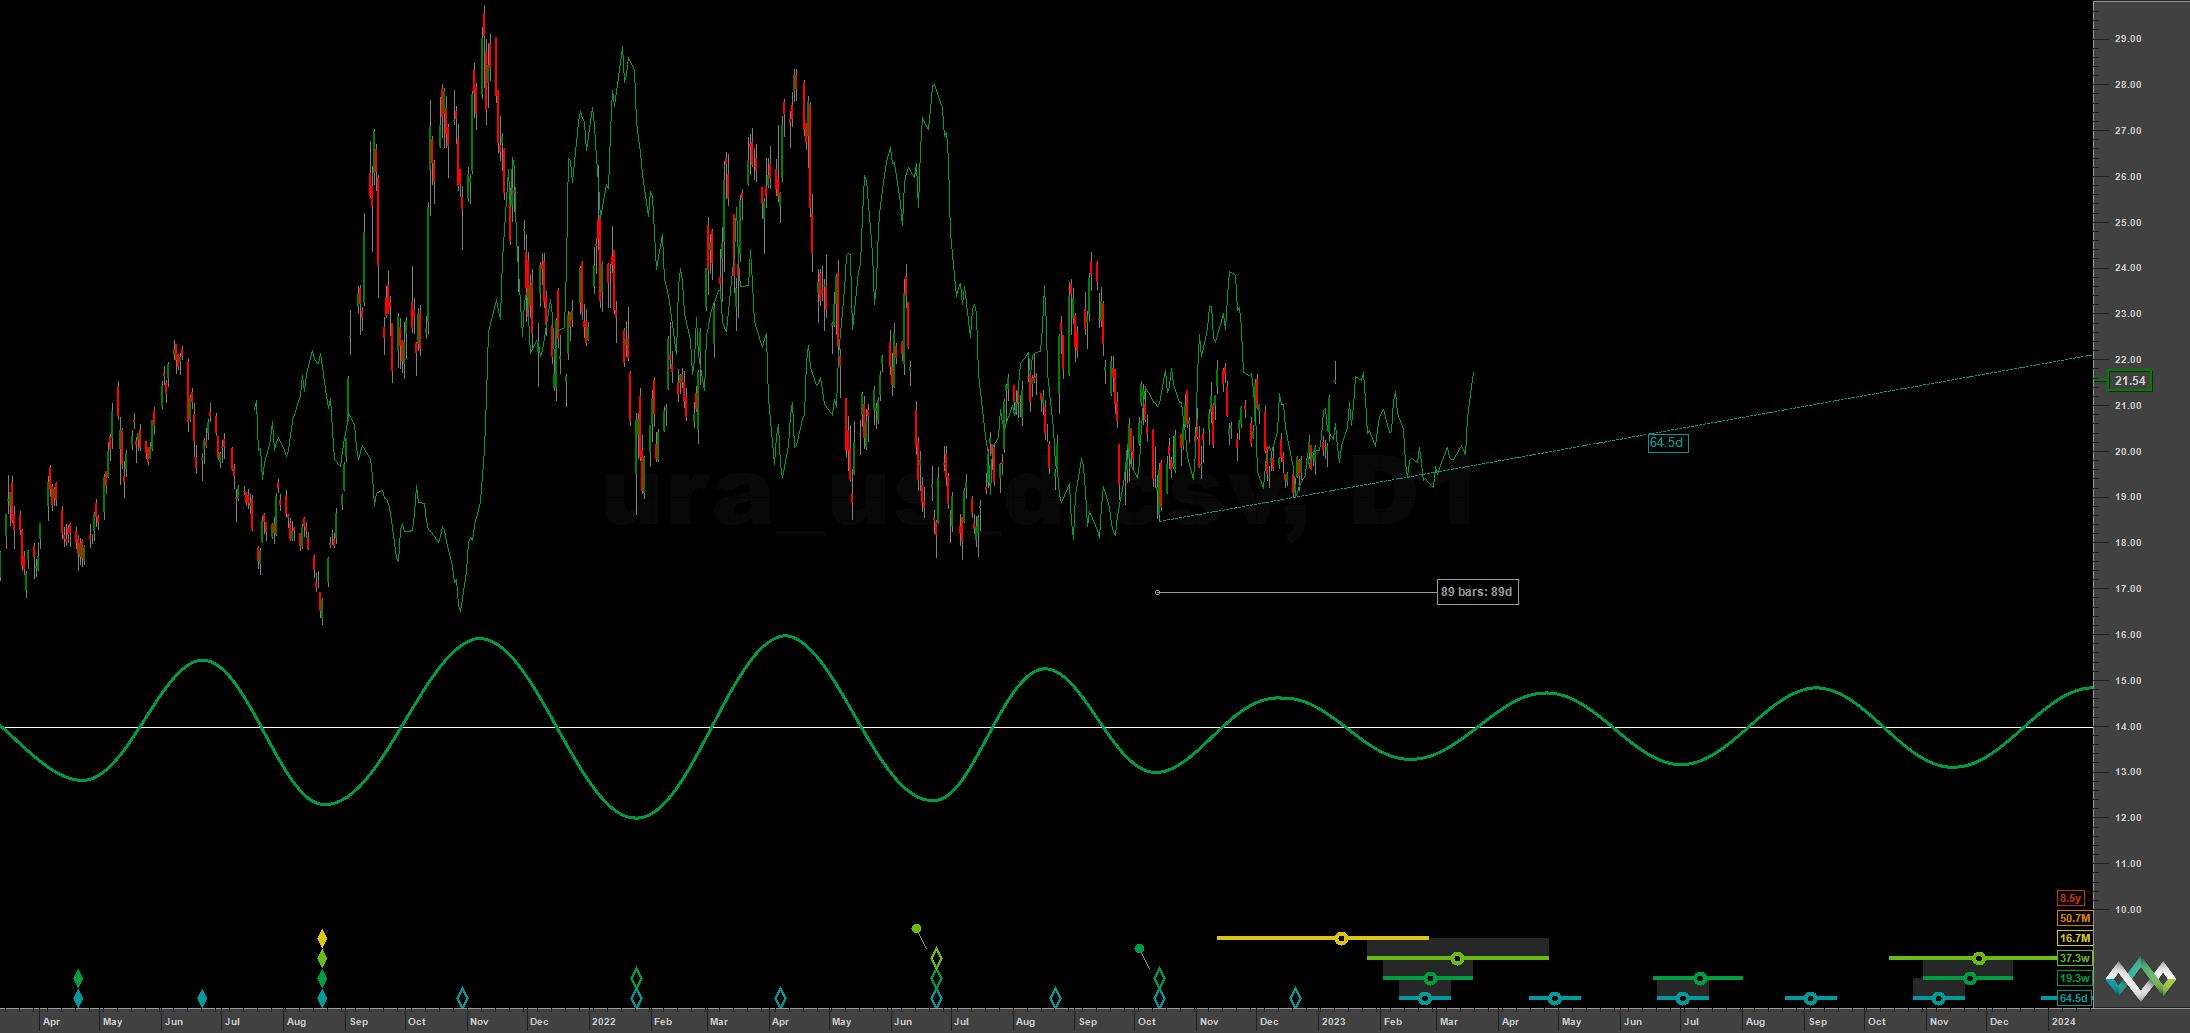
Price tested the 40 week VTL prior to moving up from the most recent 80 day low iteration. Currently at the short term it is possible price is forming the 80 day nominal peak. Certainly if the 18 month nominal low is still to come a relatively early (bearish) peak is likely.
The next 80 day nominal low is the one to watch then, for both scenarios. Should the 18 month nominal low be still to come the shape of this cycle should be bearish, perhaps finding support as anticipated at the 54 month FLD around 17. Should the 18 month component have occurred, (which would imply a significant frequency modulation of the 20 and 40 week components from the ST analysis), we can expect a higher low in mid February.
Longer term this should be the 3rd and final 18 month iteration of the 54 month wave, which, by the current phasing, is due to trough in mid 2024.
Phasing Analysis
Sentient Trader
Utilising a pattern recognition algorithm and Hurst’s diamond notation
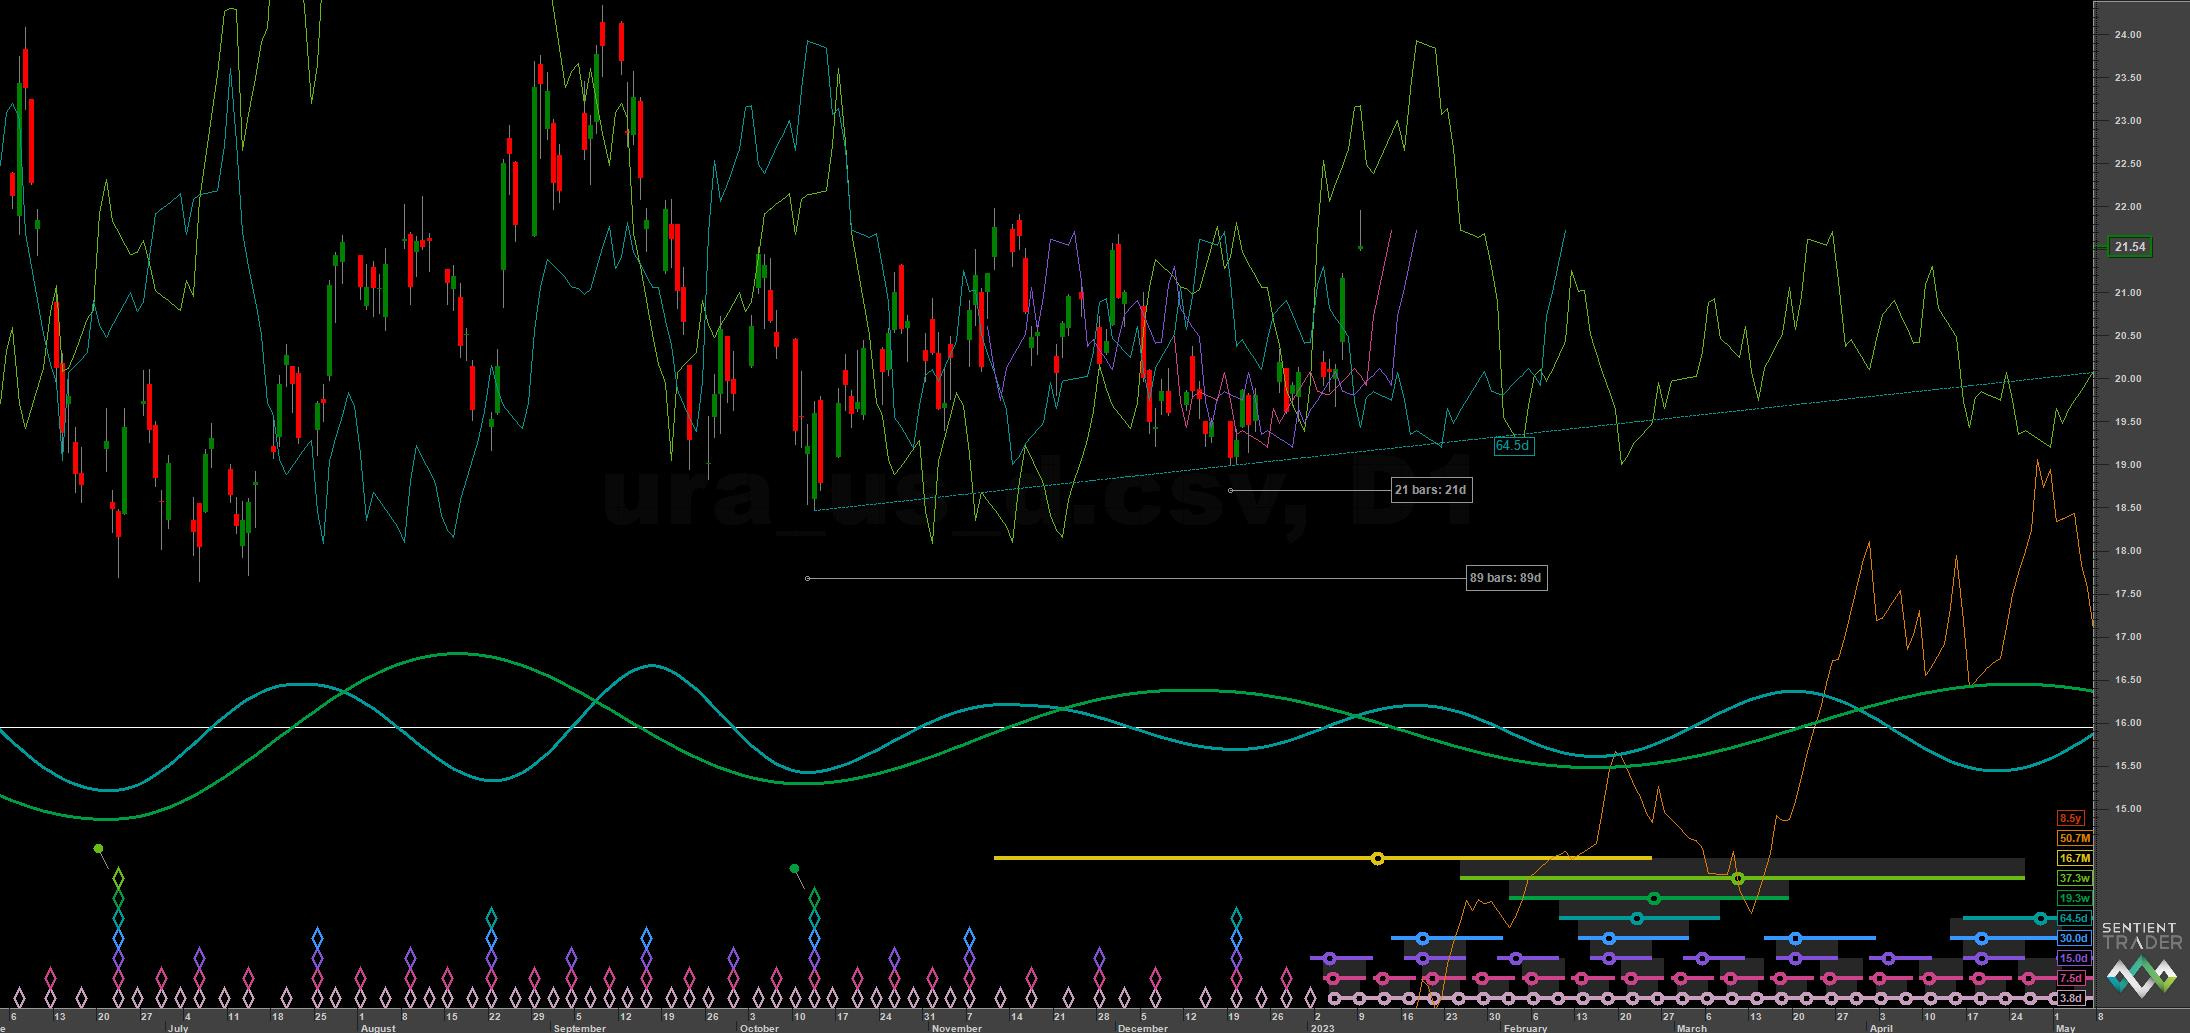
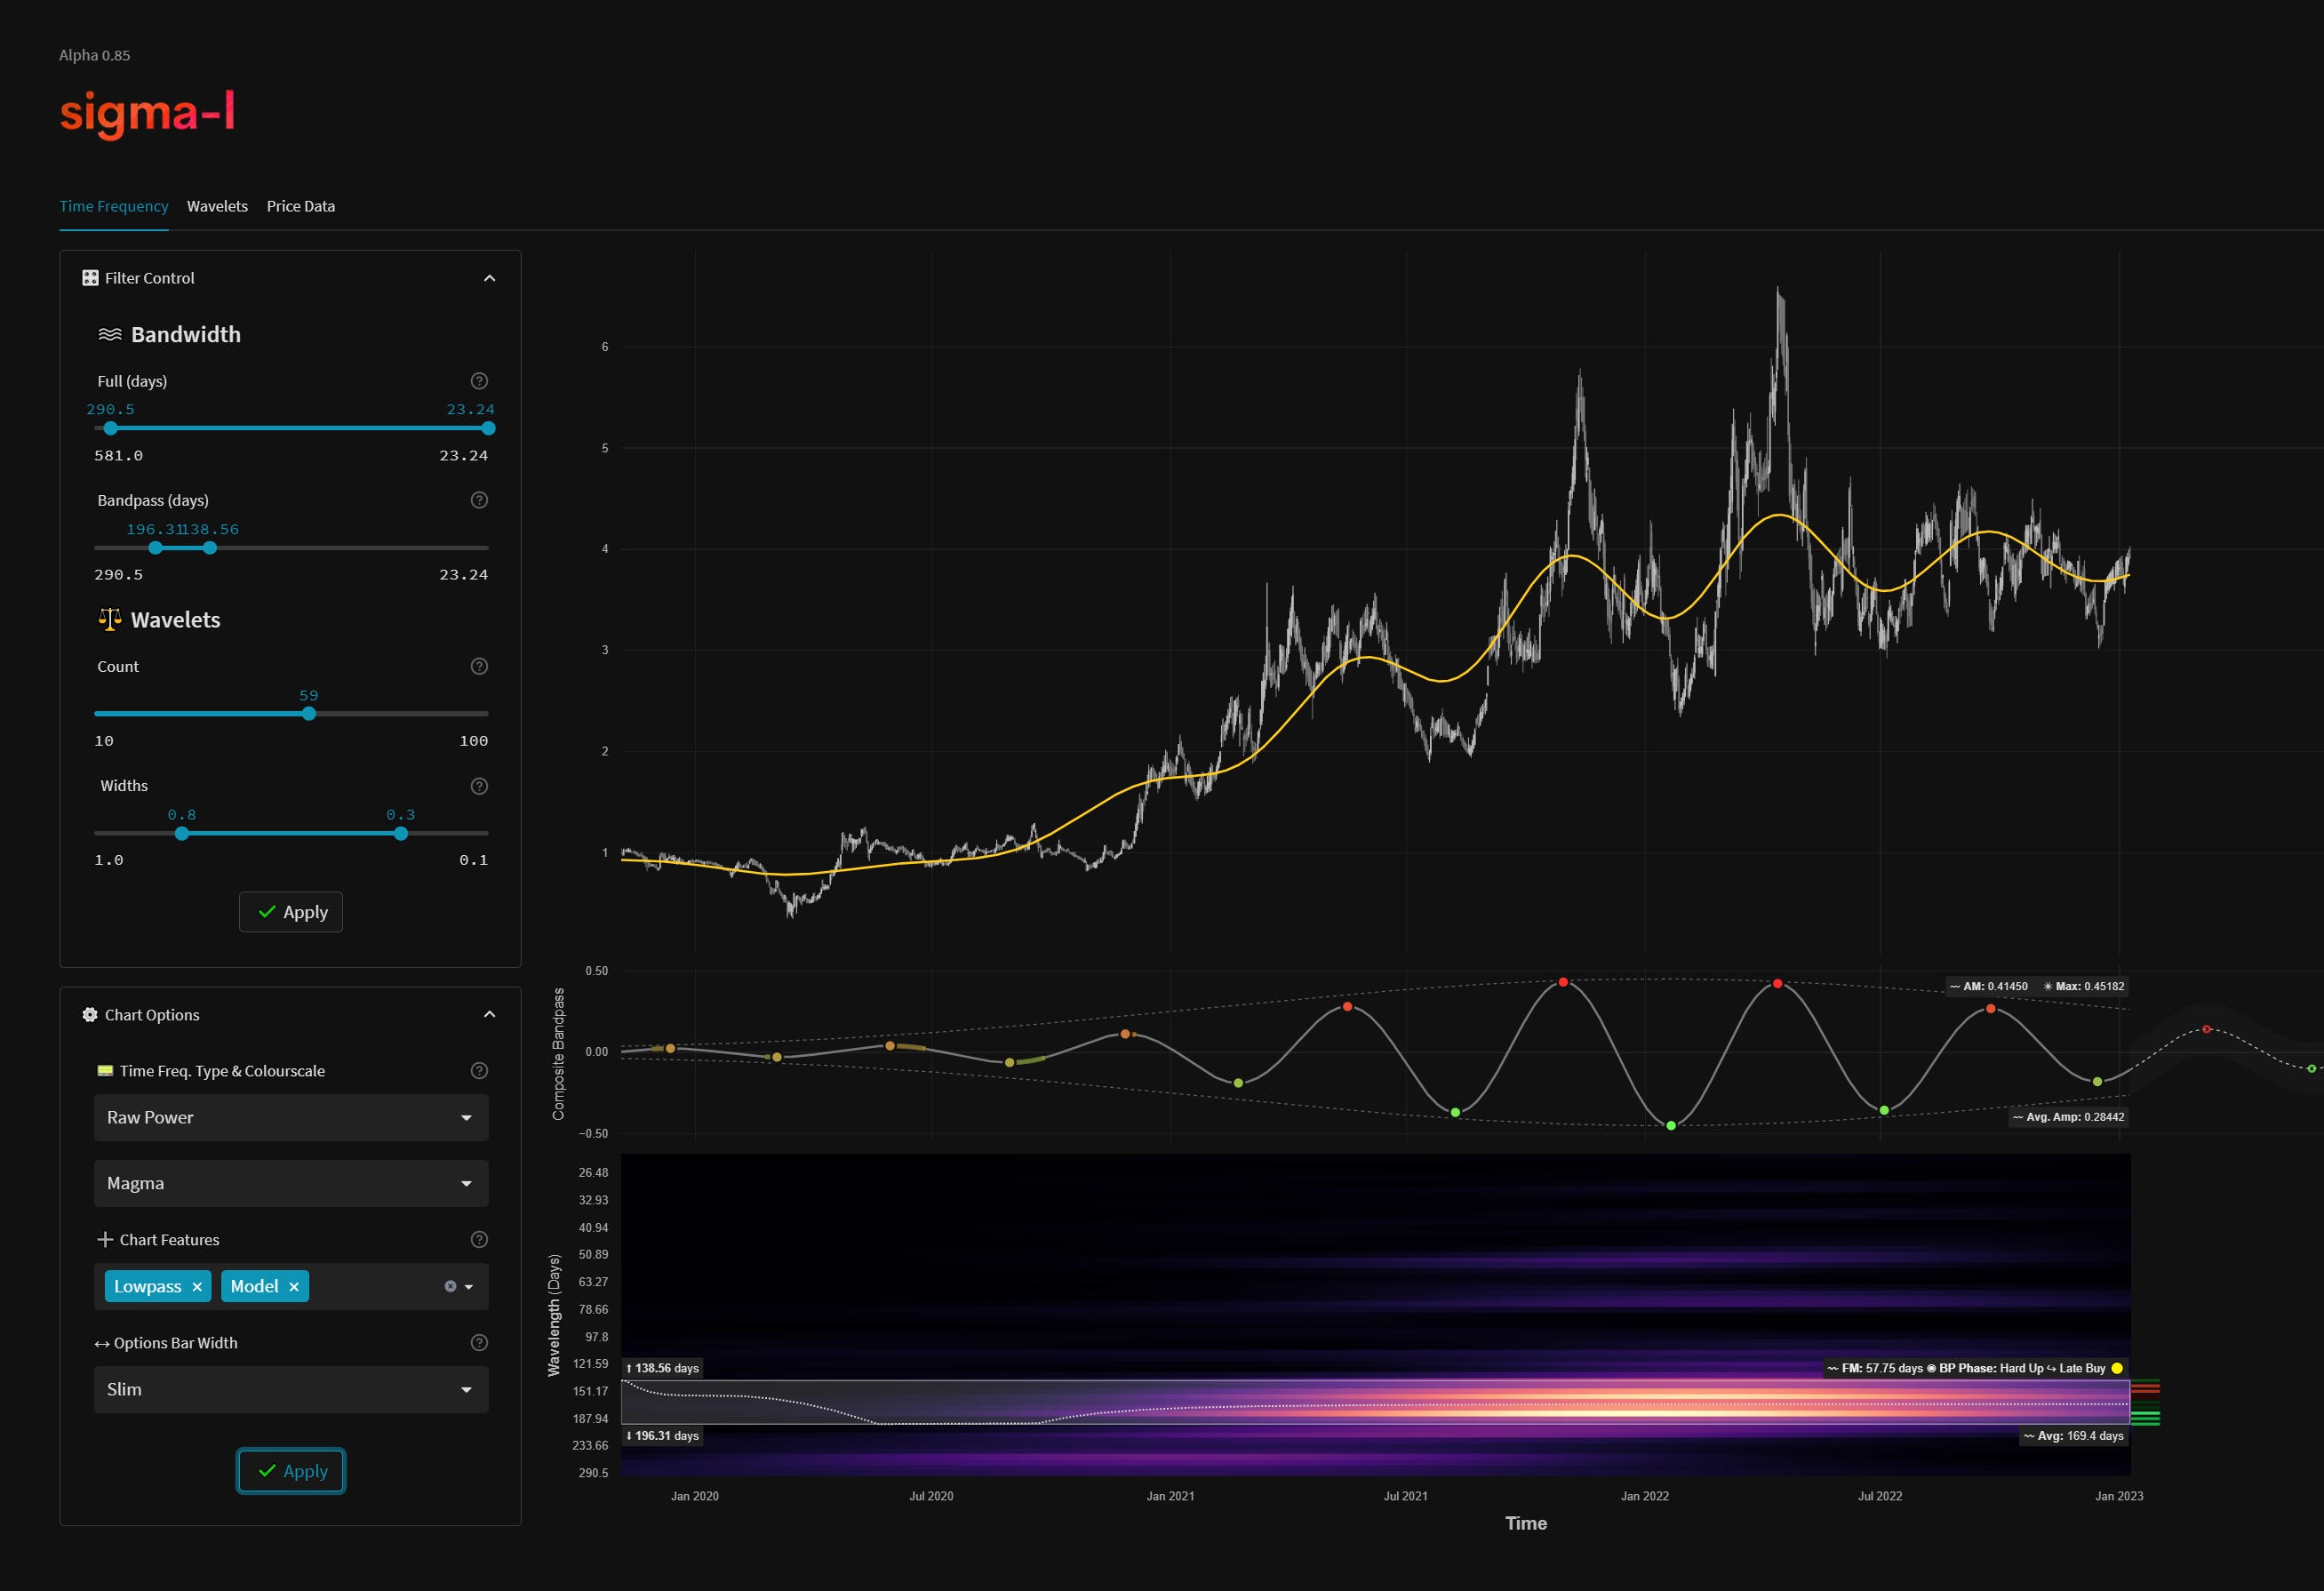
Time Frequency Analysis
Wavelet convolution targeting the 20 week and 80 day nominal components
Uranium Energy Corp UEC 0.00%↑


Trading Strategy
Interaction Status
Interactions and price in the FLD Trading Strategy (Advanced). This looks at an idealised 40 week cycle and an array of 3 FLD signal cycles. We apply the instrument’s phasing to the model and arrive at an overall summary for the interactions with the 20 day FLD, current and forthcoming.

Sigma-L recommendation: Sell
Entry: 10 Day FLD / 20 Day FLD
Stop: Above forming 80 day nominal peak
Target: 80 day VTL at 20 then perhaps 54 month FLD support at 16
Reference 20 Day FLD Interaction: D4
Underlying 40 Day FLD Status: F2
Underlying 80 Day FLD Status: H
Assuming that the 18 month nominal low is to come a short into that low is viable for the move into mid February. Subsequent to that the 18 month nominal low will be a strong bullish move for a few months.
If the 18 month low has occurred on the 20th of December the 80 day component currently progressing will likely form a higher low in mid February. That is the outlier at this point in URA 0.00%↑ , at least.
FLD Settings
If you do not have the use of Sentient Trader use these settings to plot common FLDs in your trading software (daily scale) to more easily follow trading signals and strategy from Sigma-L.
Make sure to account for non-trading days if your broker omits them in the data feed (weekends, for example). The below offsets are given with no added calculation for non-trading days.
80 day nominal: 64.5 days | 32 day FLD offset
40 day nominal: 30 days | 15 day FLD offset
20 day nominal: 15 days | 8 day FLD offset
10 day nominal: 7.5 days | 4 day FLD offset
Correlated Exposure
A non exhaustive list of correlated instruments for consideration
Global X Uranium ETF URA 0.00%↑
North Short Global Uranium Mining ETF URNM 0.00%↑
Cameco CCO 0.00%↑
Uranium Energy Corp UEC 0.00%↑
Rio Tinto RIO 0.00%↑