

TSLA (Tesla Inc) - 28th May 2025 | @ 162 Day Cycle | + 63.35%
Last trade: + 63.35% | 'B' class signal detected in Tesla Inc. Running at an average wavelength of 162 days over 13 iterations since May 2020. Currently peaking.


ΣL Cycle Summary
A serene up leg overall here in TSLA from this excellent signal around 160 days, largely stationary in our sample over the last 5 years or so and measured via 13 iterations. A period of consolidation marked the early stages of the move, such is the case in many price structures at cycle inflection points - it is rare to get a ‘V’ shaped reversal. Time did the rest, resulting in a ~ 50% retrace of the last down leg. At the time of writing we are near the next peak, perhaps slightly early, see the trade details below for more.
Trade Update
Summary of the most recent trade enacted with this signal and according to the time prediction detailed in the previous report for this instrument, linked below.
Type: Buy - TSLA (Tesla Inc.) 10th March 2025
Entry: 10th March 2025 @ 222.15
Exit: 28th May 2025 @ 362.89
Gain: 63.35%
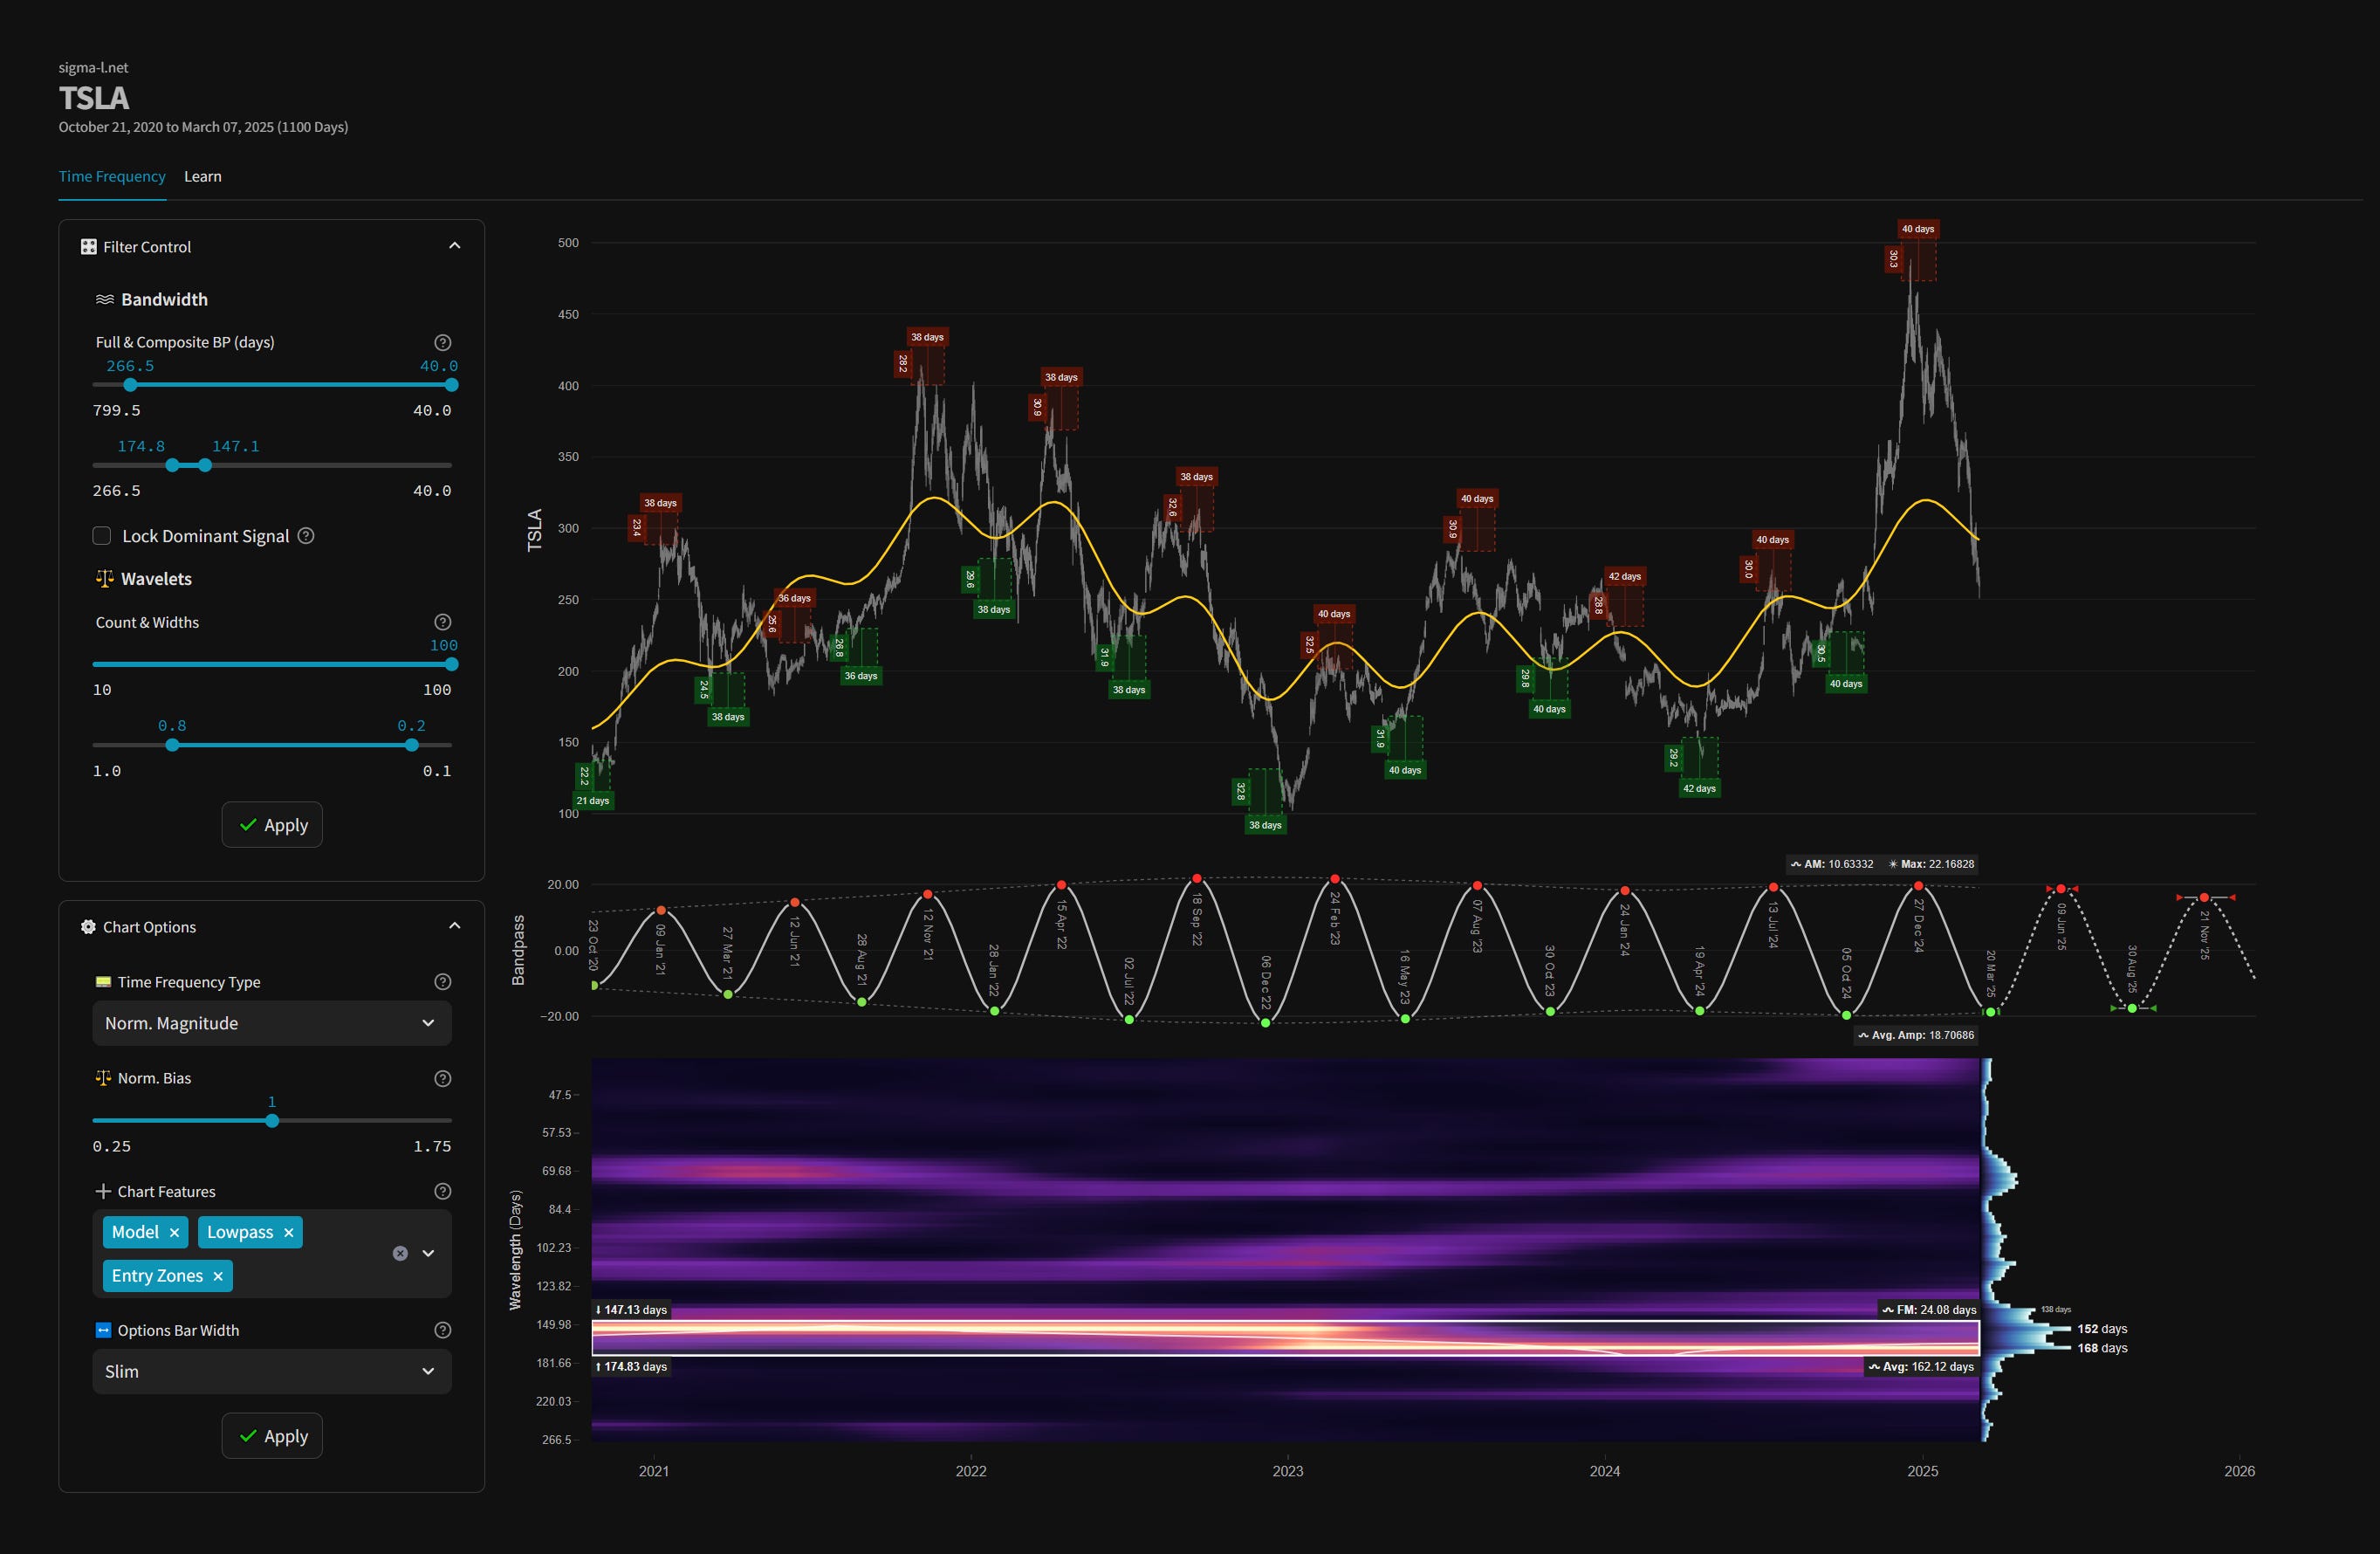
Time Frequency Analysis
Time frequency charts (learn more) below will typically show the cycle of interest against price, the bandpass output alone and the bandwidth of the component in the time frequency heatmap, framed in white.
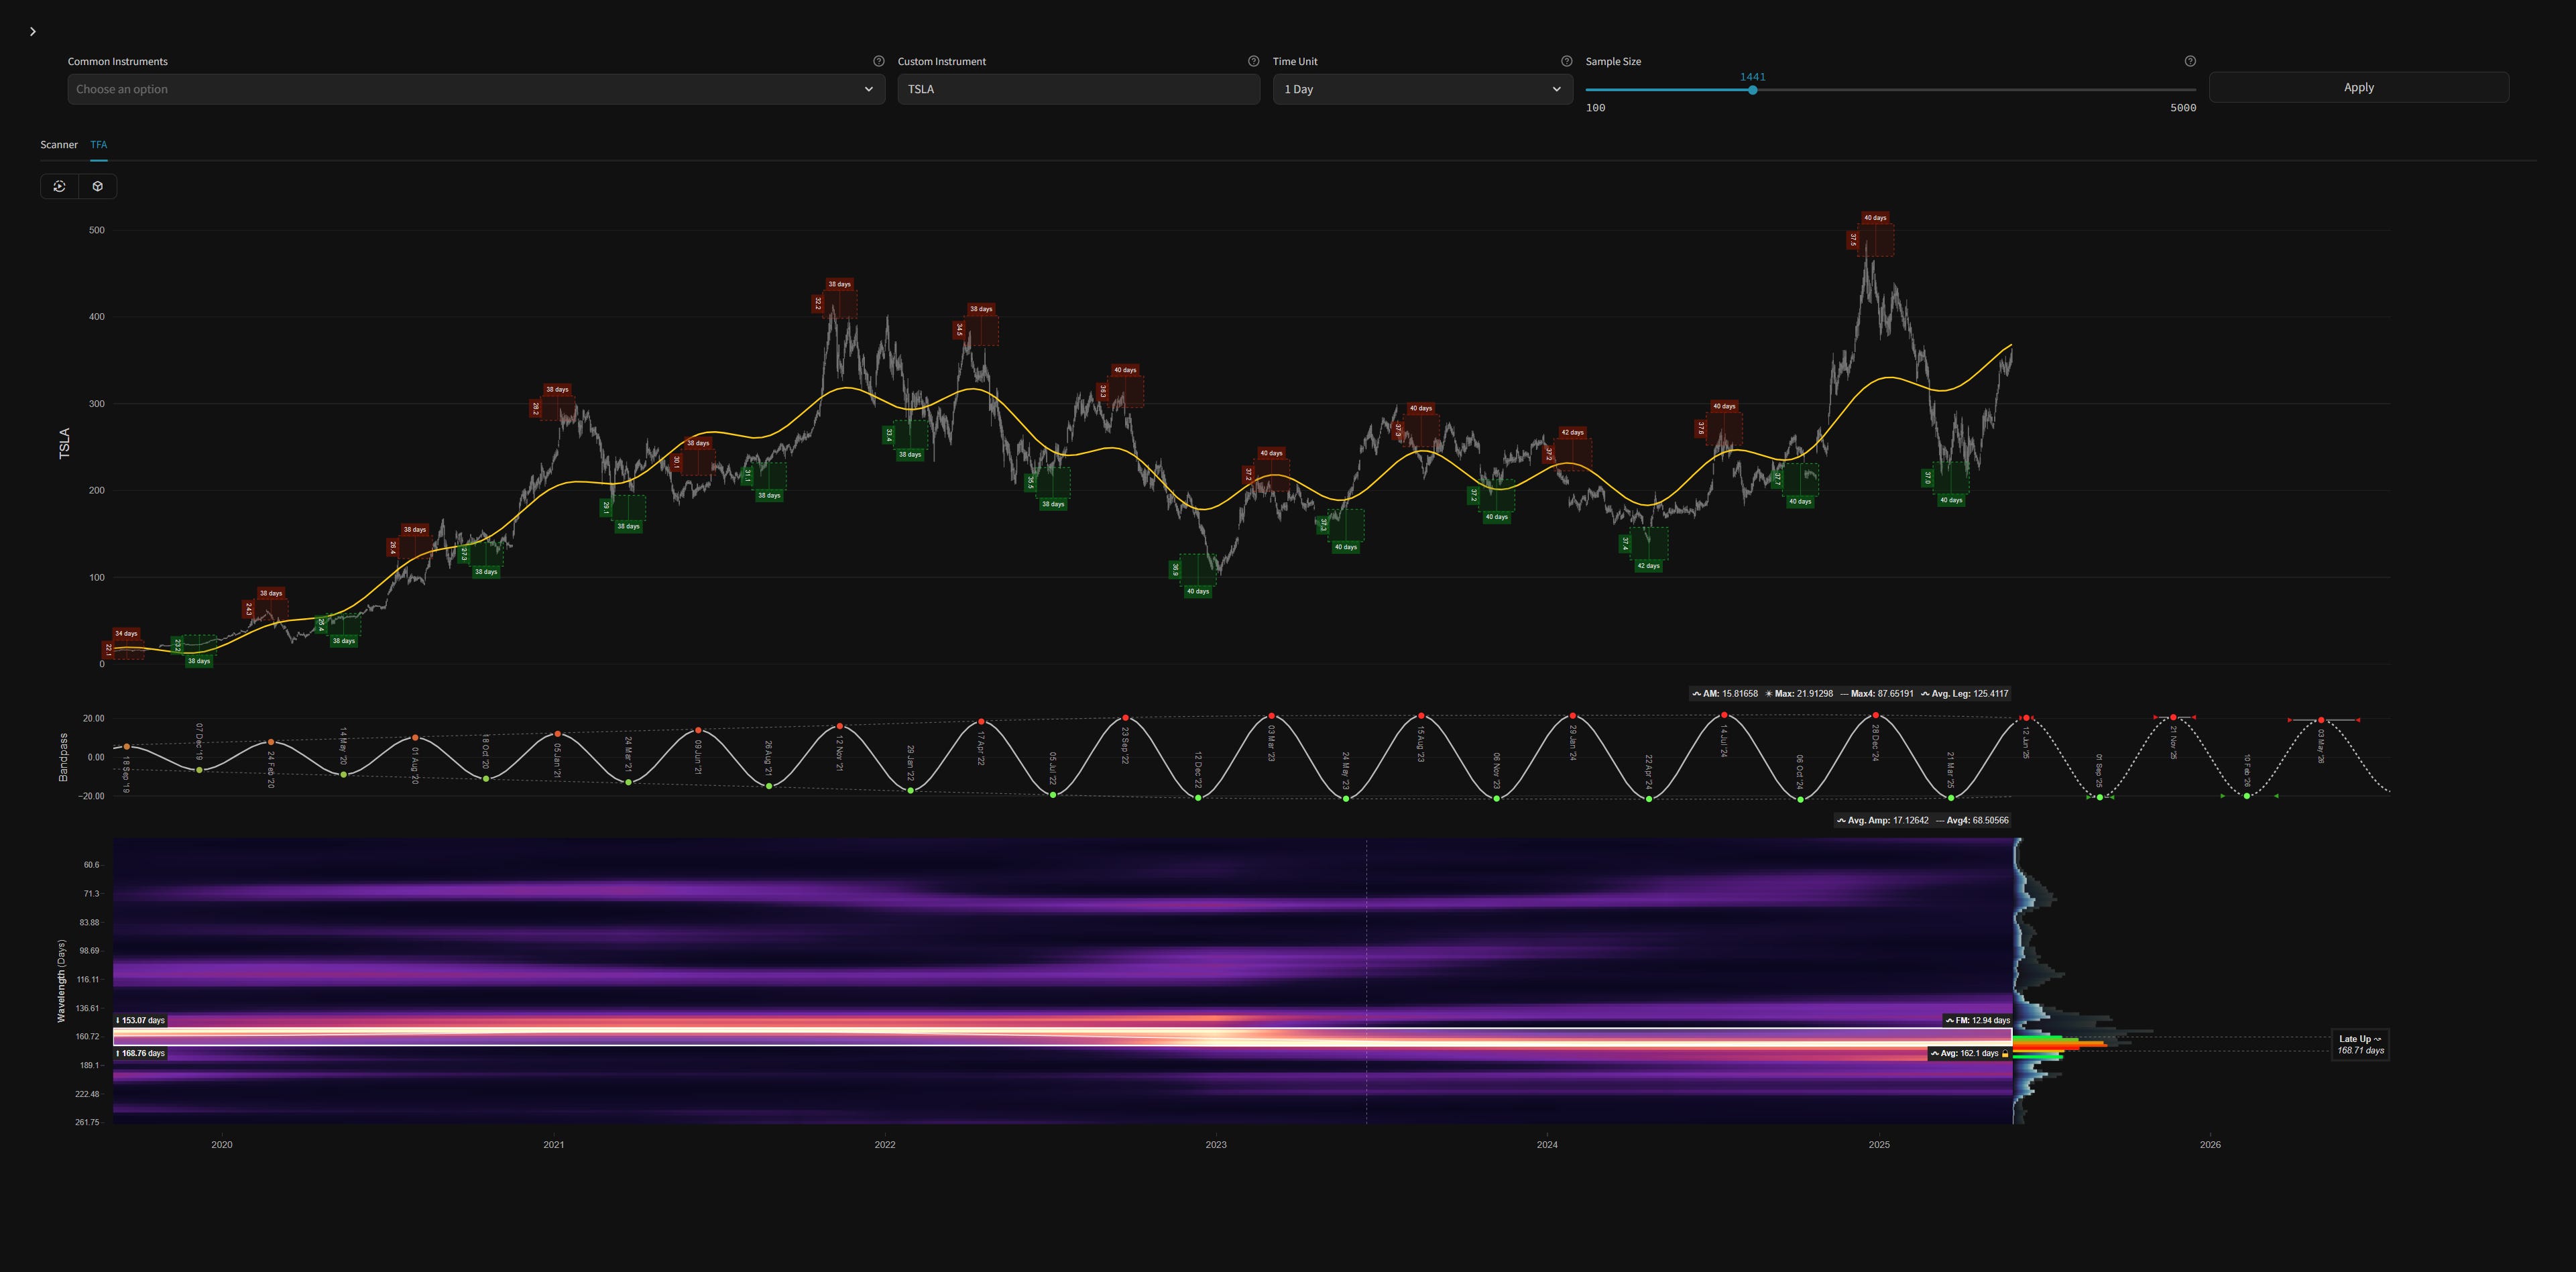
Before and After
Signal comparison between our last report and the current time, in chart format.

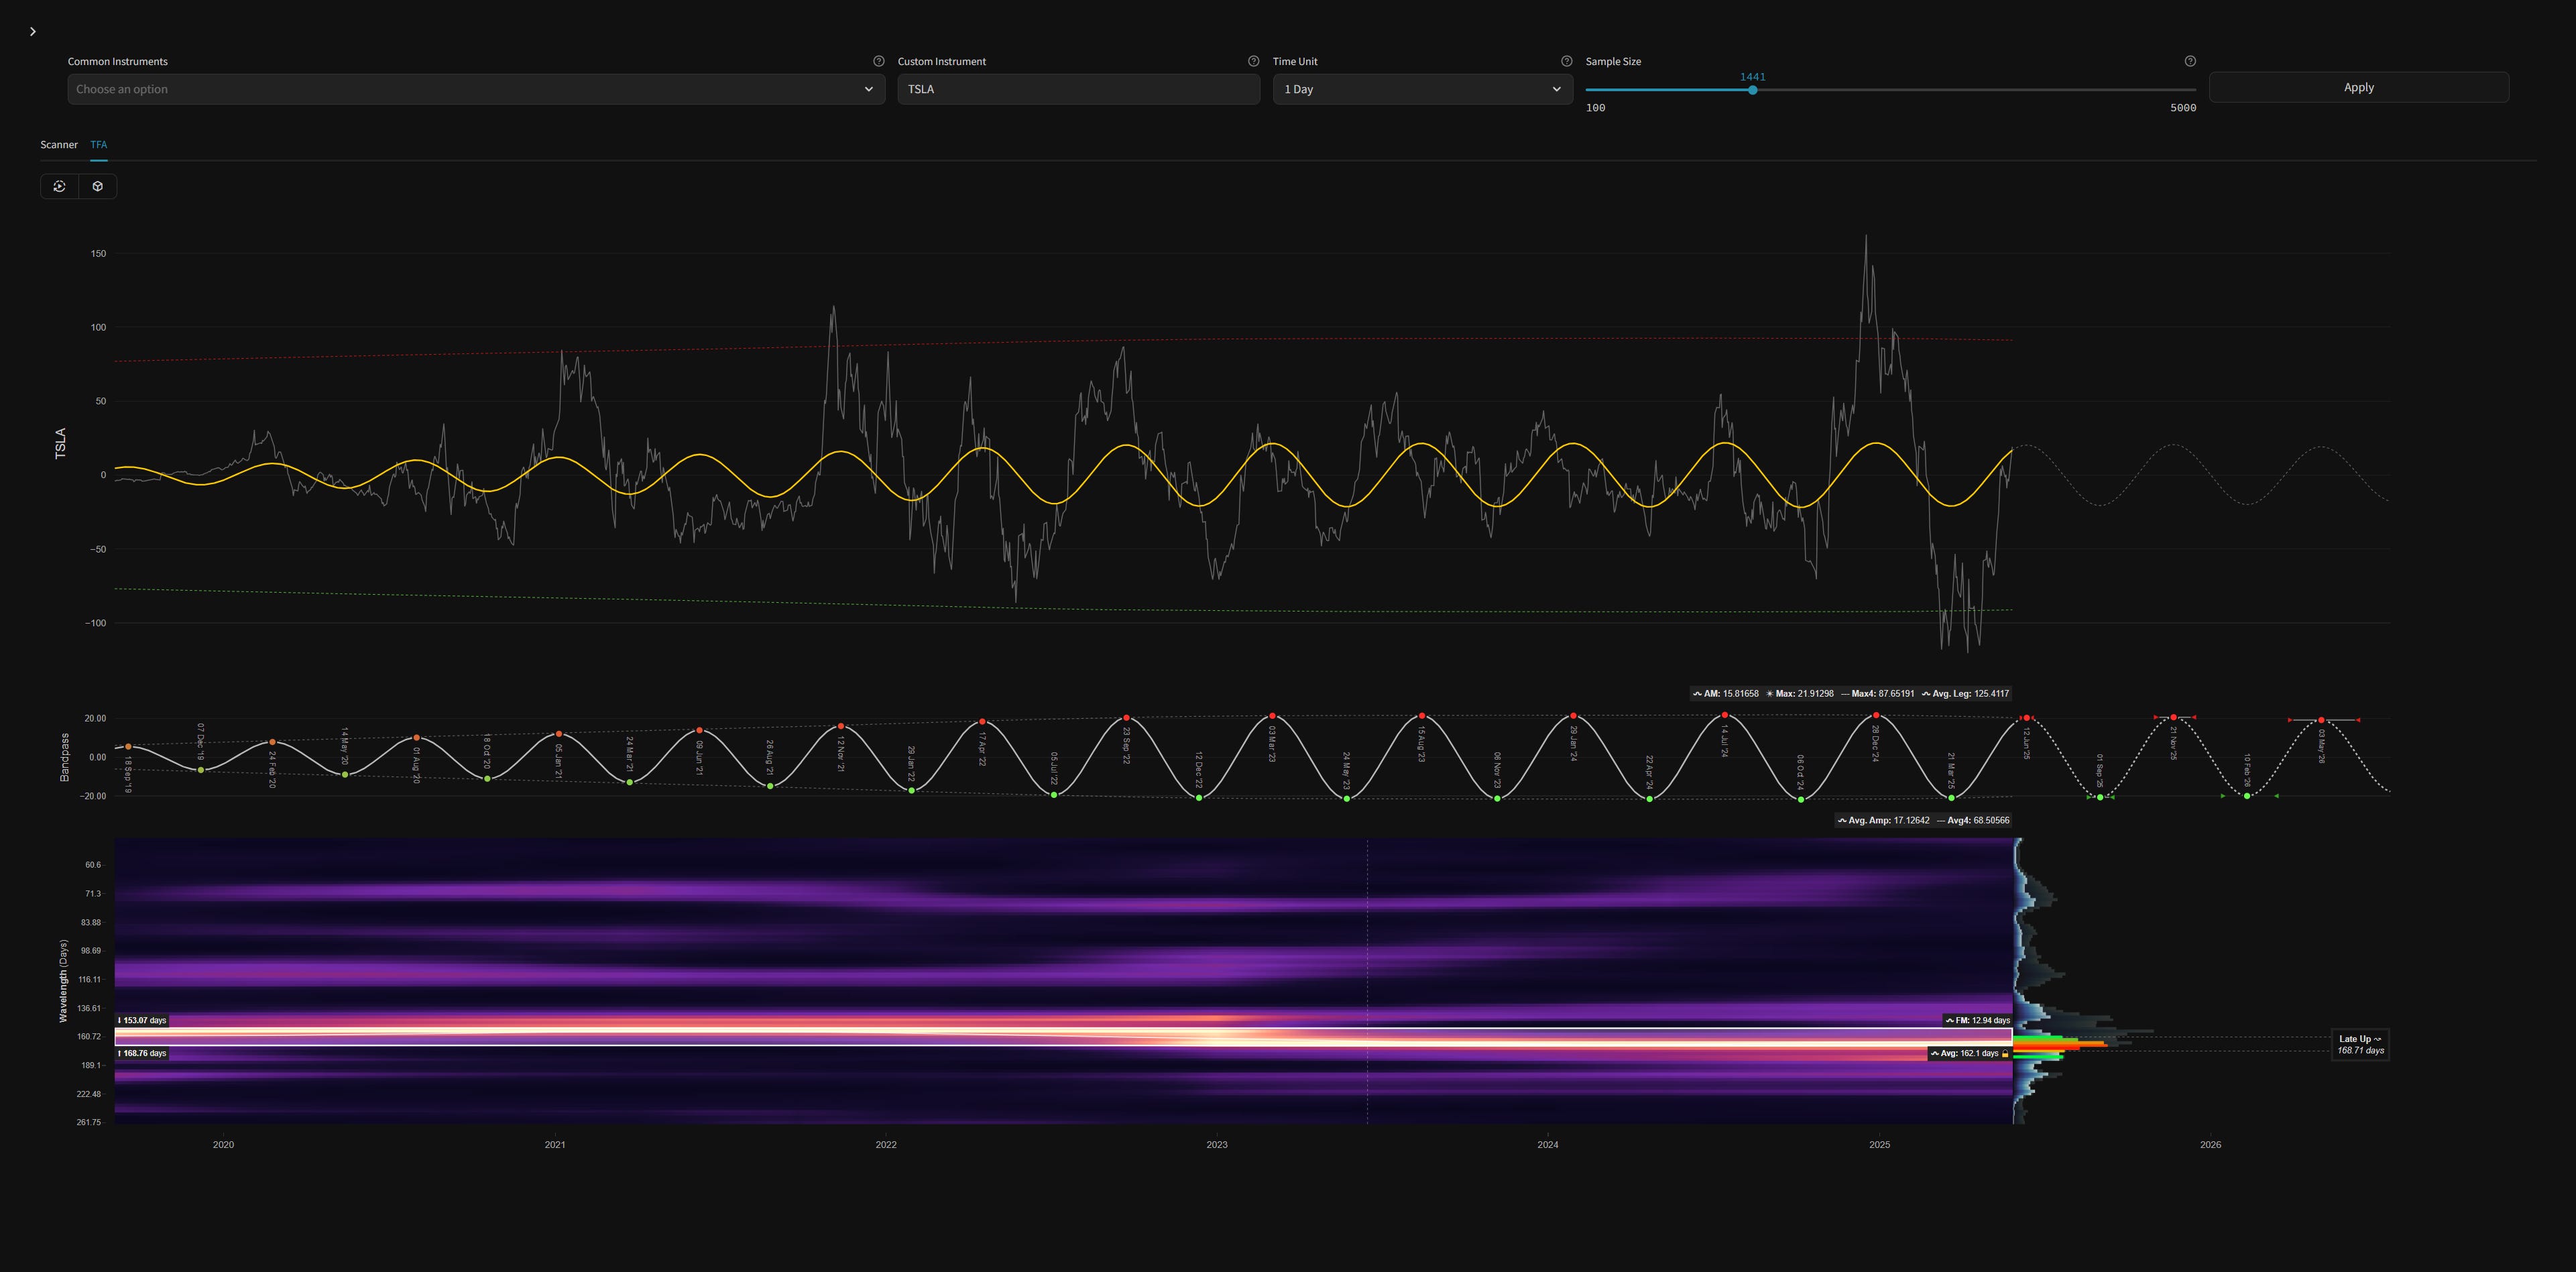
High-Pass Filtered Price
Our high-pass filter isolates the component of interest from underlying trend and presents buy and sell threshold envelopes (green and red). The envelopes are based upon the amplitude envelope of the bandpass filter +- 2 standard deviations. Breaches of either by high-passed price is a strong reversal action signal.
Current Signal Detail & Targets
Here we give more detail on the signal relative to speculative price, given the detected attributes of the component. In most cases the time target to hold a trade for is more important, given we focus on cycles in financial markets. Forthcoming trough and peak ranges are based upon the frequency modulation in the sample (learn more).
Detected Signal Class: B - learn more
Average Wavelength: 162.1 Days
Completed Iterations: 13
Component Yield Over Sample: 667.79% - learn morePhase: Peaking
FM: +- 13 Days
AM: 15.81658
Next Trough Range: 25th August - 8th September, 2025
Sigma-L Recommendation: Early Sell
Time Target: ~ 1st September, 2025
Current Signal Phase
This is ‘how far along’ the cycle is in it’s period at now time and is related to the predicted price action direction.
Current Signal Frequency Modulation (FM)
This is how much, on average, the signal detected varies in frequency (or wavelength) over the whole sample. A lower variance is better and implies better profitability for the component. Frequency usually modulates relatively slowly and over several iterations.
Current Signal Amplitude Modulation (AM)
This is how much the component gains or loses power (price influence) across the sample, on average. Amplitude modulation can happen quite quickly and certainly is more evident than frequency modulation in financial markets. The more stable the modulation the better.
Hi David - In your wavelength spectrogram, how do you balance the "sigma" element of the Gaussian function? How do you balance the trade-off between frequency precision vs time localisation?
Looking like you nailed it once again 😌 amazing