

TSLA (Tesla Inc) - 10th March 2025 | @ 162 Days
'B' class signal detected in Tesla Inc. Running at an average wavelength of 162 days over 11 iterations since May 2020. Currently troughing.


ΣL Cycle Summary
Here we have an excellent and recently high amplitude cycle in one of the world’s most famous companies, Tesla. Beautifully stationary in this sample since May 2020 over 11 iterations and due to trough imminently. Bulls will hope the volatility (amplitude) that helped drive the move up from the most recent trough in October 2024 is retained for this iteration too.
Time Frequency Analysis
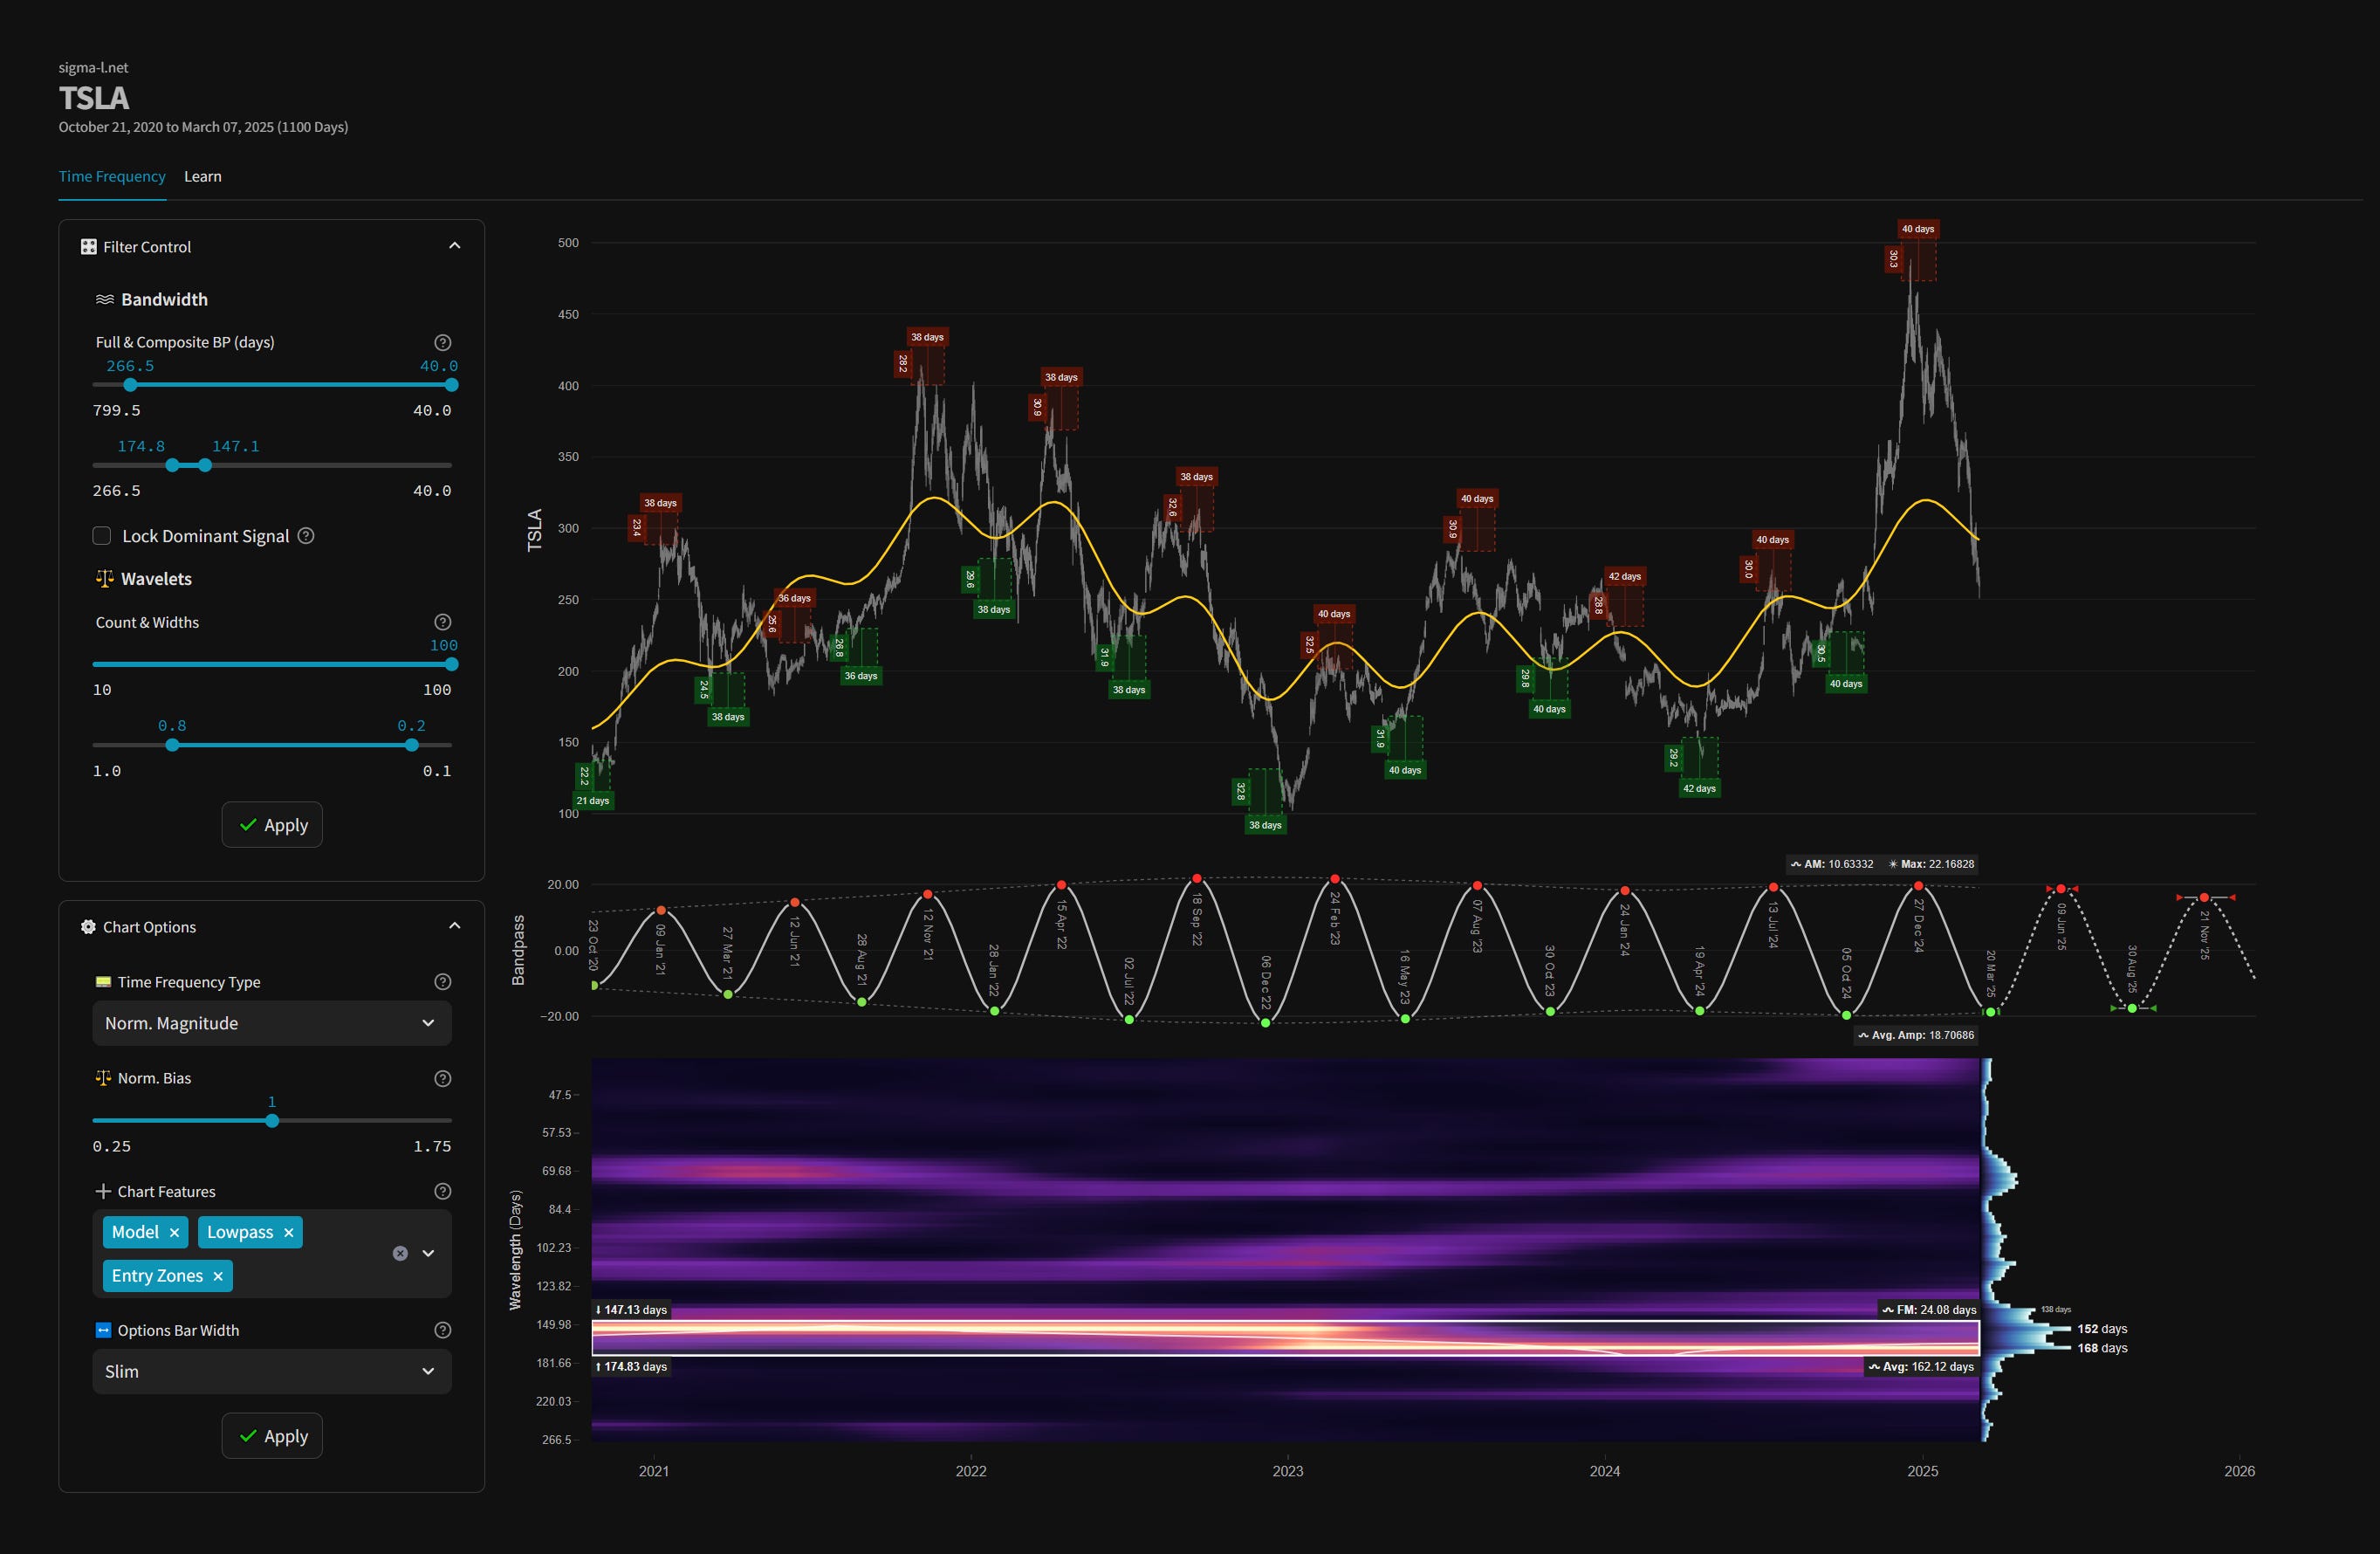
Time frequency charts (learn more) below will typically show the cycle of interest against price, the bandpass output alone and the bandwidth of the component in the time frequency heatmap, framed in white.
High-Pass Filtered Price
Our high-pass filter isolates the component of interest from underlying trend and presents buy and sell threshold envelopes (green and red). The envelopes are based upon the amplitude envelope of the bandpass filter +- 2 standard deviations. Breaches of either by high-passed price is a strong reversal action signal.
Current Signal Detail & Targets
Here we give more detail on the signal relative to speculative price, given the detected attributes of the component. In most cases the time target to hold a trade for is more important, given we focus on cycles in financial markets. Forthcoming trough and peak ranges are based upon the frequency modulation in the sample (learn more).
Detected Signal Class: B - learn more
Average Wavelength: 162.12 Days
Completed Iterations: 11
Component Yield Over Sample: 499.78% - learn morePhase: Troughing
FM: +- 24 Days
AM: 10.63332
Next Peak Range: 29th May - 21st June, 2024
Sigma-L Recommendation: Buy
Time Target: ~ 9th June, 2025
Current Signal Phase
This is ‘how far along’ the cycle is in it’s period at now time and is related to the predicted price action direction.
Current Signal Frequency Modulation (FM)
This is how much, on average, the signal detected varies in frequency (or wavelength) over the whole sample. A lower variance is better and implies better profitability for the component. Frequency usually modulates relatively slowly and over several iterations.
Current Signal Amplitude Modulation (AM)
This is how much the component gains or loses power (price influence) across the sample, on average. Amplitude modulation can happen quite quickly and certainly is more evident than frequency modulation in financial markets. The more stable the modulation the better.
David, I’m wondering if there’s a longer cycle that you are detecting in TSLA? Manually I’m having trouble detecting longer term cycles by hand