

The Moving Average - High Pass Filter
Learn how a correctly plotted moving average can be inverted to reveal high frequency components of a signal.


Inversion Excursion
We saw in previous articles of this series how only a correctly plotted moving average can be used as a low pass filter for time series extraction of periodic components. Now, let’s take it to the next level by inverting that moving average - throwing away the low passed data and retaining only components shorter in period than the cutoff of the moving average (period). Since in our work we have both the low pass filtered time series (via the application of the centred moving average) and the original signal time series (be that a test signal as above or financial time series) we can perform the operation easily.
Below is how it is done, via the help of some pseudo code. Note carefully that the subtraction performed to reveal the higher frequency components not present in the low pass filter can only be done if the original signal and low pass filtered signal are correctly aligned. The low passed signal must be shifted, as demonstrated in the previous article, by the (moving average period - 1)/2. This is essential and dictates that the moving average period chosen must really be an odd number!
// Our original signal
signal = [4,5,6,7,8,9,8,7,8]

// MA period (lp filter cutoff)
ma_period = 3

// Filtered signal (apply moving average)
lp_signal = [NaN,NaN,5,6,7,8,8.3,8,7.6]

// Filter lag correction by: (ma_period-1)/2 = 1 in this case
lp_shift = [NaN,5,6,7,8,8.3,8,7.6,NaN]

// Subtract the filtered signal from the original signal
hp_signal = signal - lp_shift
High Pass Output, Visualised
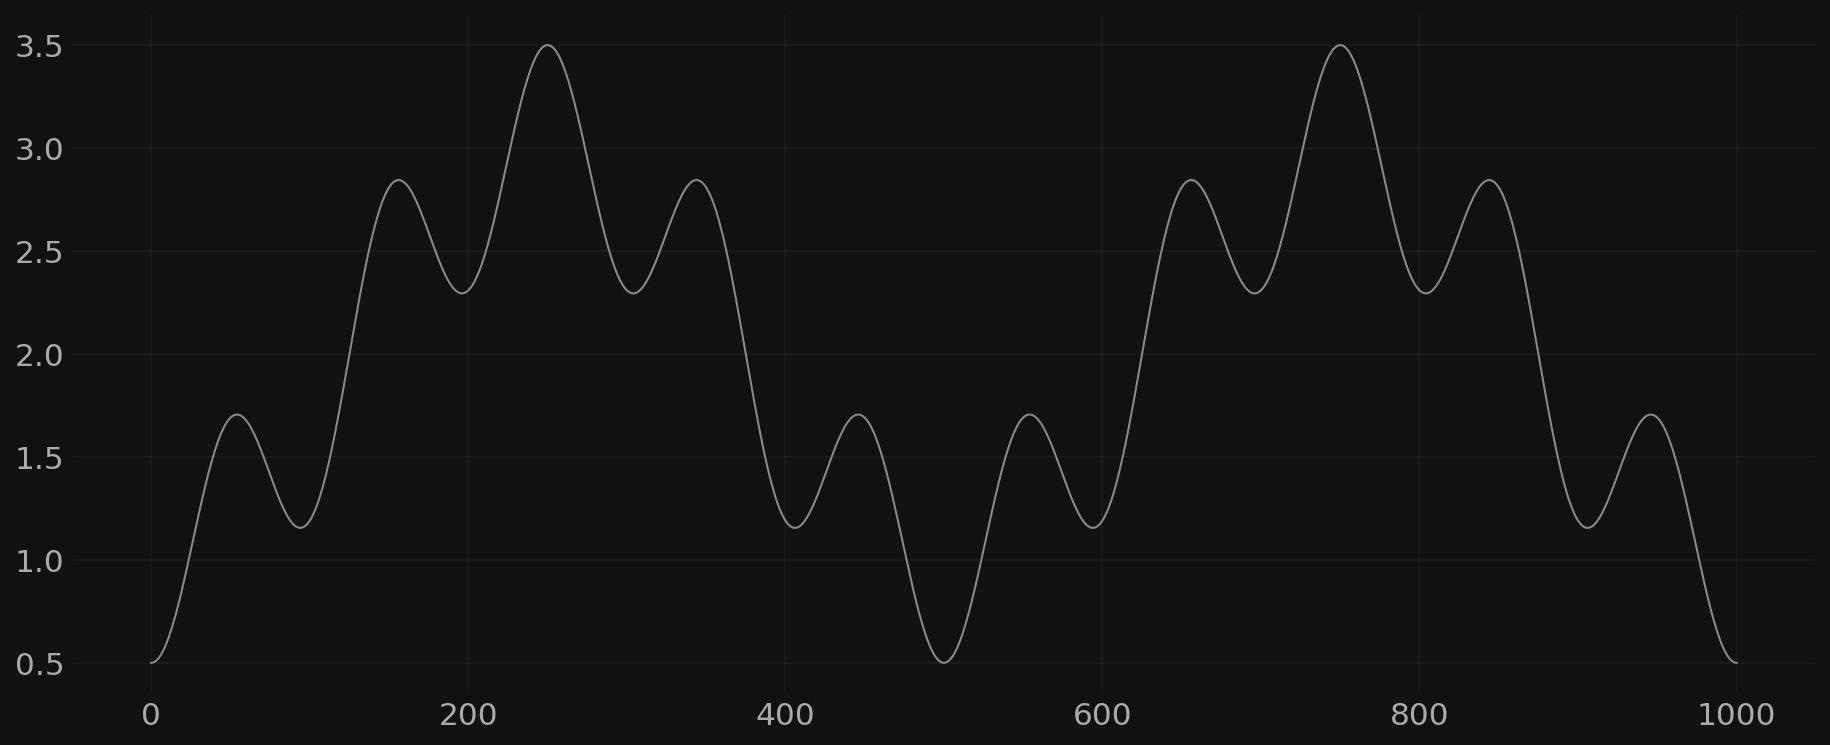
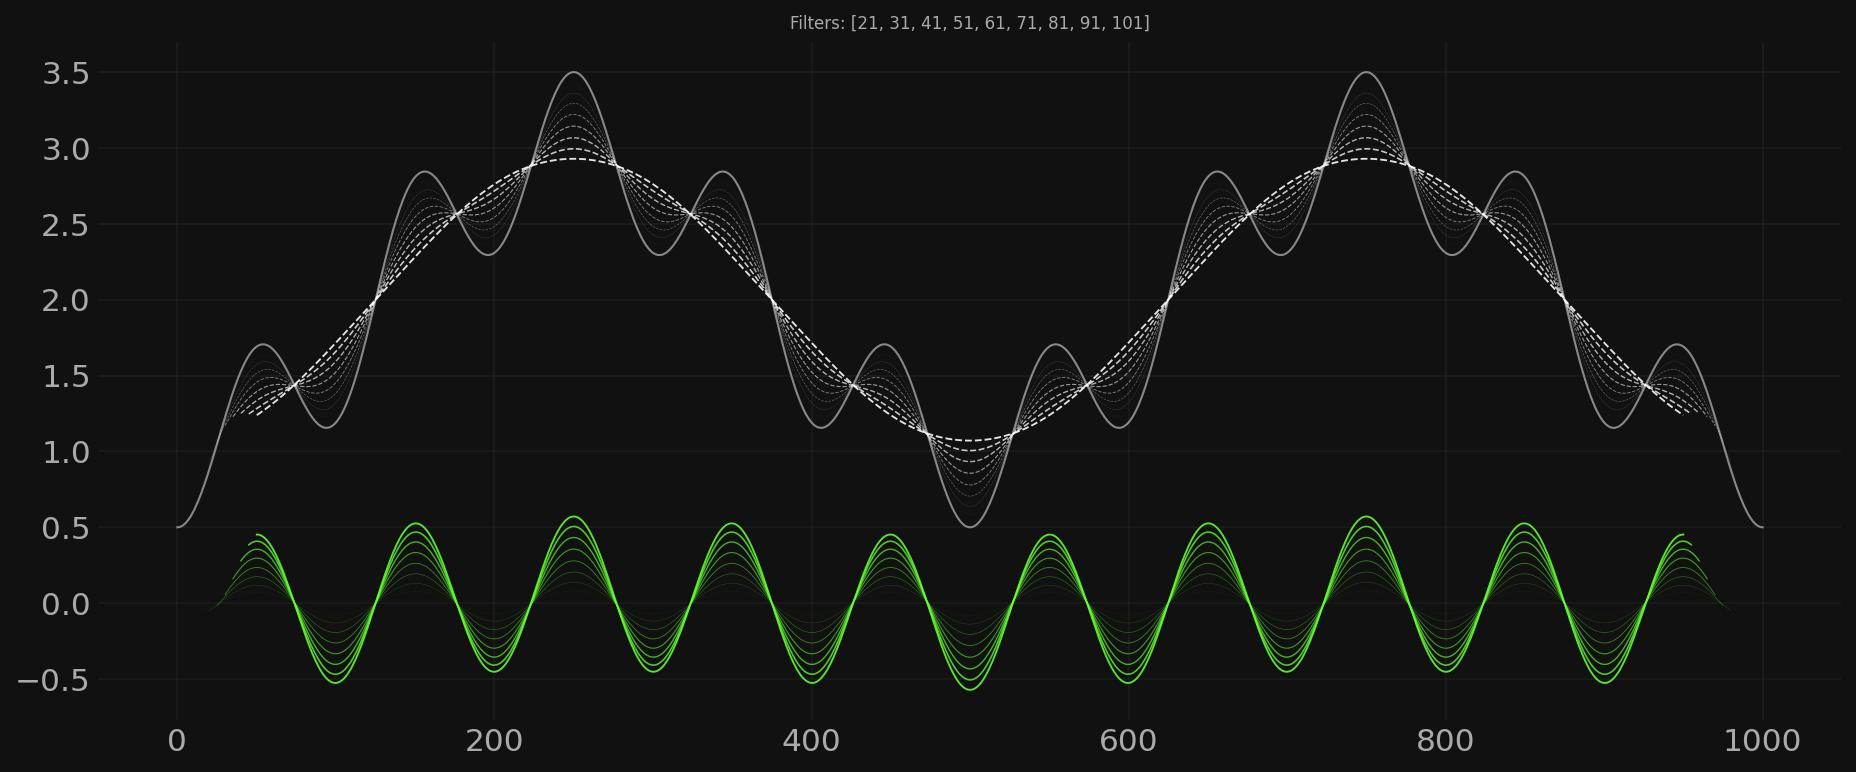
Now, let’s build a very simple signal with only two sinusoidal components to demonstrate a clean extraction of the higher frequency component. Below, a 1000 point time series containing components at wavelengths of 500 and 100 respectively. The higher frequency component has an amplitude of 0.5, this will be an important number to remember as we progress. The whole plot is vertically offset for visual clarity.
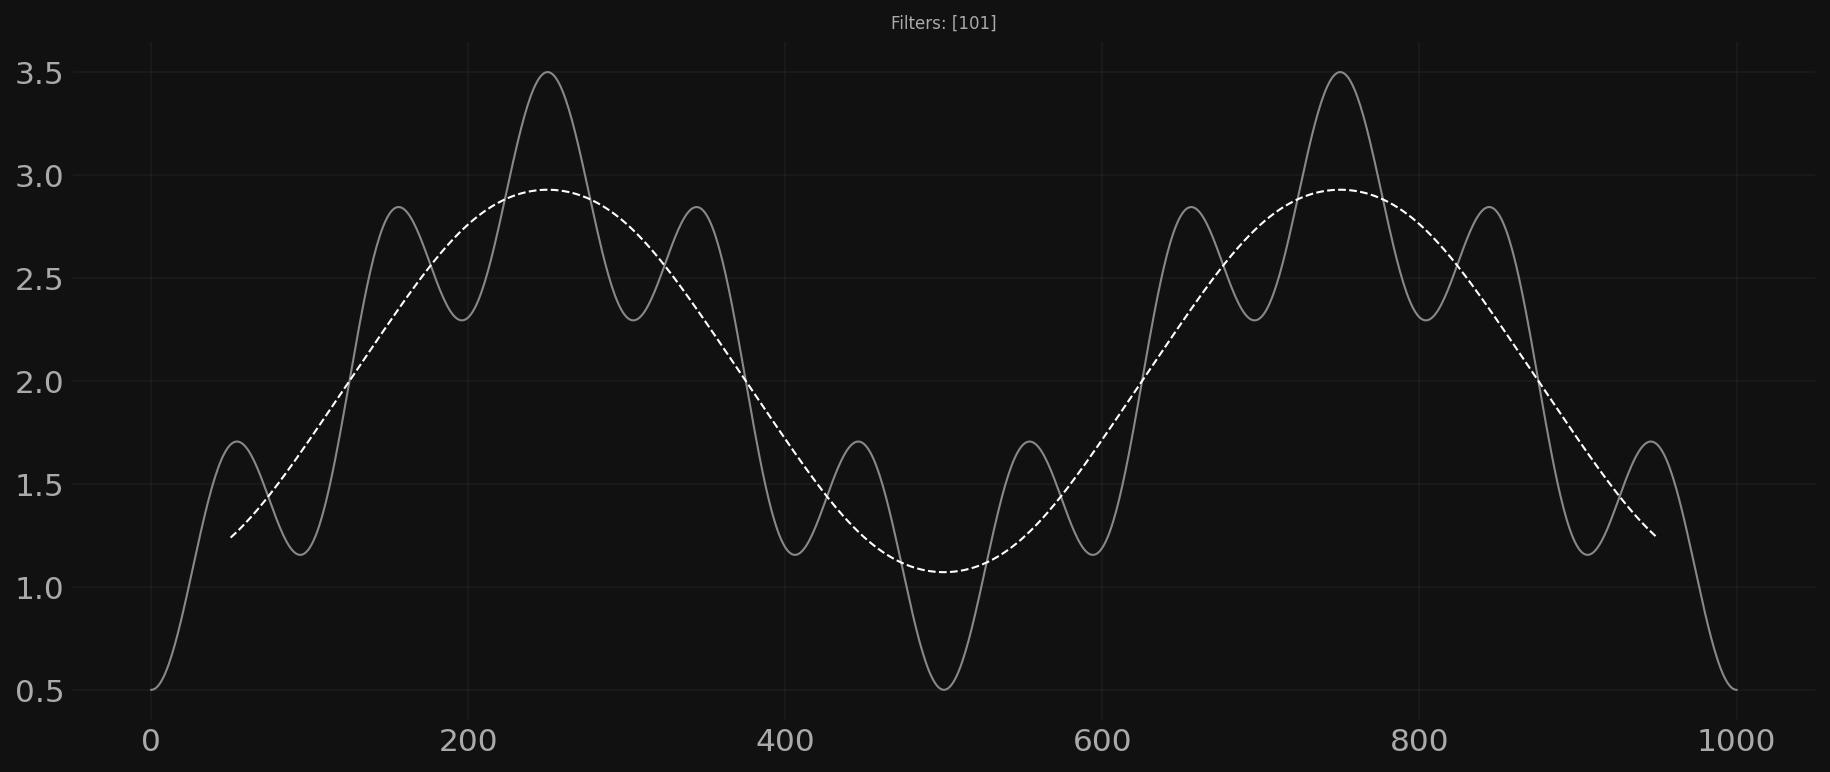
We now apply a moving average of period 101 (must be odd!) to effectively remove the component of period 100 wavelength. This is shown below via the white dashed line, a clean sinusoid of period 500, the only component left in the low passed signal. The plot is correctly centred with lags of 50 points each side using the equation (ma_period-1)/2.
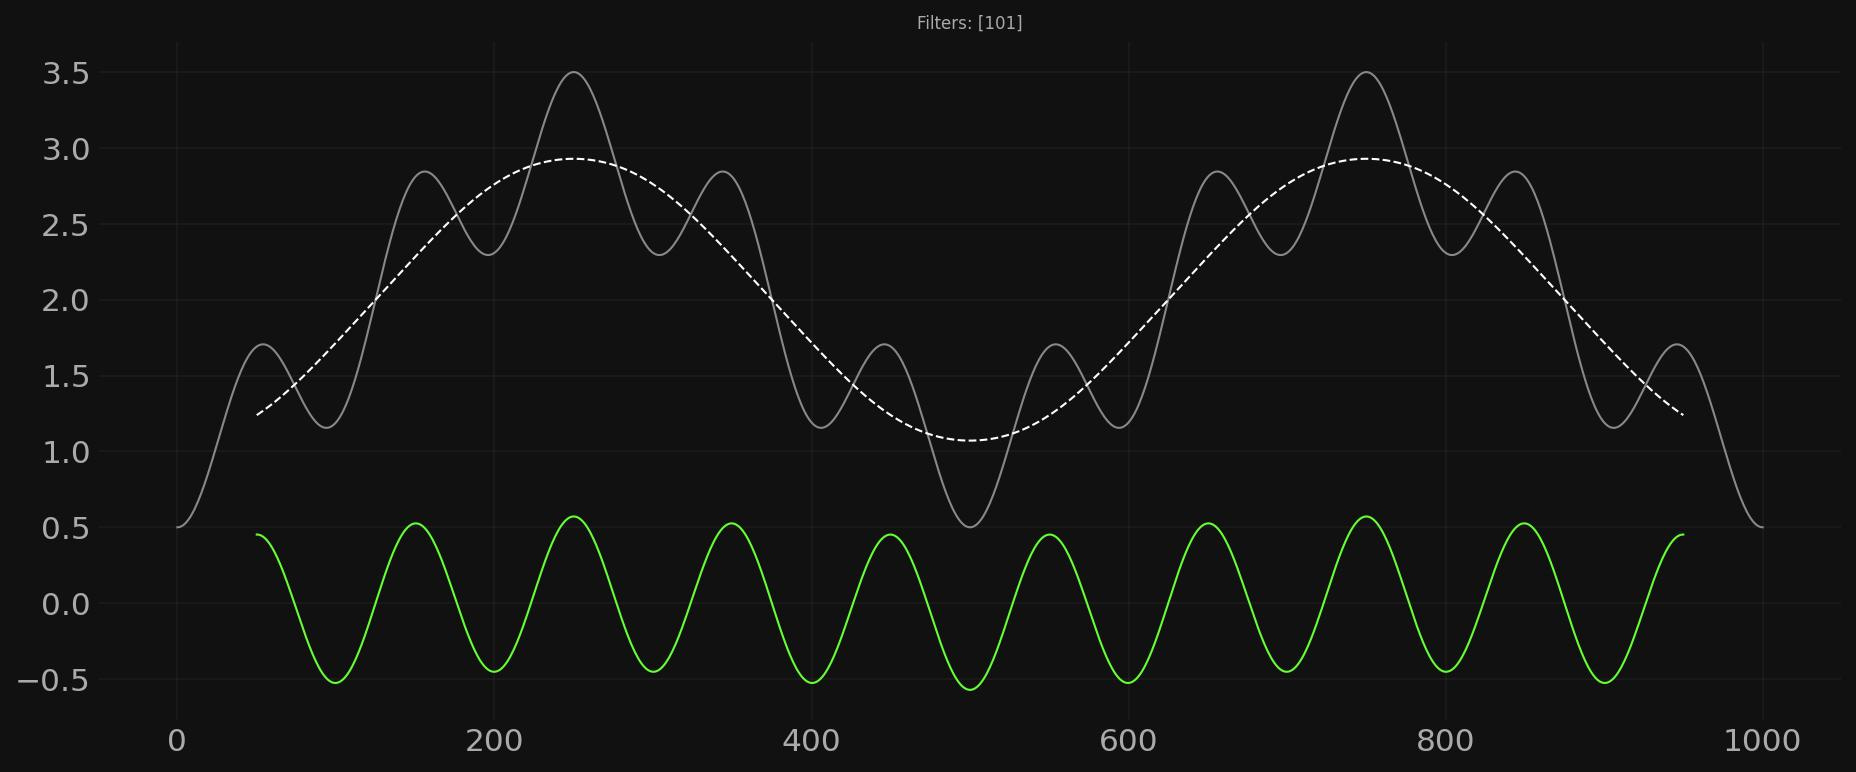
We now have the ingredients to perform our high pass filter extraction. We subtract the lagged low pass filter from the corresponding points in time of the original signal to reveal only what is left, namely components of wavelength equal to and less than 100. This is shown in green at the foot of the chart and approaches the correct amplitude of 0.5.
With the unavoidable digital filter lag we are still left with gaps at nowtime (and the tail) that are problematic for any trading purposes when we switch to real signals. We can solve this to some extent by using the previously discussed technique of signal reflection:
Drawbacks of a Moving Average LPF
Although the moving average is a useful tool and available to many traders across common platforms there is a subtle drawback readers should be aware of. The frequency response of a moving average is tainted by it’s sidelobes. This means, in practice, that extraction of periodic components is minimally spectrally leaky compared to more sophisticated filtering techniques. It is not that bad for our purposes and certainly the ubiquity and ease of use of the moving average outweighs this disadvantage. It is something to be aware of, regardless. Hurst outlined the frequency response of the moving average as a low pass filter in the appendix of ‘Profit Magic for Stock Transaction Timing’, shown below:
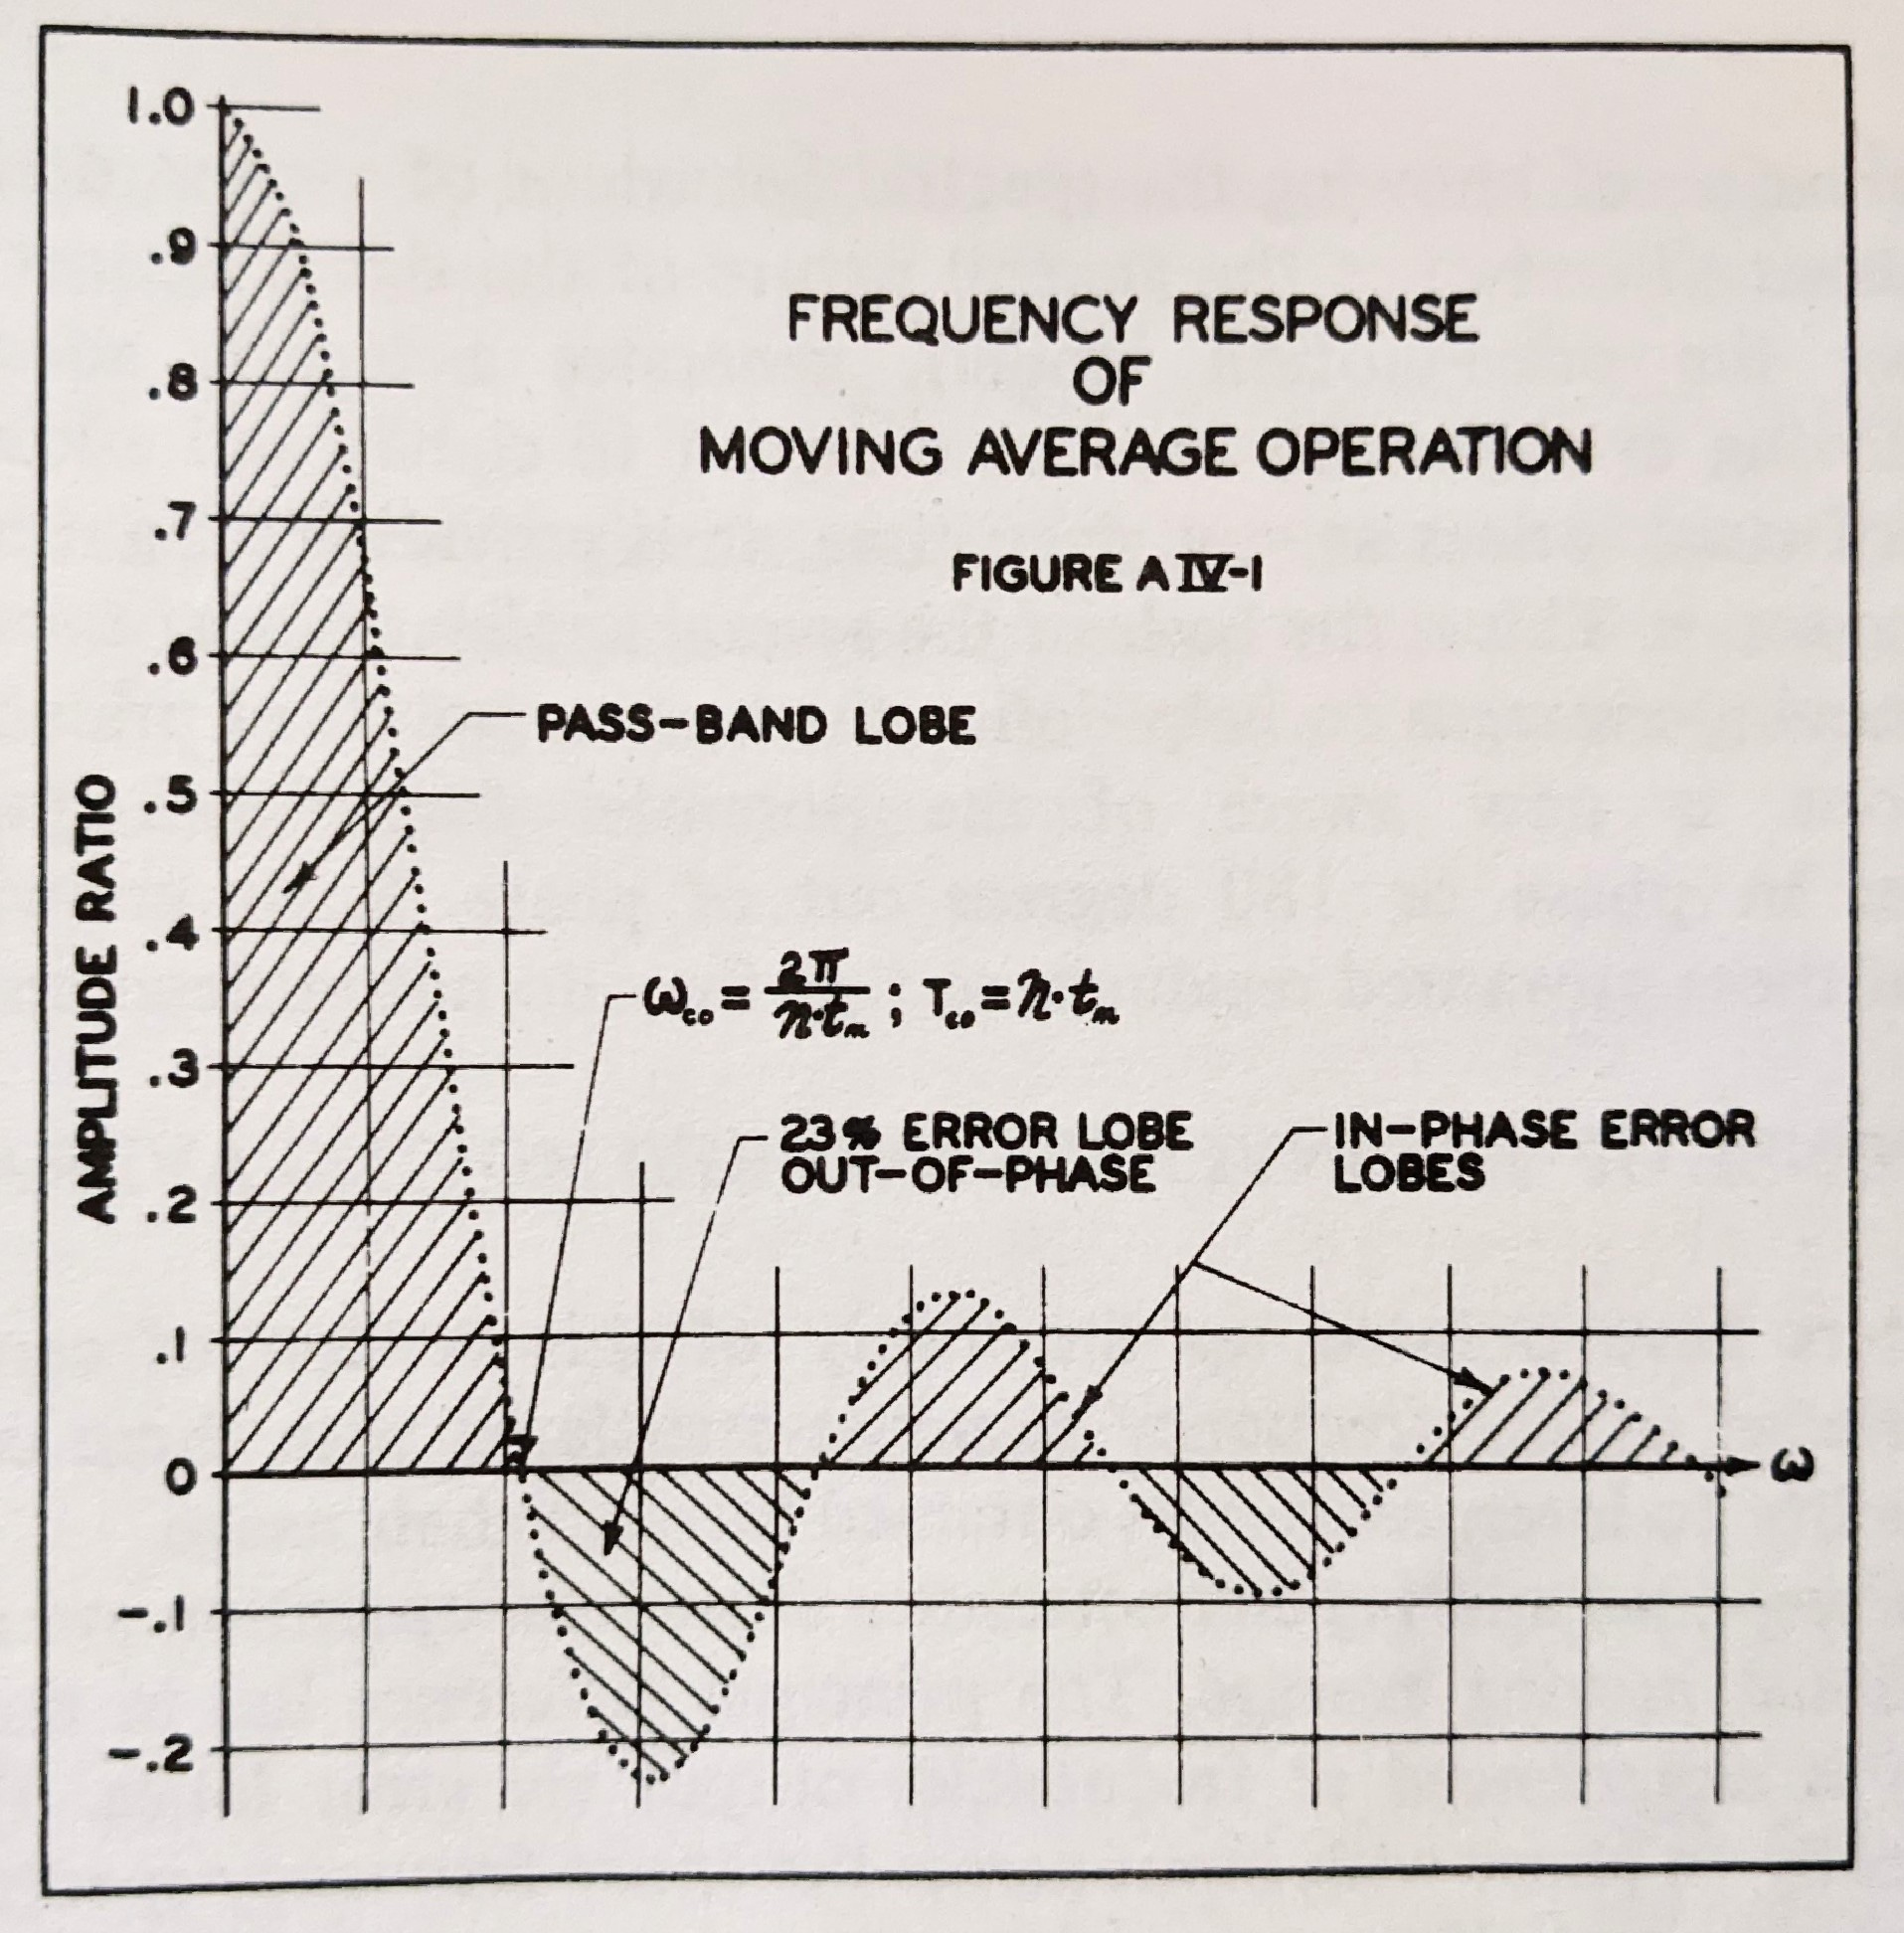
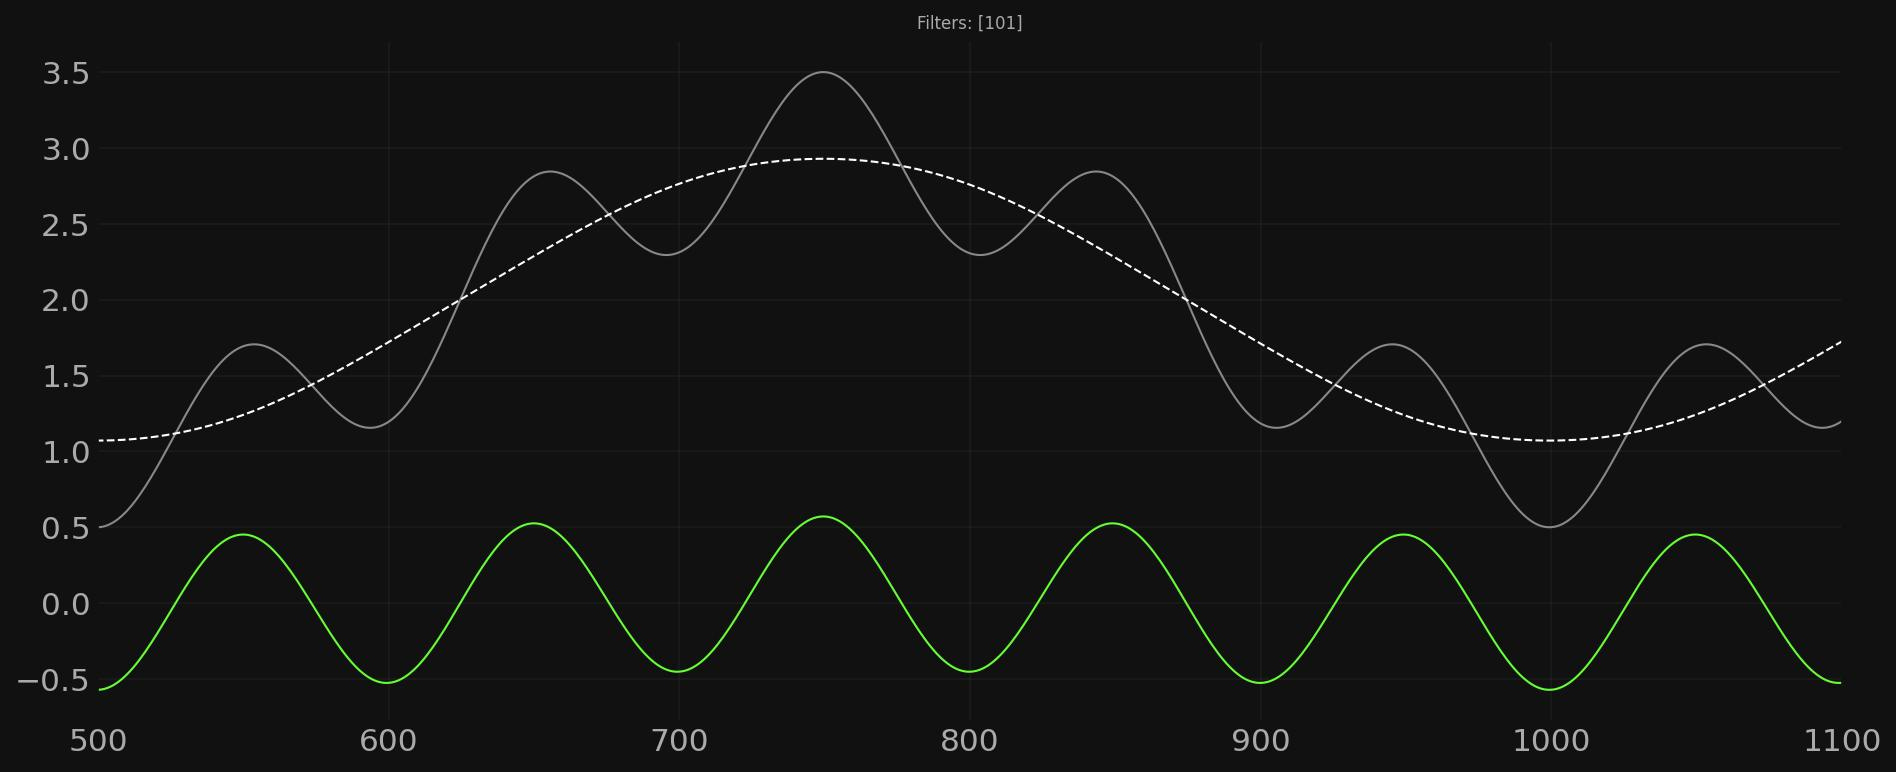
Below, the effect of the leaky spectral profile of the moving average is seen by the slight oscillation of the high pass filter output when the exact frequency is approached by the low pass filter operation on the original signal. In order to correctly return the accurate amplitude of the component (in this case 0.5) one has to accept a slight leaking through of lower frequency components. In the below case the component with a wavelength of 500 is very slightly affecting the high pass output (in green). Note how the oscillation is more pronounced as the filter cutoff approaches the wavelength of the target component at 101.
More Extractions!
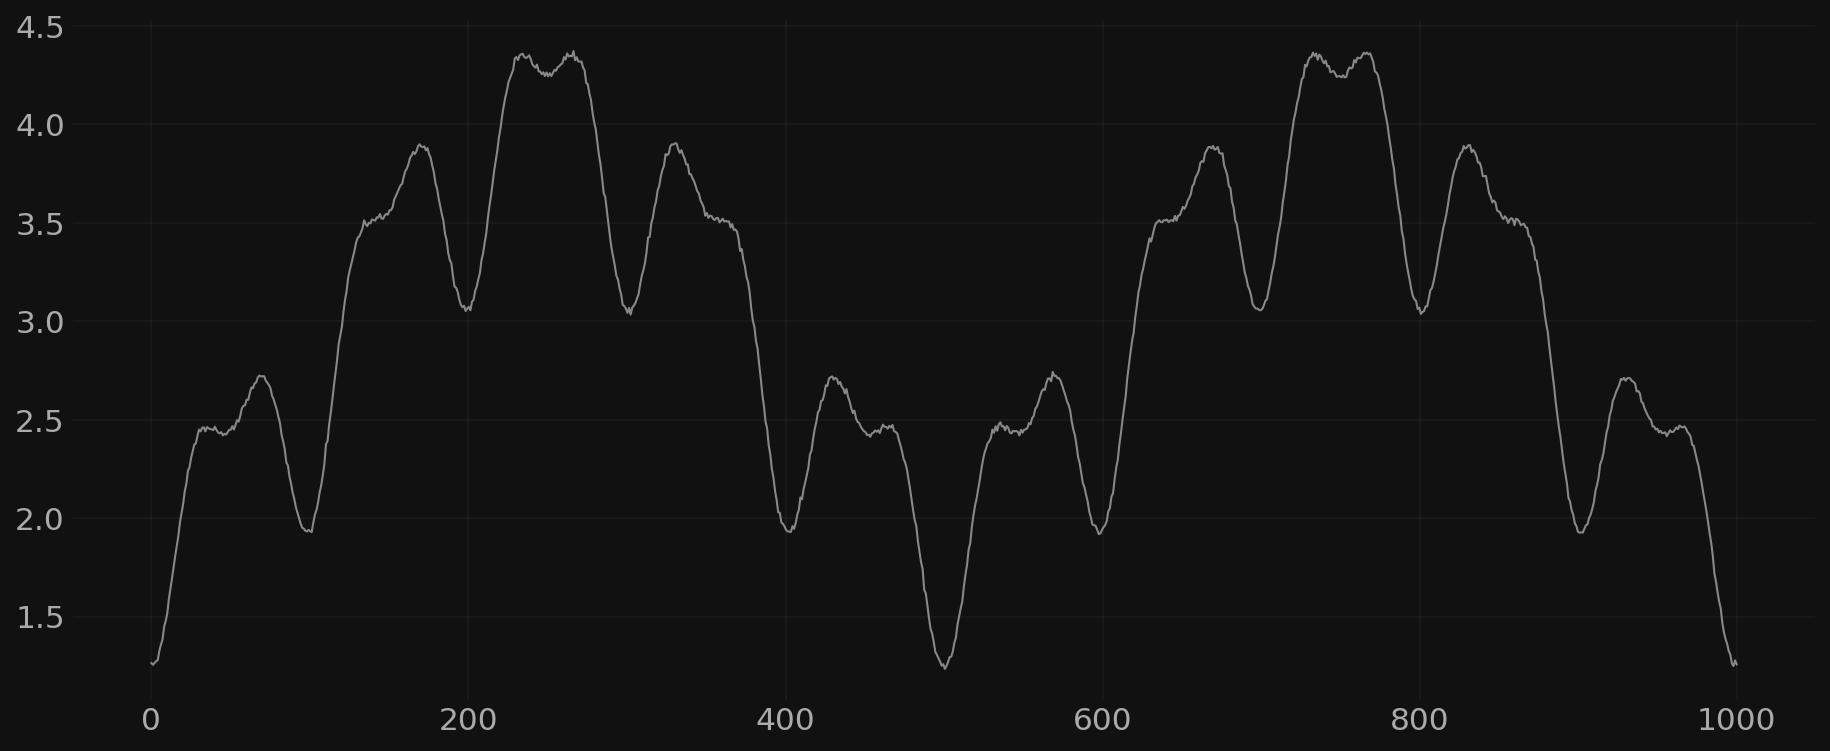
Let’s now add a third sinusoid to our signal, of even higher frequency, amplitude 0.25 and some small amount of white noise to taste:
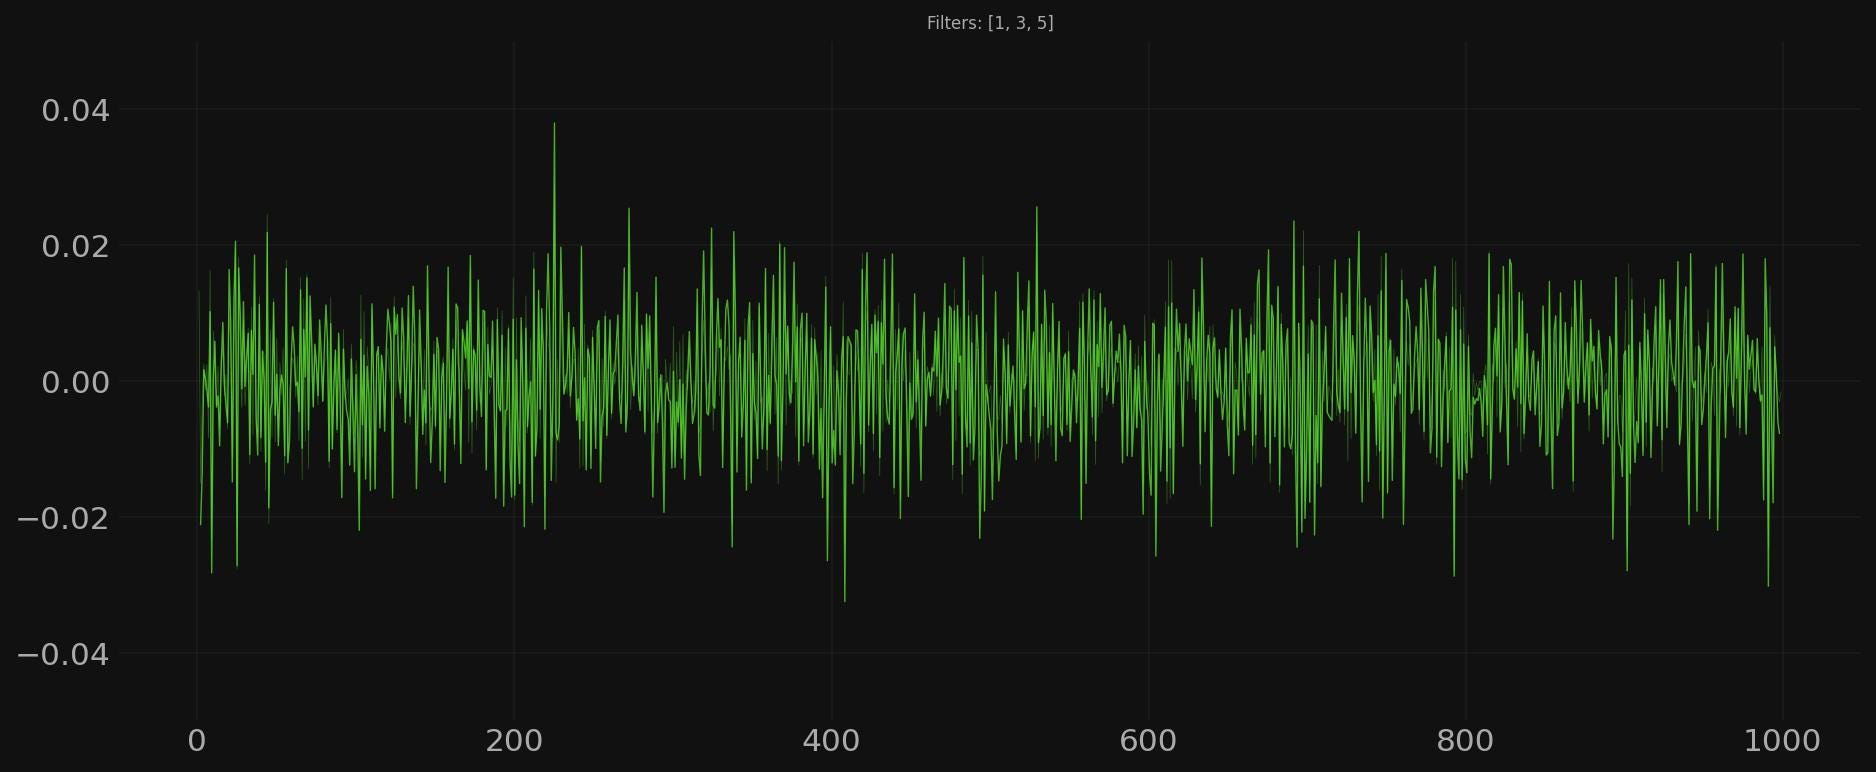
Now we will attempt to extract the very highest frequency component at a wavelength of 50 via our high pass filter technique. But first let’s see if we can isolate just the noise, for demonstration:
For the high frequency component we sweep across a range of filter cutoffs from 11 to 51, odd numbers only. The result is interesting:
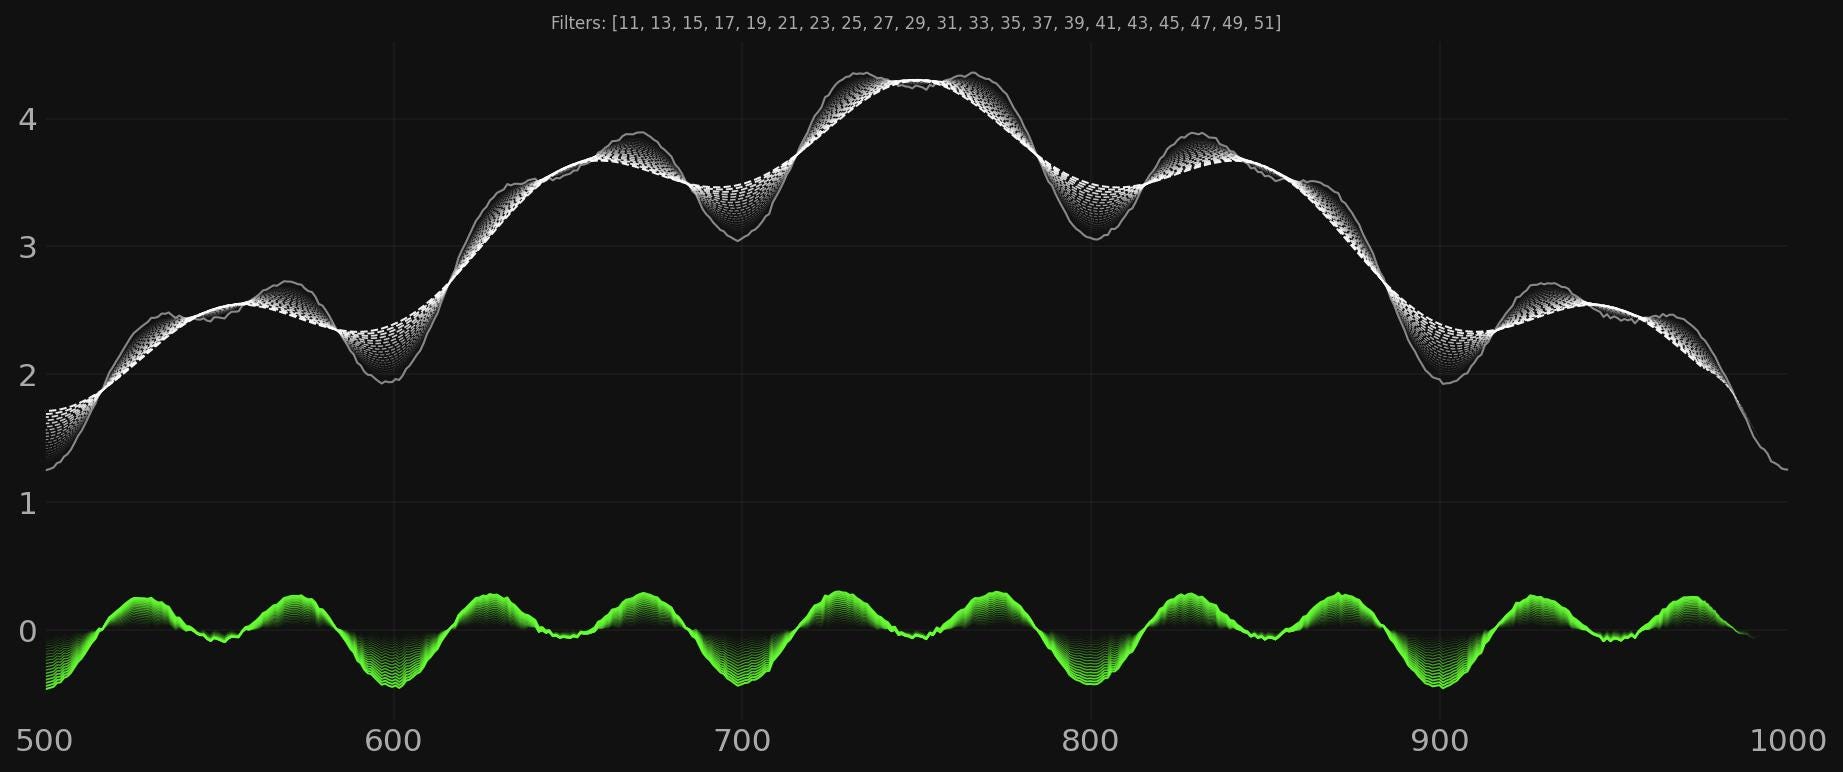
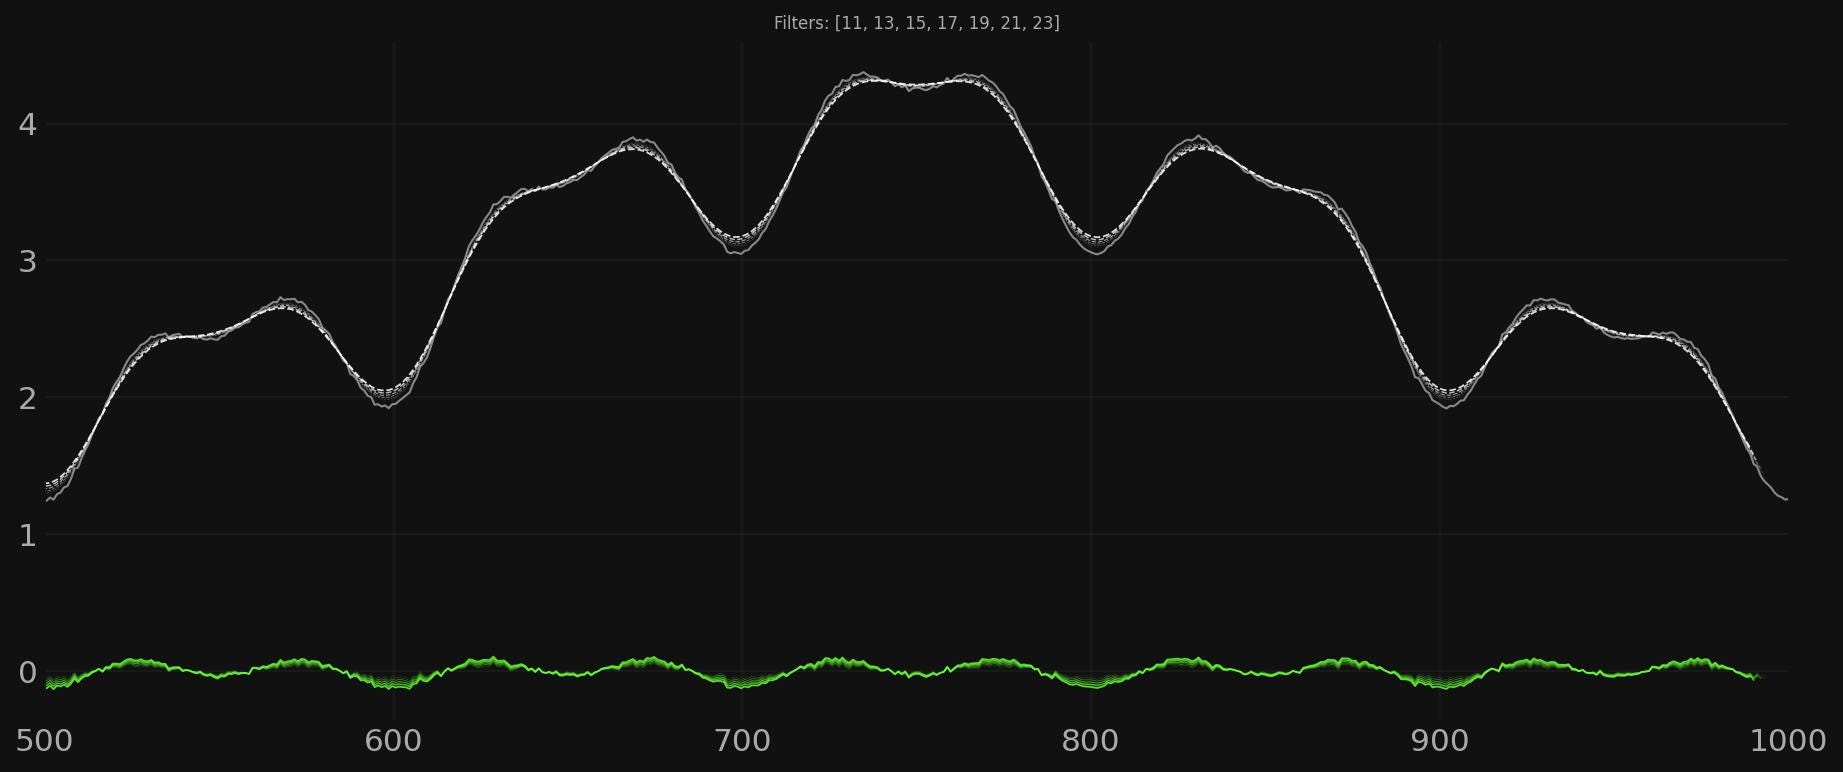
What we see here is as we approach the low pass filter cutoff of 51, which would remove the component of that wavelength in the low pass filter (and therefore return it in the high pass) is once again, spectral leakage. The component of 100 wavelength is corrupting the signal. However this is marginally only the case if we wish to return the original amplitude of 0.25. It turns out that the leakage from larger components will begin to affect the high pass signal after around halfway to the wavelength of the component we are trying to target. If we are only really interested in the frequency of a component we can compromise in this high pass filter approach by only filtering up to around half of the target component wavelength. This is shown below:
Next, Bandpass
The final installment of this moving average series will take the next natural step and detail construction of a bandpass filter. This is possible by computing two low pass filters at different cutoffs (periods), the frequencies between those two filters acting as the ‘band’ to ‘pass’. A bandpass filter is possibly the most powerful of the techniques and allows us to construct ‘comb filters’ that can sweep through signals, isolating specific bands for further examination. It requires careful thought about the cutoff frequencies to employ and how to correctly align signals when we account for filter lag. It is also an easy way to remove noise from a noisy high pass signal, as is the case above.
After that we will take these techniques and apply them to real markets. That is where the fun really begins!