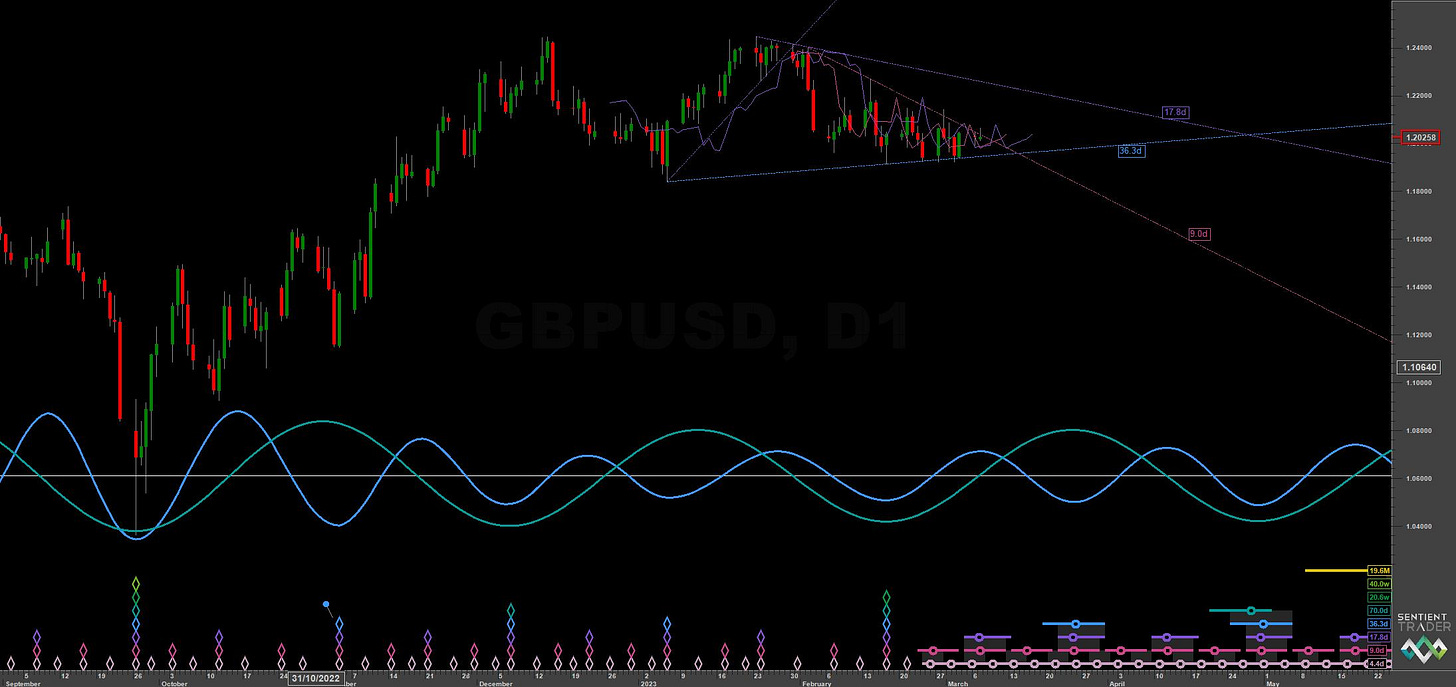
GBPUSD - Market Cycles - 7th March 2023
After an excellent bullish move from a low of at least 40 week magnitude in September 2022, GBPUSD starts to form a 20 week nominal trough. We look into the next moves in this report
Essentials: Nominal Model | FLD | FLD Trading Strategy | FLD Trading Strategy (Advanced) | Principle of Nominality | Underlying Trend | Time Frequency Analysis
Analysis Summary
Sterling has consolidated since the surge from the low in September 2022. This was from a trough of at least 40 week magnitude and quite possibly 18 month magnitude. The 20 week component, which has been visually evident over the last 2 years (shown below on the medium term time frequency analysis) is due to trough very soon. The component is also present in commonality pairs - this can be useful if readers wish to take a position in a USD paired currency of their choosing, aside from GBPUSD.
Below composites of GBPUSD, EURUSD, AUDUSD and CADUSD increase the signal to noise ratio for enhanced isolation of the 20 week and 80 day ‘nominal’ components of interest:

In terms of time, the cycle peak of the 80 day component is due mid April with the 20 week component cycle peak coming in late May / early June. As with all projections here that are based upon a time frequency analysis, margin of error is based upon frequency modulation over the period sampled (analogous to the ‘nest of lows’ seen in Hurst’s simplified ‘diamond notation’). These two components have been relatively stable, demonstrating minimal variation over a long period.
After the 20 week component peak price could possibly track the 18 month FLD down, prior to breaking up through it from the 40 week nominal low, due in July this year.
A significant breach of the 18 month FLD within this next 20 week wave will add evidence to the phasing that places the most recent 18 month low in September 2022.
Phasing Analysis
Long Term
Components including and longer than the 18 month nominal wave

Medium Term
Components between the 20 week to 18 month nominal wave

Short Term
Components shorter than the 20 week nominal wave

Trading Strategy
Interaction Status
Interactions and price in the FLD Trading Strategy (Advanced). This looks at an idealised 40 week cycle and an array of 3 FLD signal cycles. We apply the instrument’s phasing to the model and arrive at an overall summary for the interactions with the 20 day FLD, current and forthcoming.
Sigma-L recommendation: Buy
Entry: 10 Day VTL / FLD
Stop: Below forming 20 week nominal low
Target: 1.24
Reference 20 Day FLD Interaction: A3
Underlying 40 Day FLD Status: A2
Underlying 80 Day FLD Status: E
Price is currently straddling the 10 day downward VTL. Targets are up at 1.24 which would imply a tracking of the 20 week FLD and a test of the previous 20 week nominal peaks in the coming weeks. The 18 month FLD resistance (shown in yellow below) is also around this area.
FLD Settings
If you do not have the use of Sentient Trader use these settings to plot common FLDs in your trading software (daily scale) to more easily follow trading signals and strategy from Sigma-L.
Make sure to account for non-trading days if your broker omits them in the data feed (weekends, for example). The below offsets are given with no added calculation for non-trading days.
80 day nominal: 70 days | 35 day FLD offset
40 day nominal: 36.3 days | 18 day FLD offset
20 day nominal: 17.8 days | 9 day FLD offset
10 day nominal: 9 days | 4 day FLD offset


