Sigma-L: Expert Market Cycles Insight

Sigma-L brings the power of modern signal processing techniques, with a nod to the insight of engineer JM Hurst, to retail traders, funds and institutions.

Expect a compact and frequent email newsletter format, covering major market turning points and penned by an expert in the application and design of signal processing software for financial markets.

Before and after in our US Stock Market Composite (SPX, DJIA, RUT). Identification of the prominent periodic feature below 100 days, at around 75 days average wavelength. This is an example of one trough iteration in October 2023.

Proposed robustly by pioneering engineer JM Hurst in the 1960s and 1970s, periodic motion in financial markets is often bewildering for the average trader. Although an attempt was made by Hurst himself to simplify the techniques to a totally practical level in the now rare Cyclitec Cycles Course, many new and enthusiastic students are often disconcerted with the mathematical foundation at the heart of this approach.

A beautiful periodic signal around 75 days in our Uranium composite, which tracks several sector related instruments, underpins the course structure in this important metal

Today, innovations in software and signal processing techniques would have amazed Hurst, allowing a huge range of markets to be subjected to this kind of time-series analysis.

An extremely good signal present in the Gold market, at around 55 days average wavelength since March 2021. On each report we give a rating for the signal identified, based upon time-series and signal processing analysis criteria of statistical significance.

Our bespoke time frequency analysis allows the investor or trader to leverage the predictive power of periodic functions present in financial markets. The edge a trader or general investor can gain from a deep knowledge of these techniques will be indispensable.
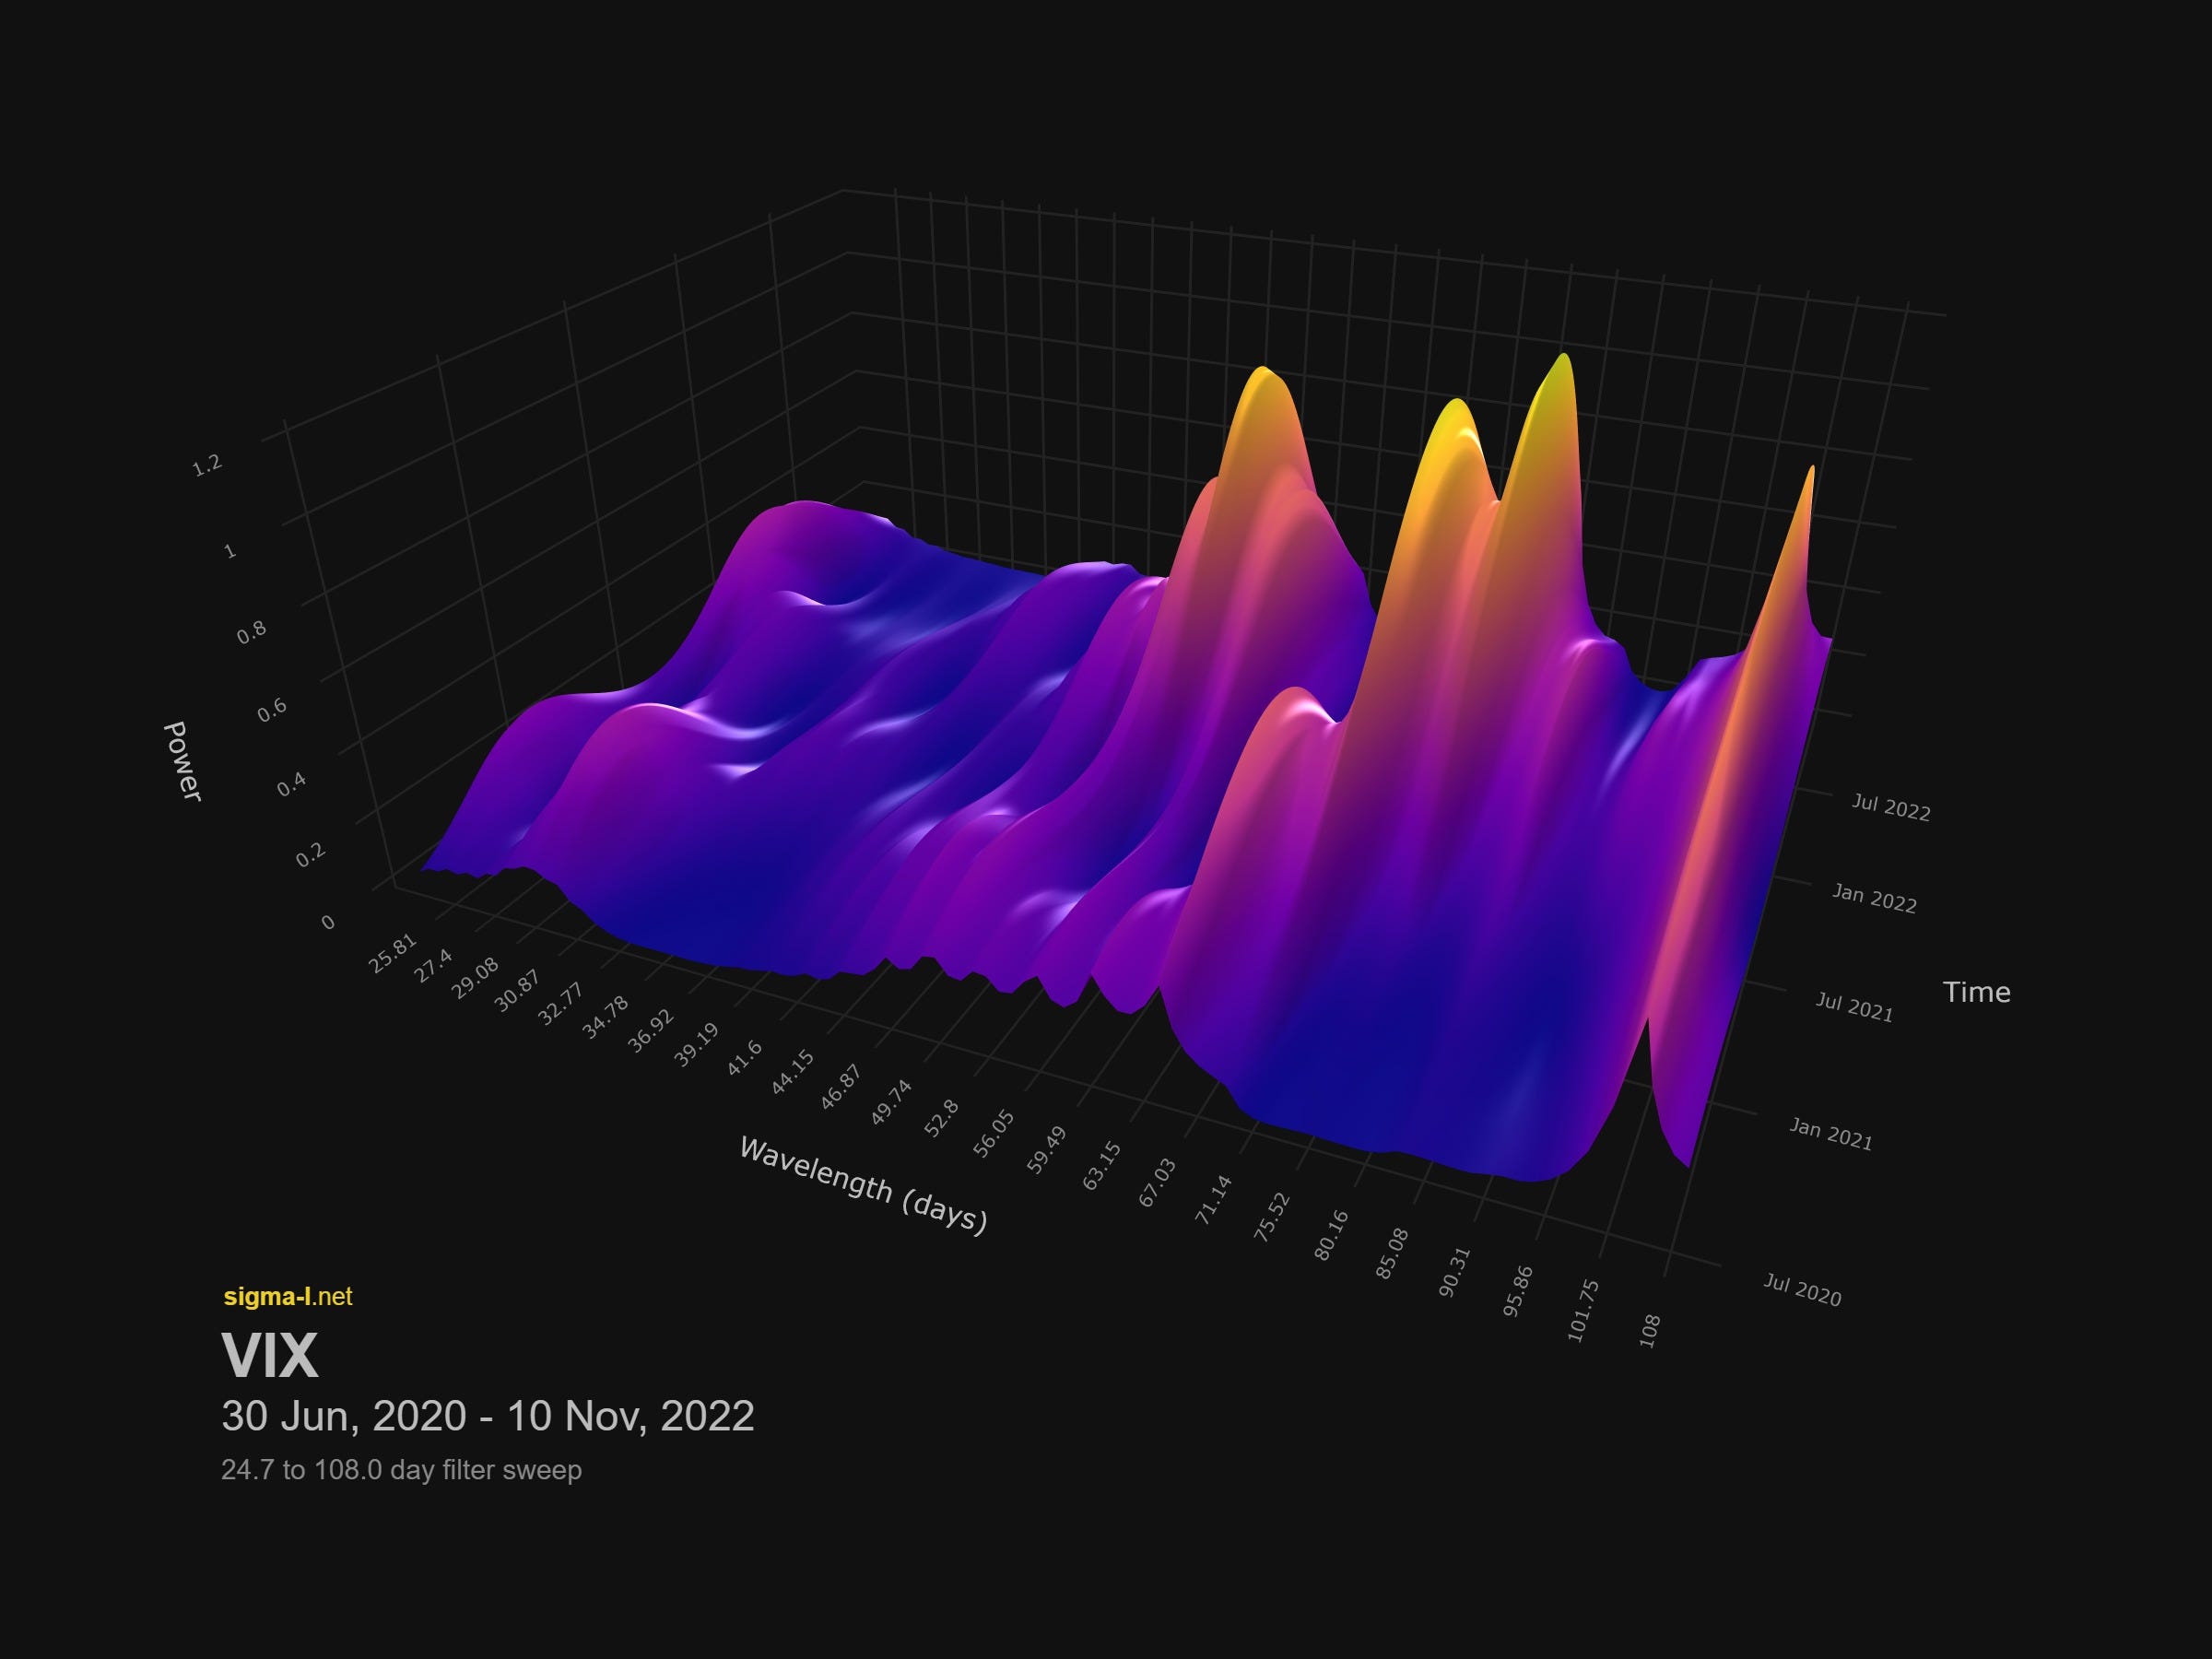
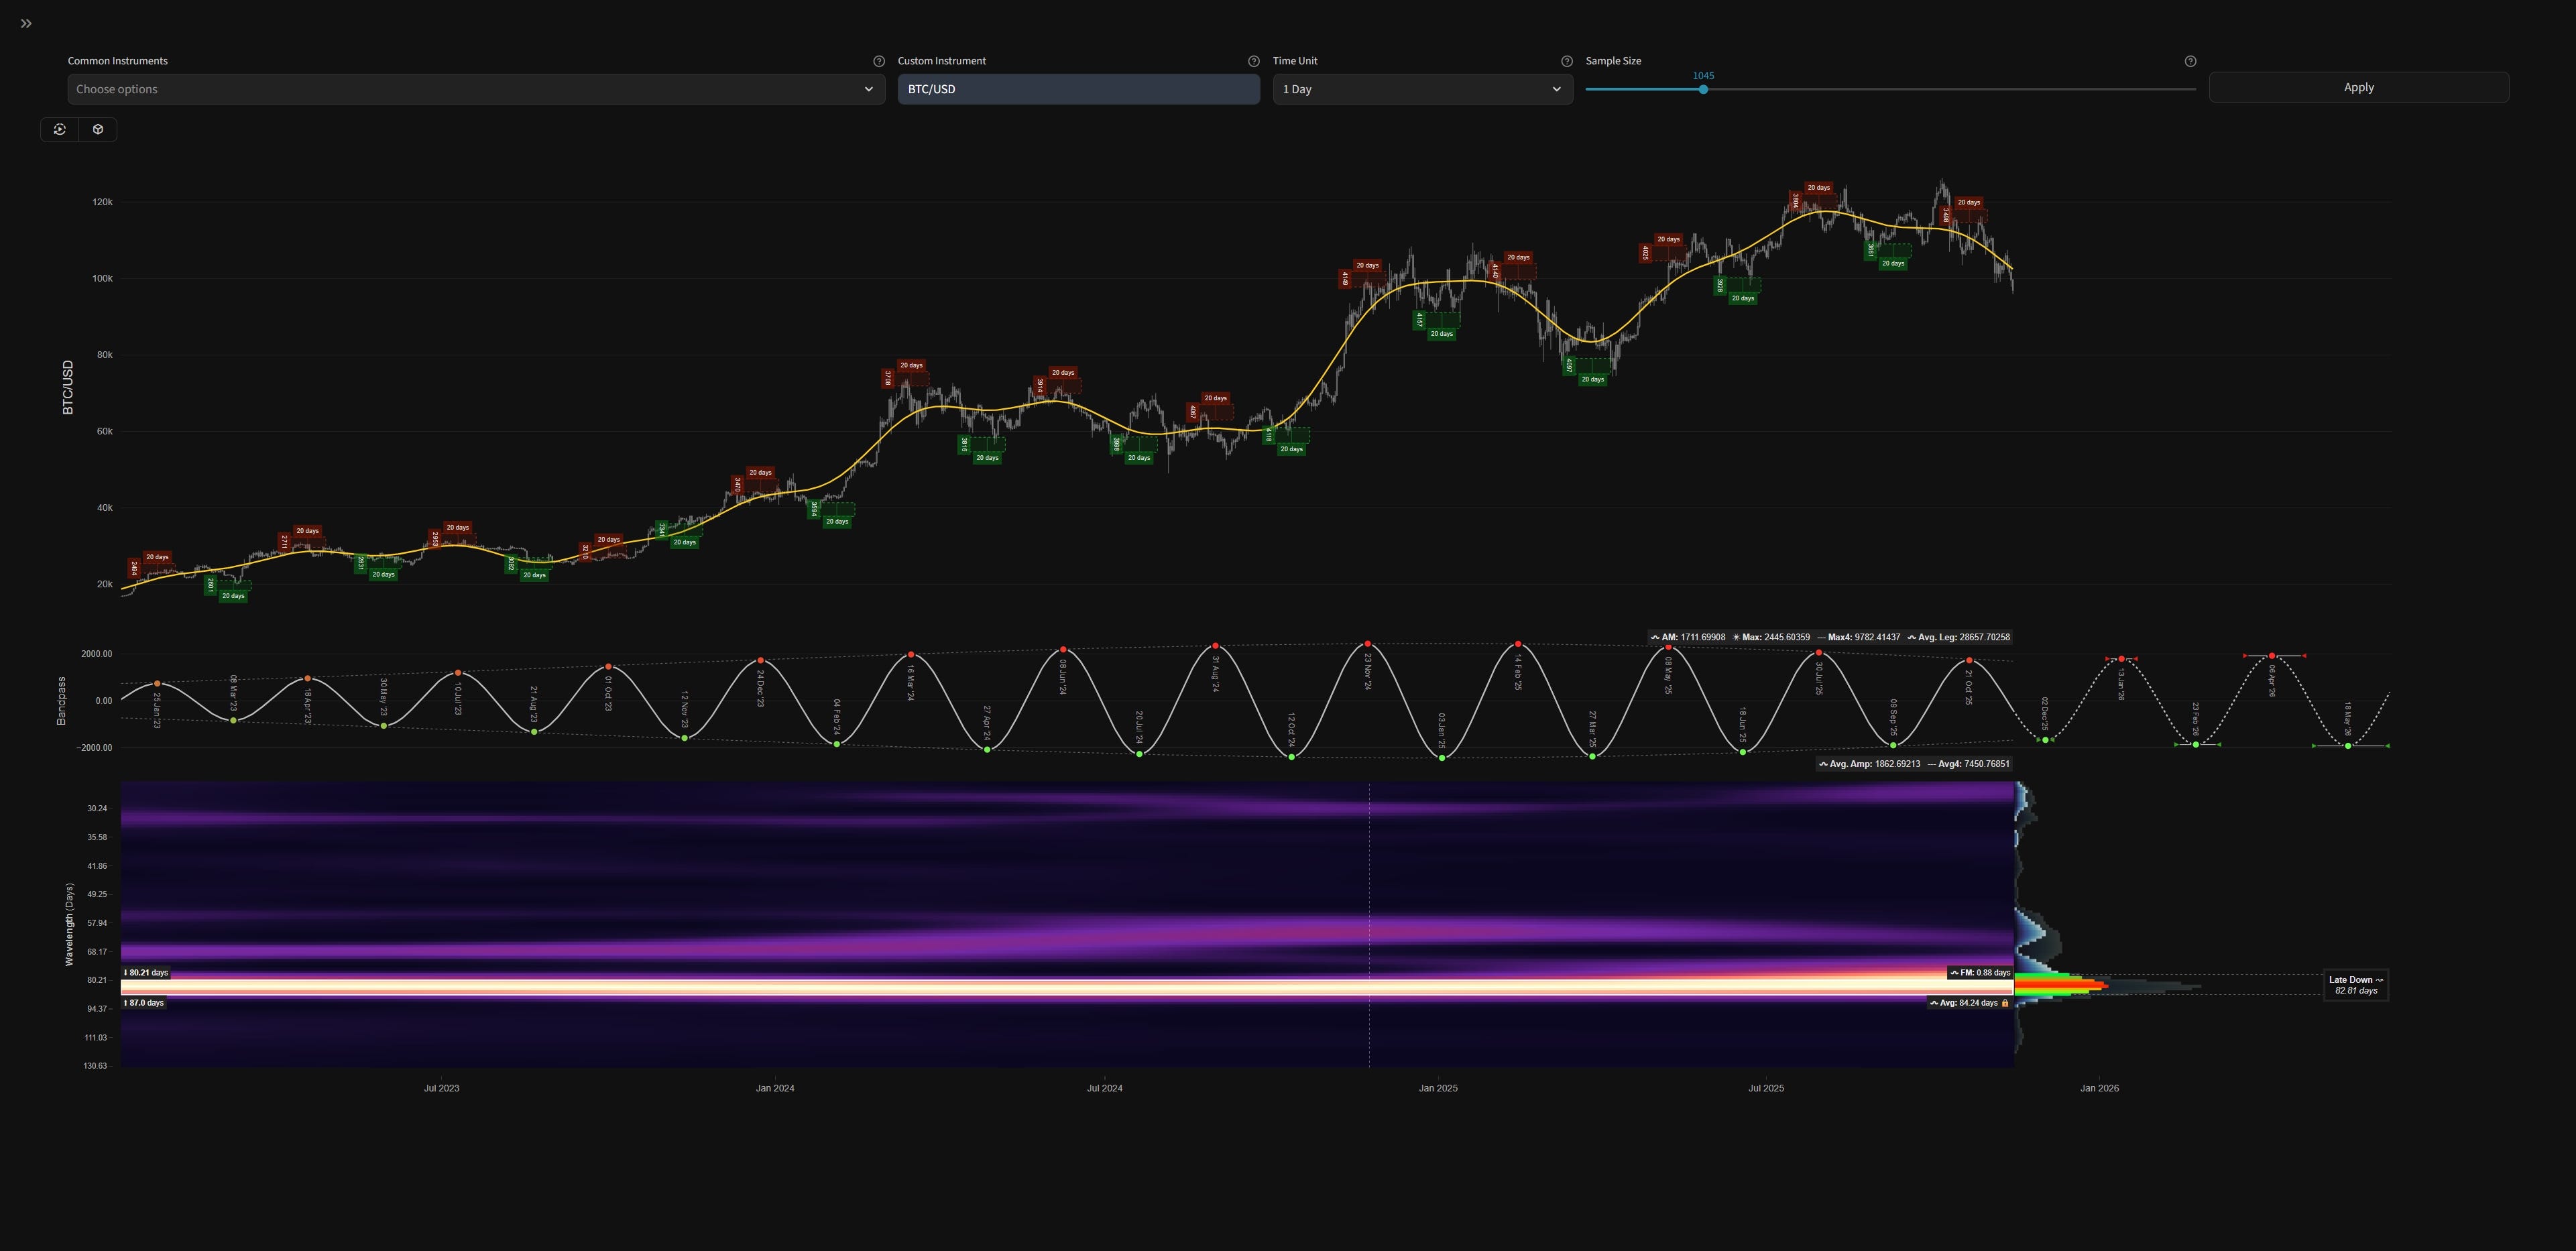
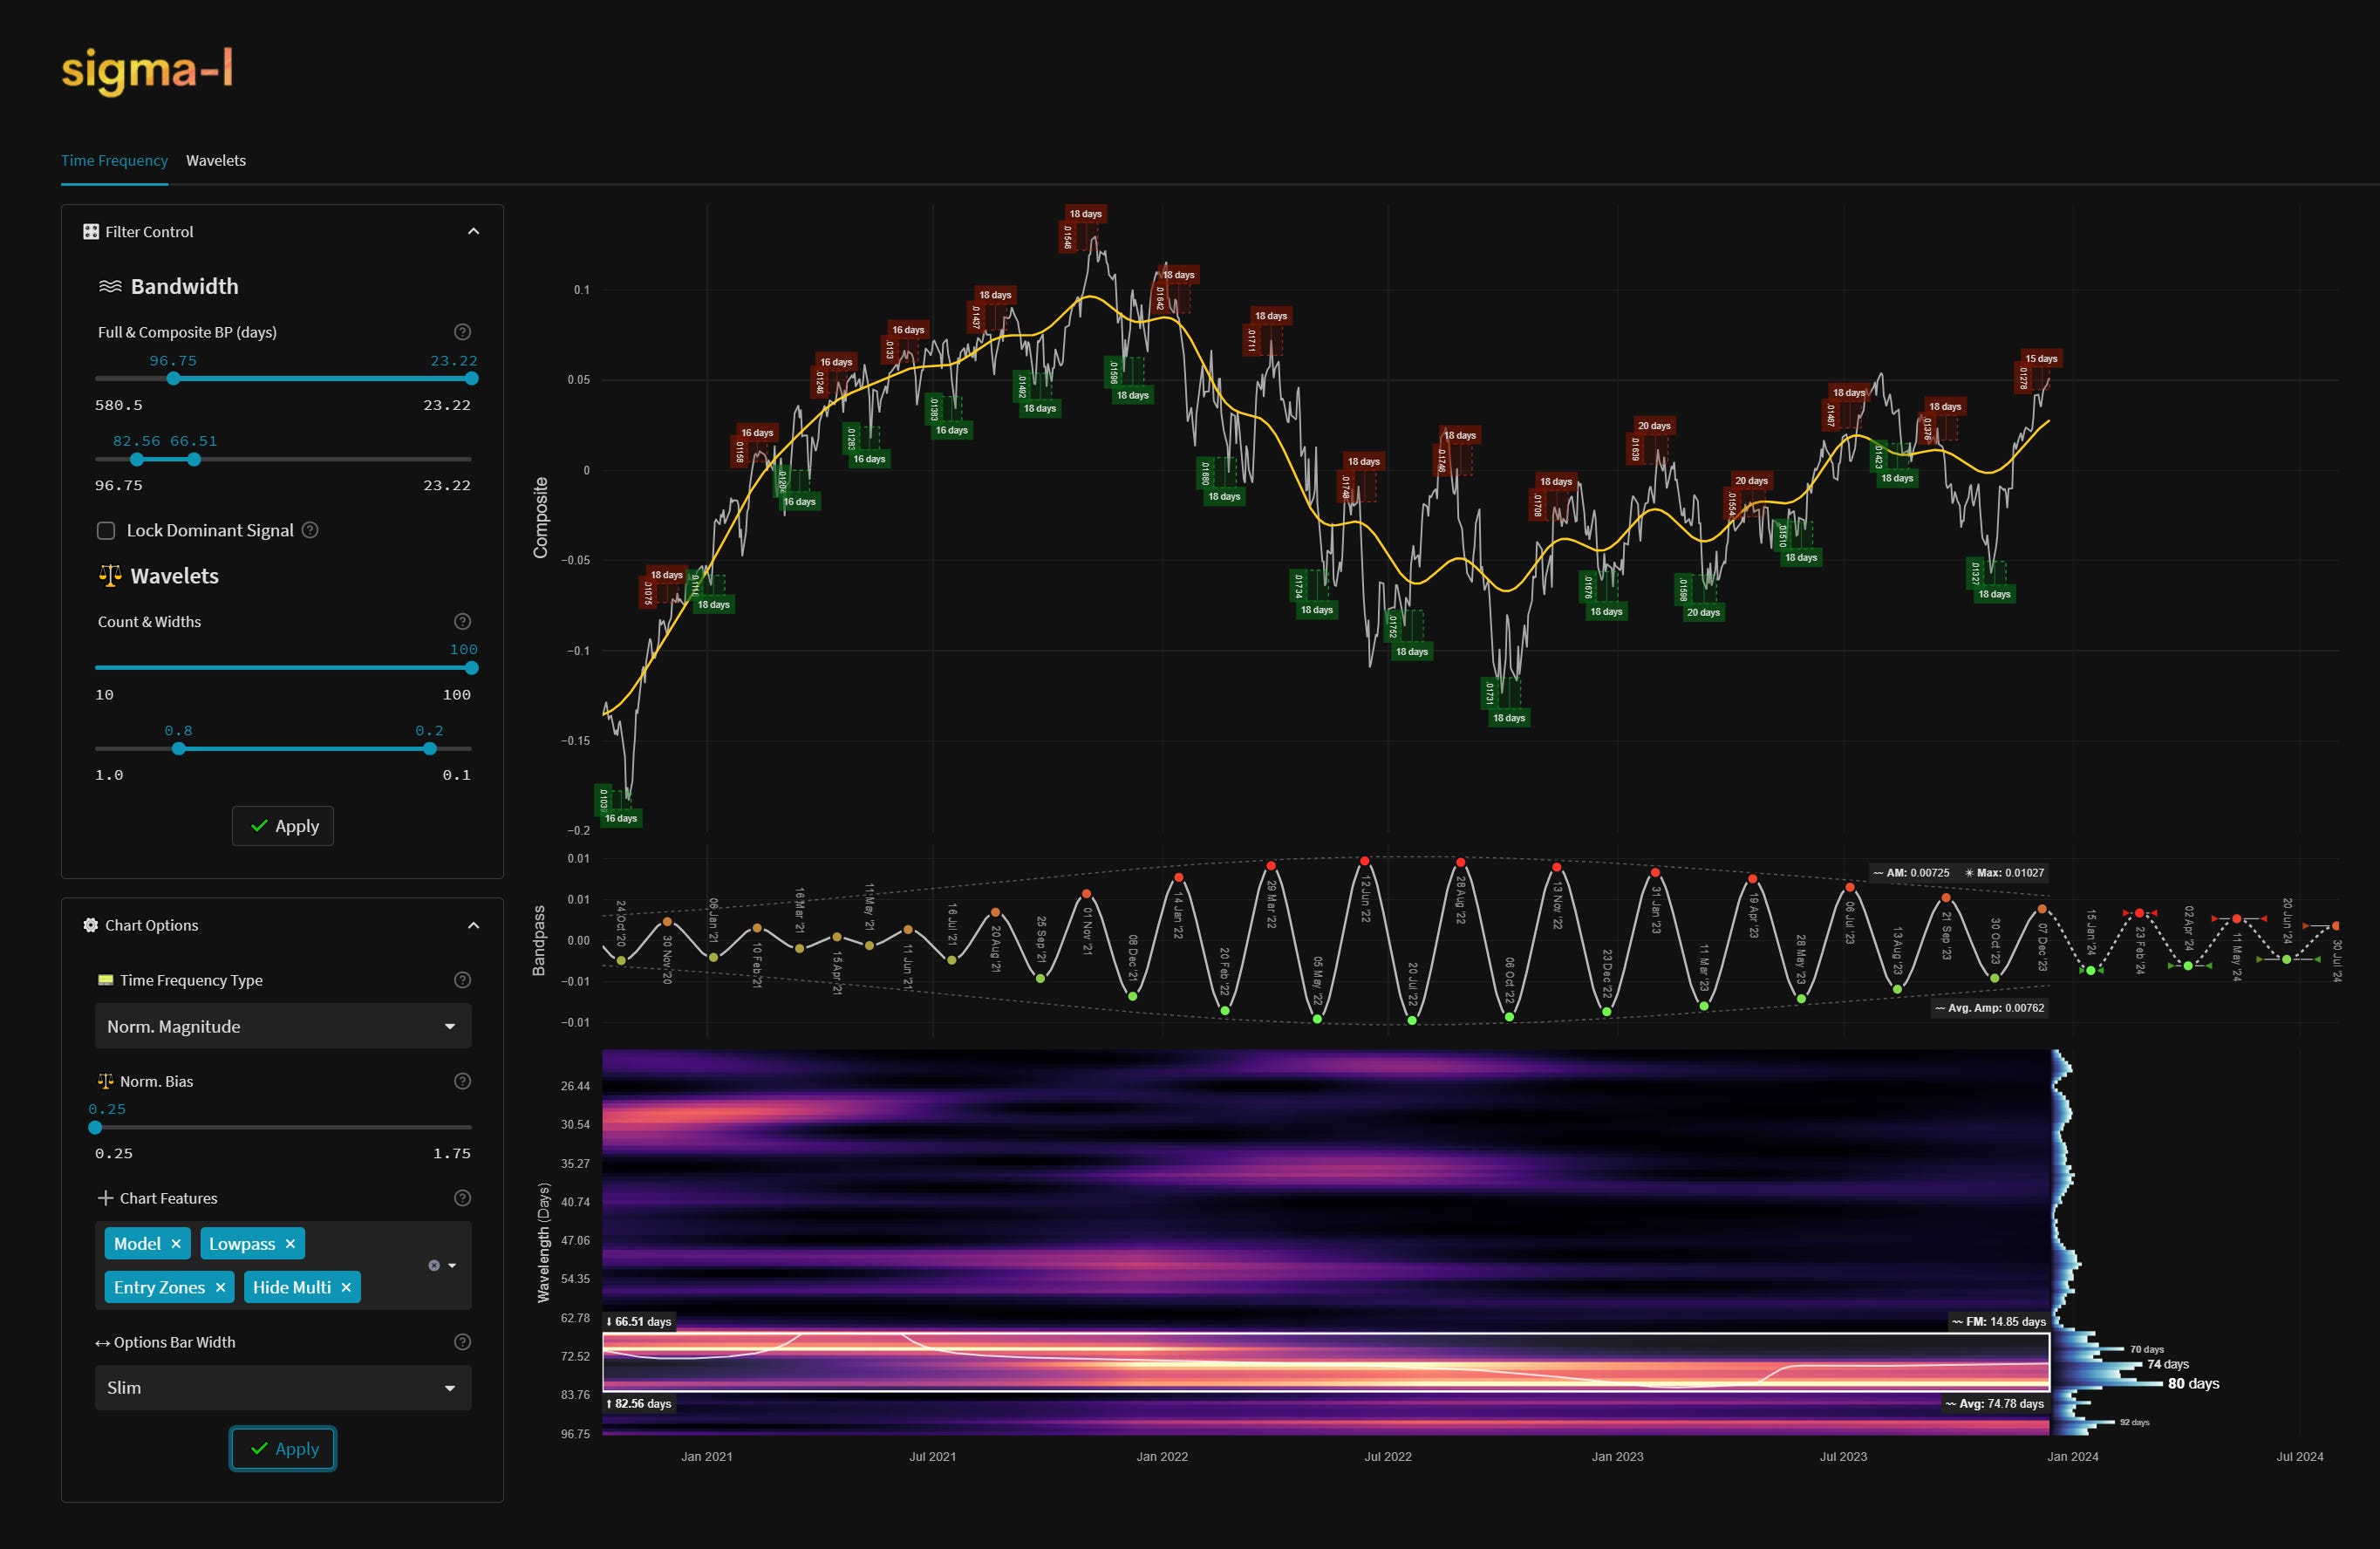
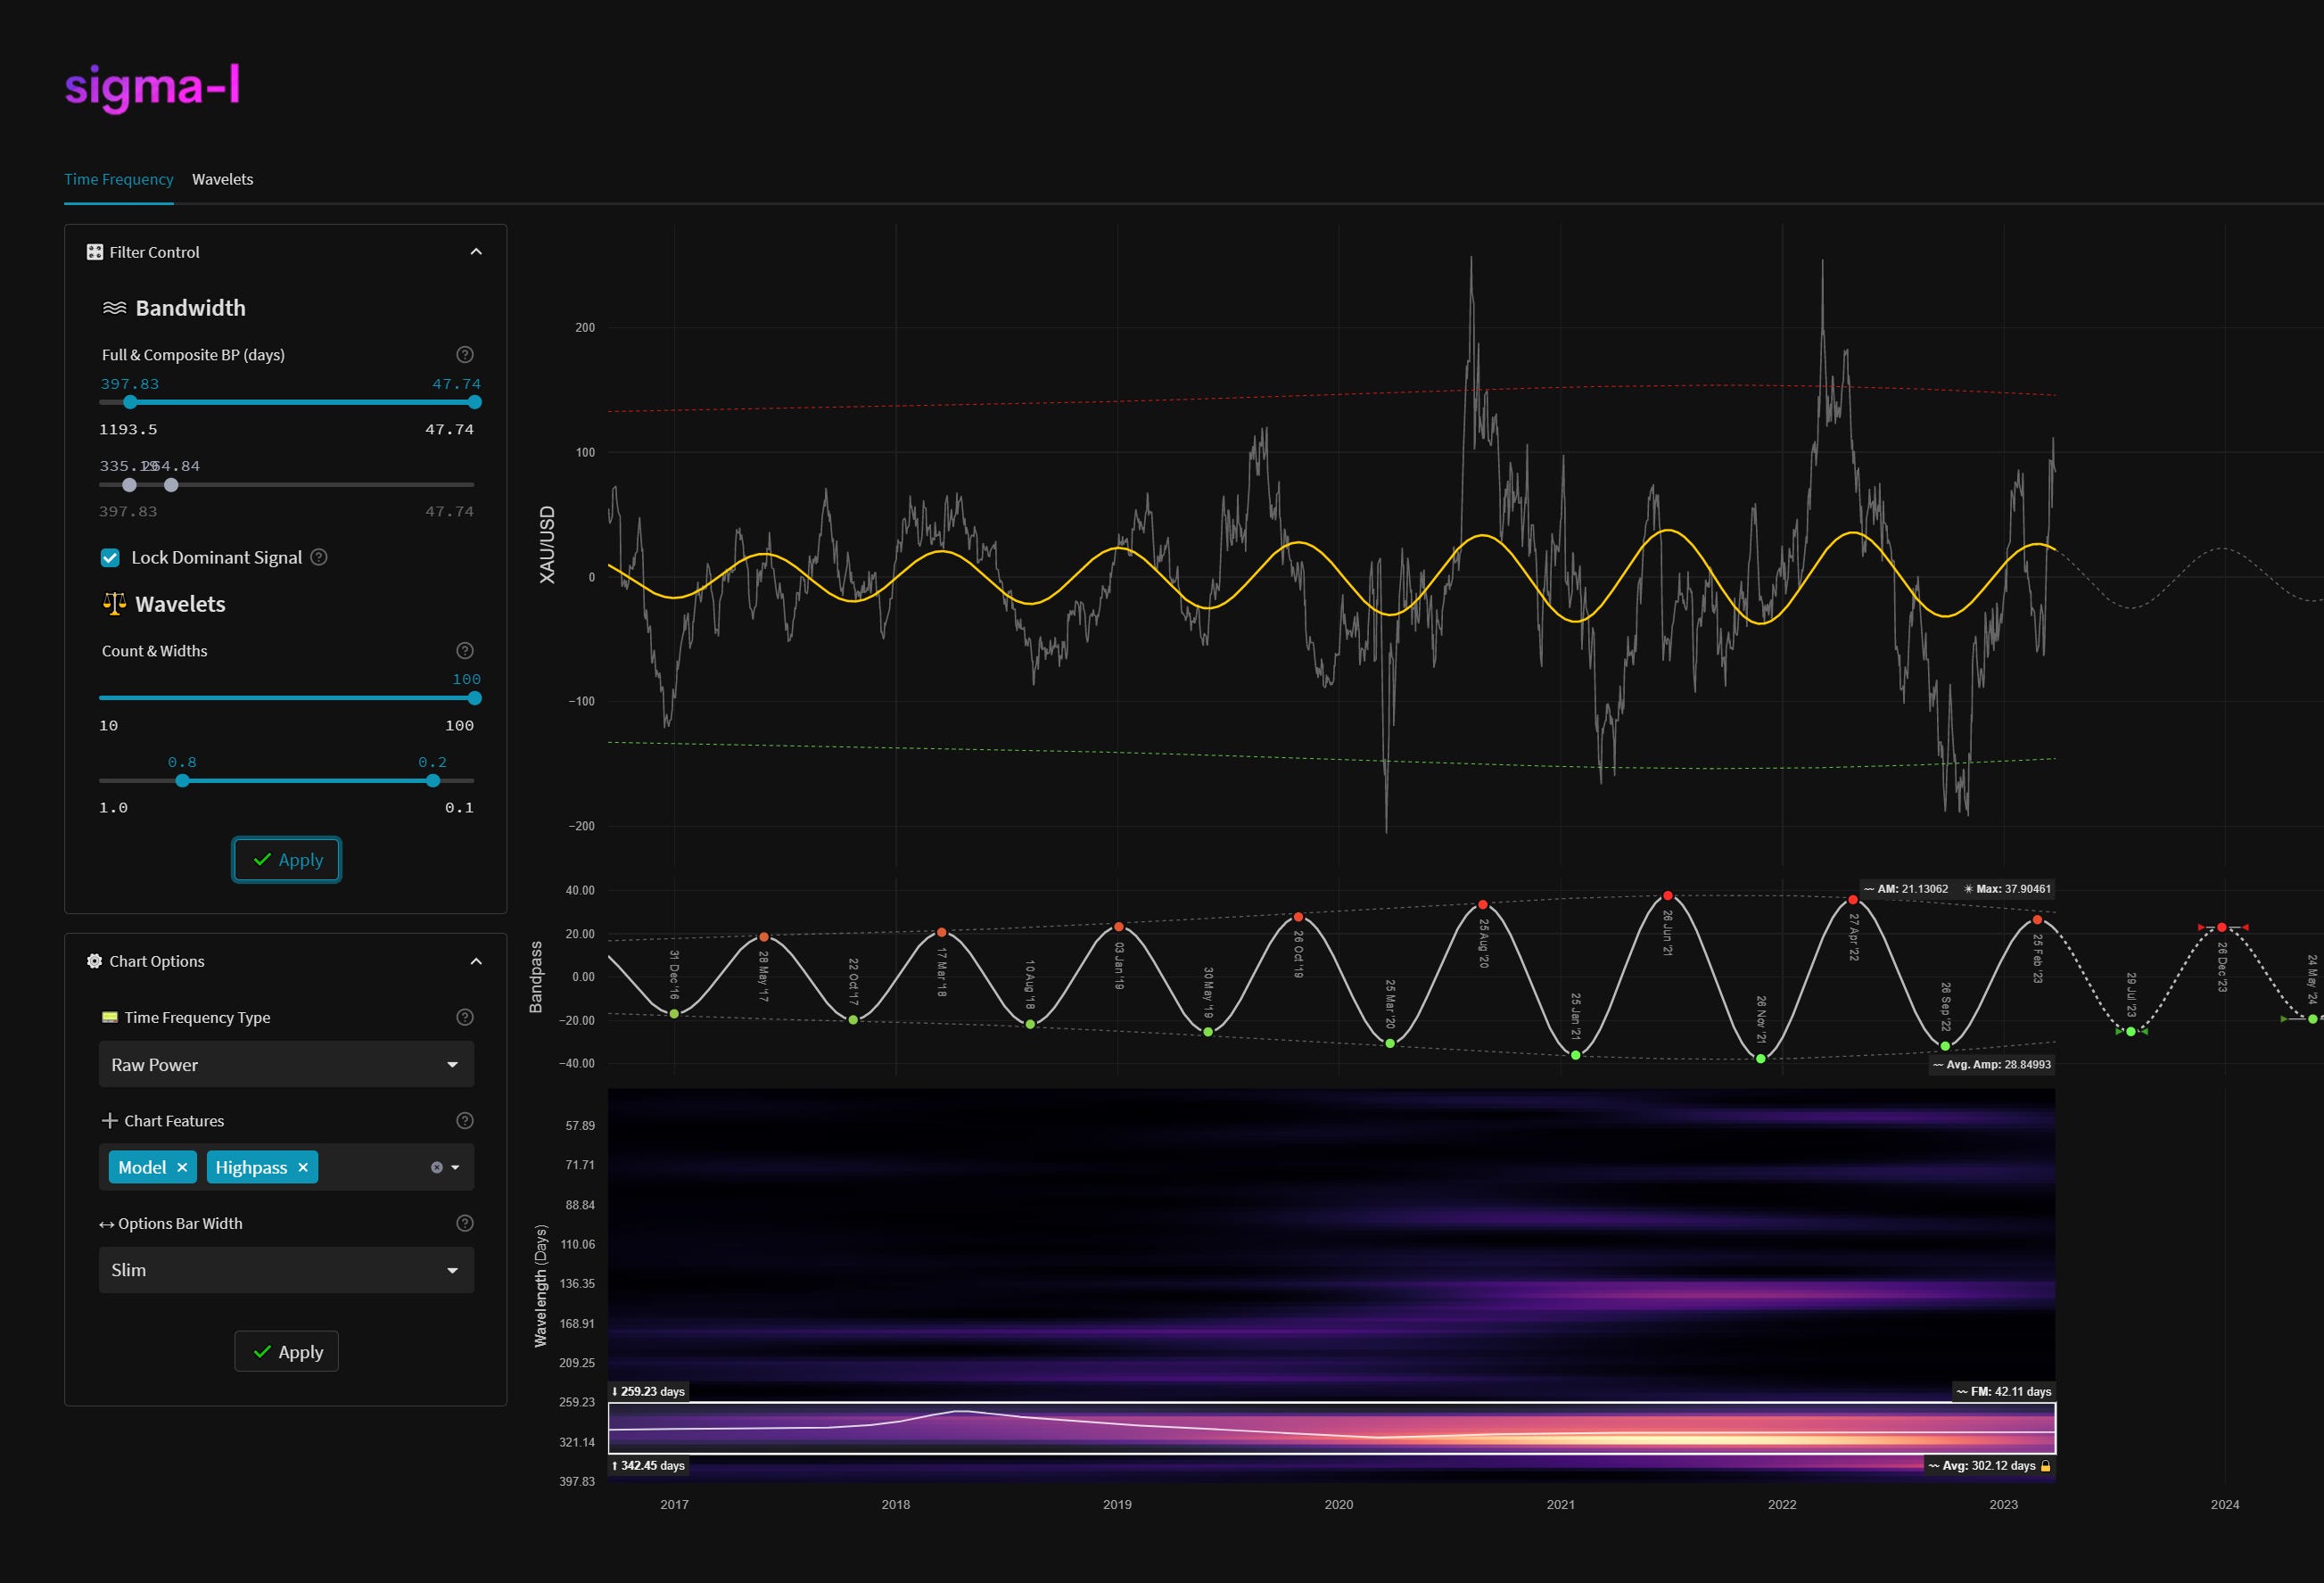
Here the remarkable cyclicality of the VIX volatility index is highlighted with a wonderful component around 68 days present, amongst others. This kind of visualisation can help identify periodic functions in markets and their relationships to each other over time.

Analysis Examples

An extremely coherent periodic wave is present in the CBOE Volatility Index (VIX). Here we track the latest move down from a peak in late October 2023
The fantastic signal in Copper Futures around the 79 day mark.

Our Software and Techniques

Our analysis is now given mainly via the microscope of an unbiased time frequency analysis. For more details on this technique please check out our article: Hacking the Uncertainty Principle: Time Frequency

We keep an eye on longer term cycles too. Above a before and after in WTI Crude Oil, the component around 16 months is readily discerned.
A typical time frequency analysis. In this case the instrument is USDCAD, daily. We identify a component of excellent signal quality around 75 days.
Gold and the component around 300 days from this sample, price is also high passed.

DISCLAIMER: This website/newsletter and the charts/projections contained within it are intended for educational purposes only. Results and projections are hypothetical. We accept no liability for any losses incurred as a result of assertions made due to the information contained within Sigma-L. This report is not intended to instruct investment or purchase of any financial instrument, derivative or asset connected to the information conveyed in the report. Trade and invest at your own risk.

User's avatar

Subscribe to Sigma-L - Market Cycles

Gain a unique insight into financial market movement via our proprietary time frequency analysis, coupled with expert insight. Updates each week on major markets across the planet. If a cycle exists, we will detect it.

People

Full time trading for 8+ years. Merged JM Hurst's original great insight with modern signal processing techniques. Often contrary views on markets. Also code financial market based algorithms, play piano when I can and love cricket!