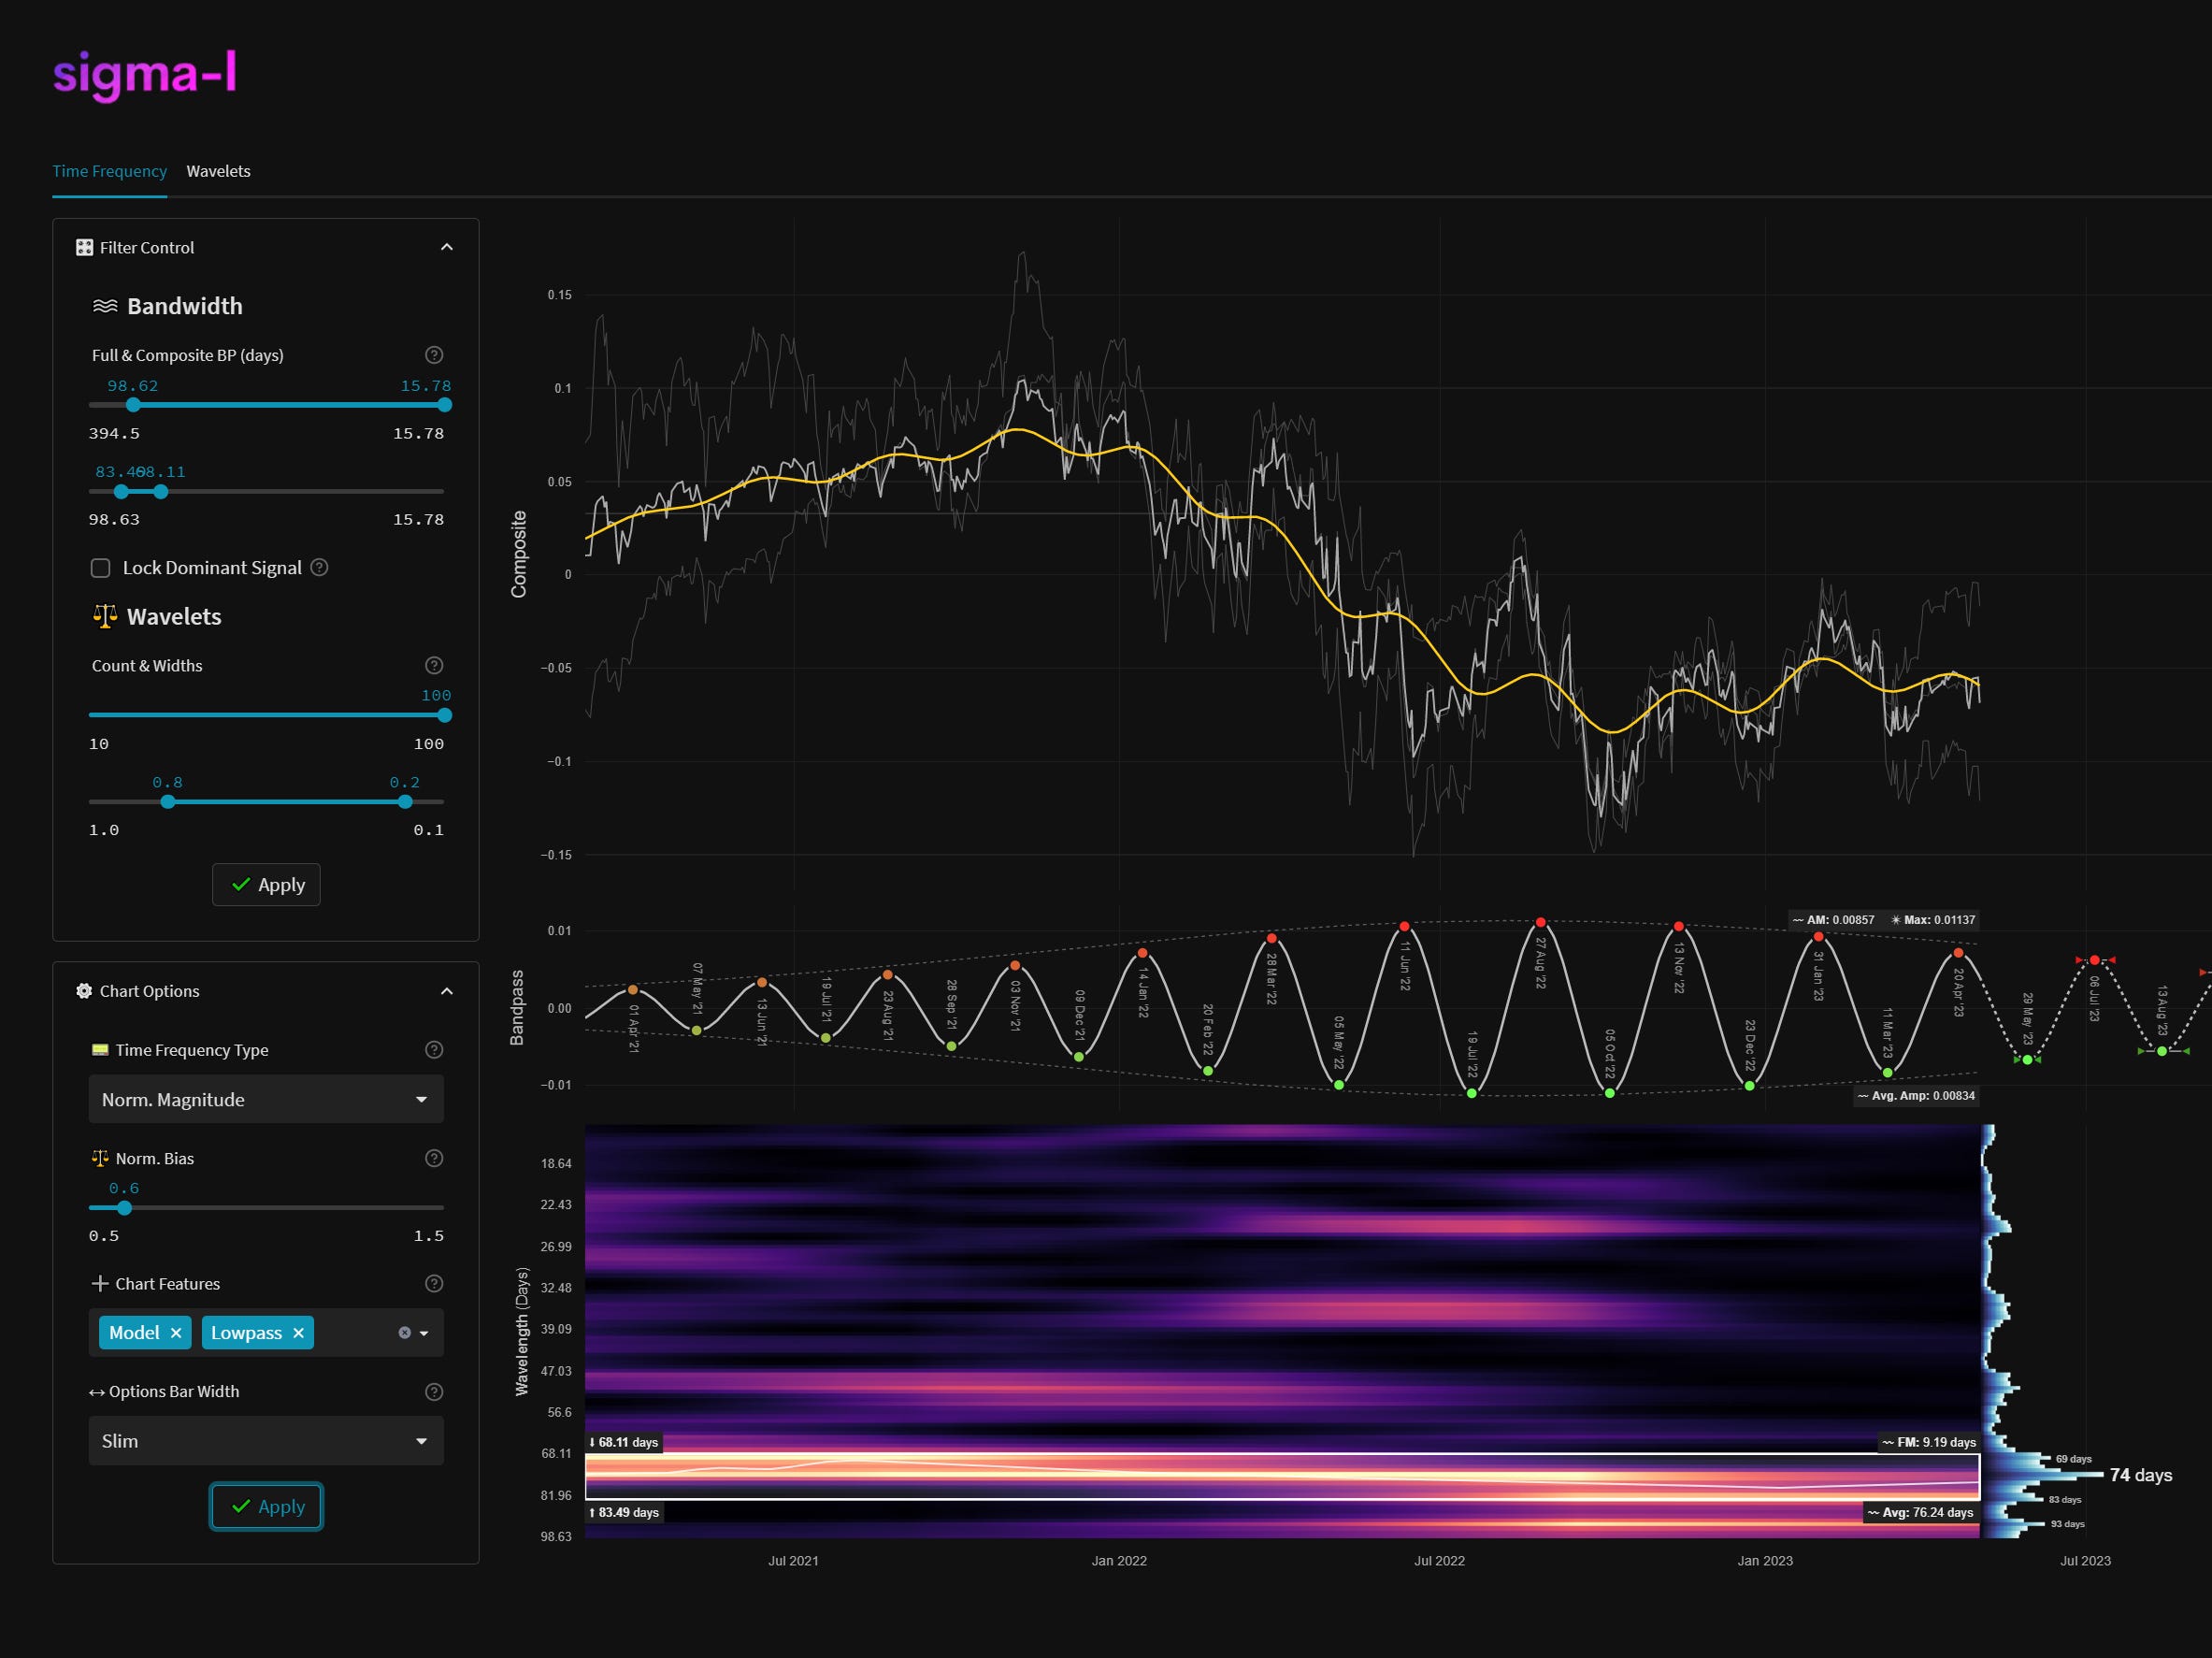
ΣL US Stock Market Composite - 2nd May 2023 | @ 76 Days | Snippet
'C' class signal detected in US stock market composite (Russell 2000, Dow Jones Industrial Average, S&P 500). Average wavelength of 76 days since March 2021. Currently moving down.

Signal Class & Attributes
Defining characteristics of the component detected over the sample period.
Detected Signal Class: B - learn more
Average Wavelength: 76.24 Days
Completed Iterations: 10
Time Frequency Analysis
Time frequency charts (learn more) below will typically show the cycle of interest against price, the bandpass output alone and the bandwidth of the component in the time frequency heatmap, framed in white. If a second chart is displayed it will usually show highpassed price with the extracted signal overlaid for visual clarity.