

TSLA (Tesla Inc.) Cycles - 30th January 2026 | 158 Day Cycle | + 3.00%
Last trade: + 3.00% | 'B' class cycle signal detected in TSLA (Tesla Inc). Running at an average wavelength of 158 days over 14 iterations since May 2020. Currently troughing.


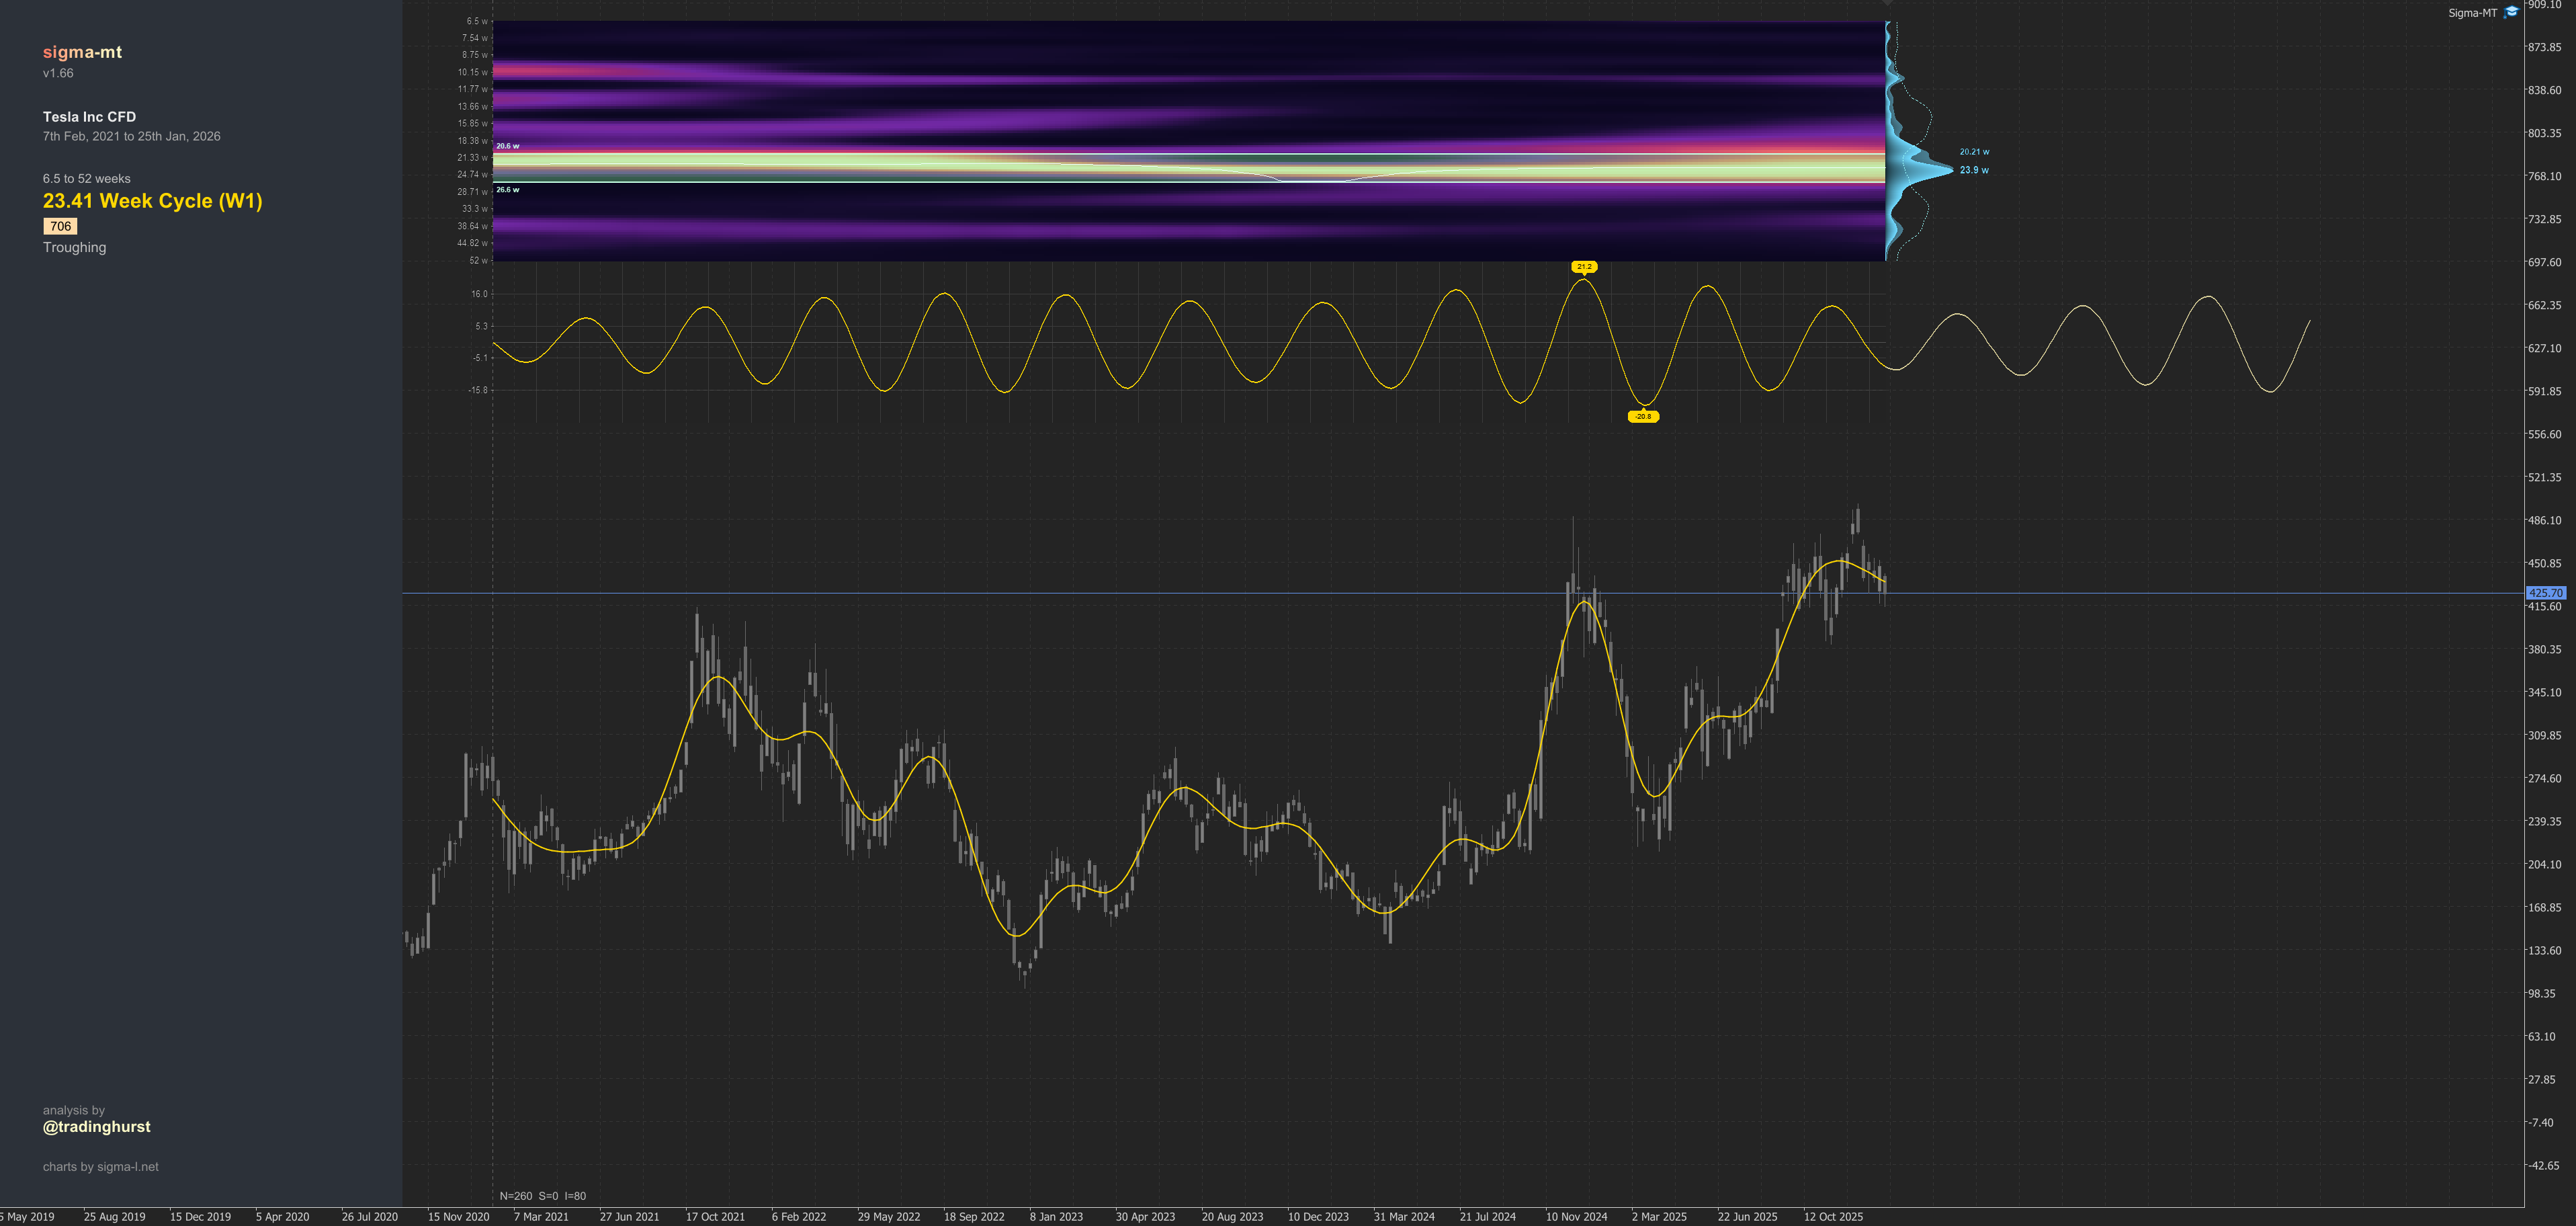
ΣL Cycle Summary
This robust ‘B’ class cycle in TSLA persists, delivering consistent performance across 14 iterations since May 2020, with an average wavelength of approximately 158 days at the current sample. The signal has yielded an impressive 716.31% over the sample period, a testament to it’s stability. Currently, the cycle is troughing, showing mild frequency modulation of +/-14 days, in line with a very stationary periodic feature. Following the recent fairly sideways down leg, the next bullish phase of this cycle is upon us with the upcoming peak anticipated toward the middle of April 2026.
Trade Update
Summary of the most recent trade enacted with this signal and according to the time prediction detailed in the previous report for this instrument, linked below.
Type: Sell - TSLA October 21st, 2025
Entry: 21st October, 2025 @ 442.60
Exit: 30th January, 2025 @ 429.34
Gain: 3.00%