

Sigma-MT: Development Update - January 2026
A brief look at how we have been refining the time-frequency engine and expanding analytical capabilities for this powerful tool.

Since the initial alpha announcement, development on Sigma-MT, a Meta-Trader 5 expert advisor, has progressed steadily and is nearing beta. This update covers some improvements to the underlying time-frequency analysis, visual refinements, and how the tool integrates with the recently announced scanner.
Time-Frequency Engine Updates
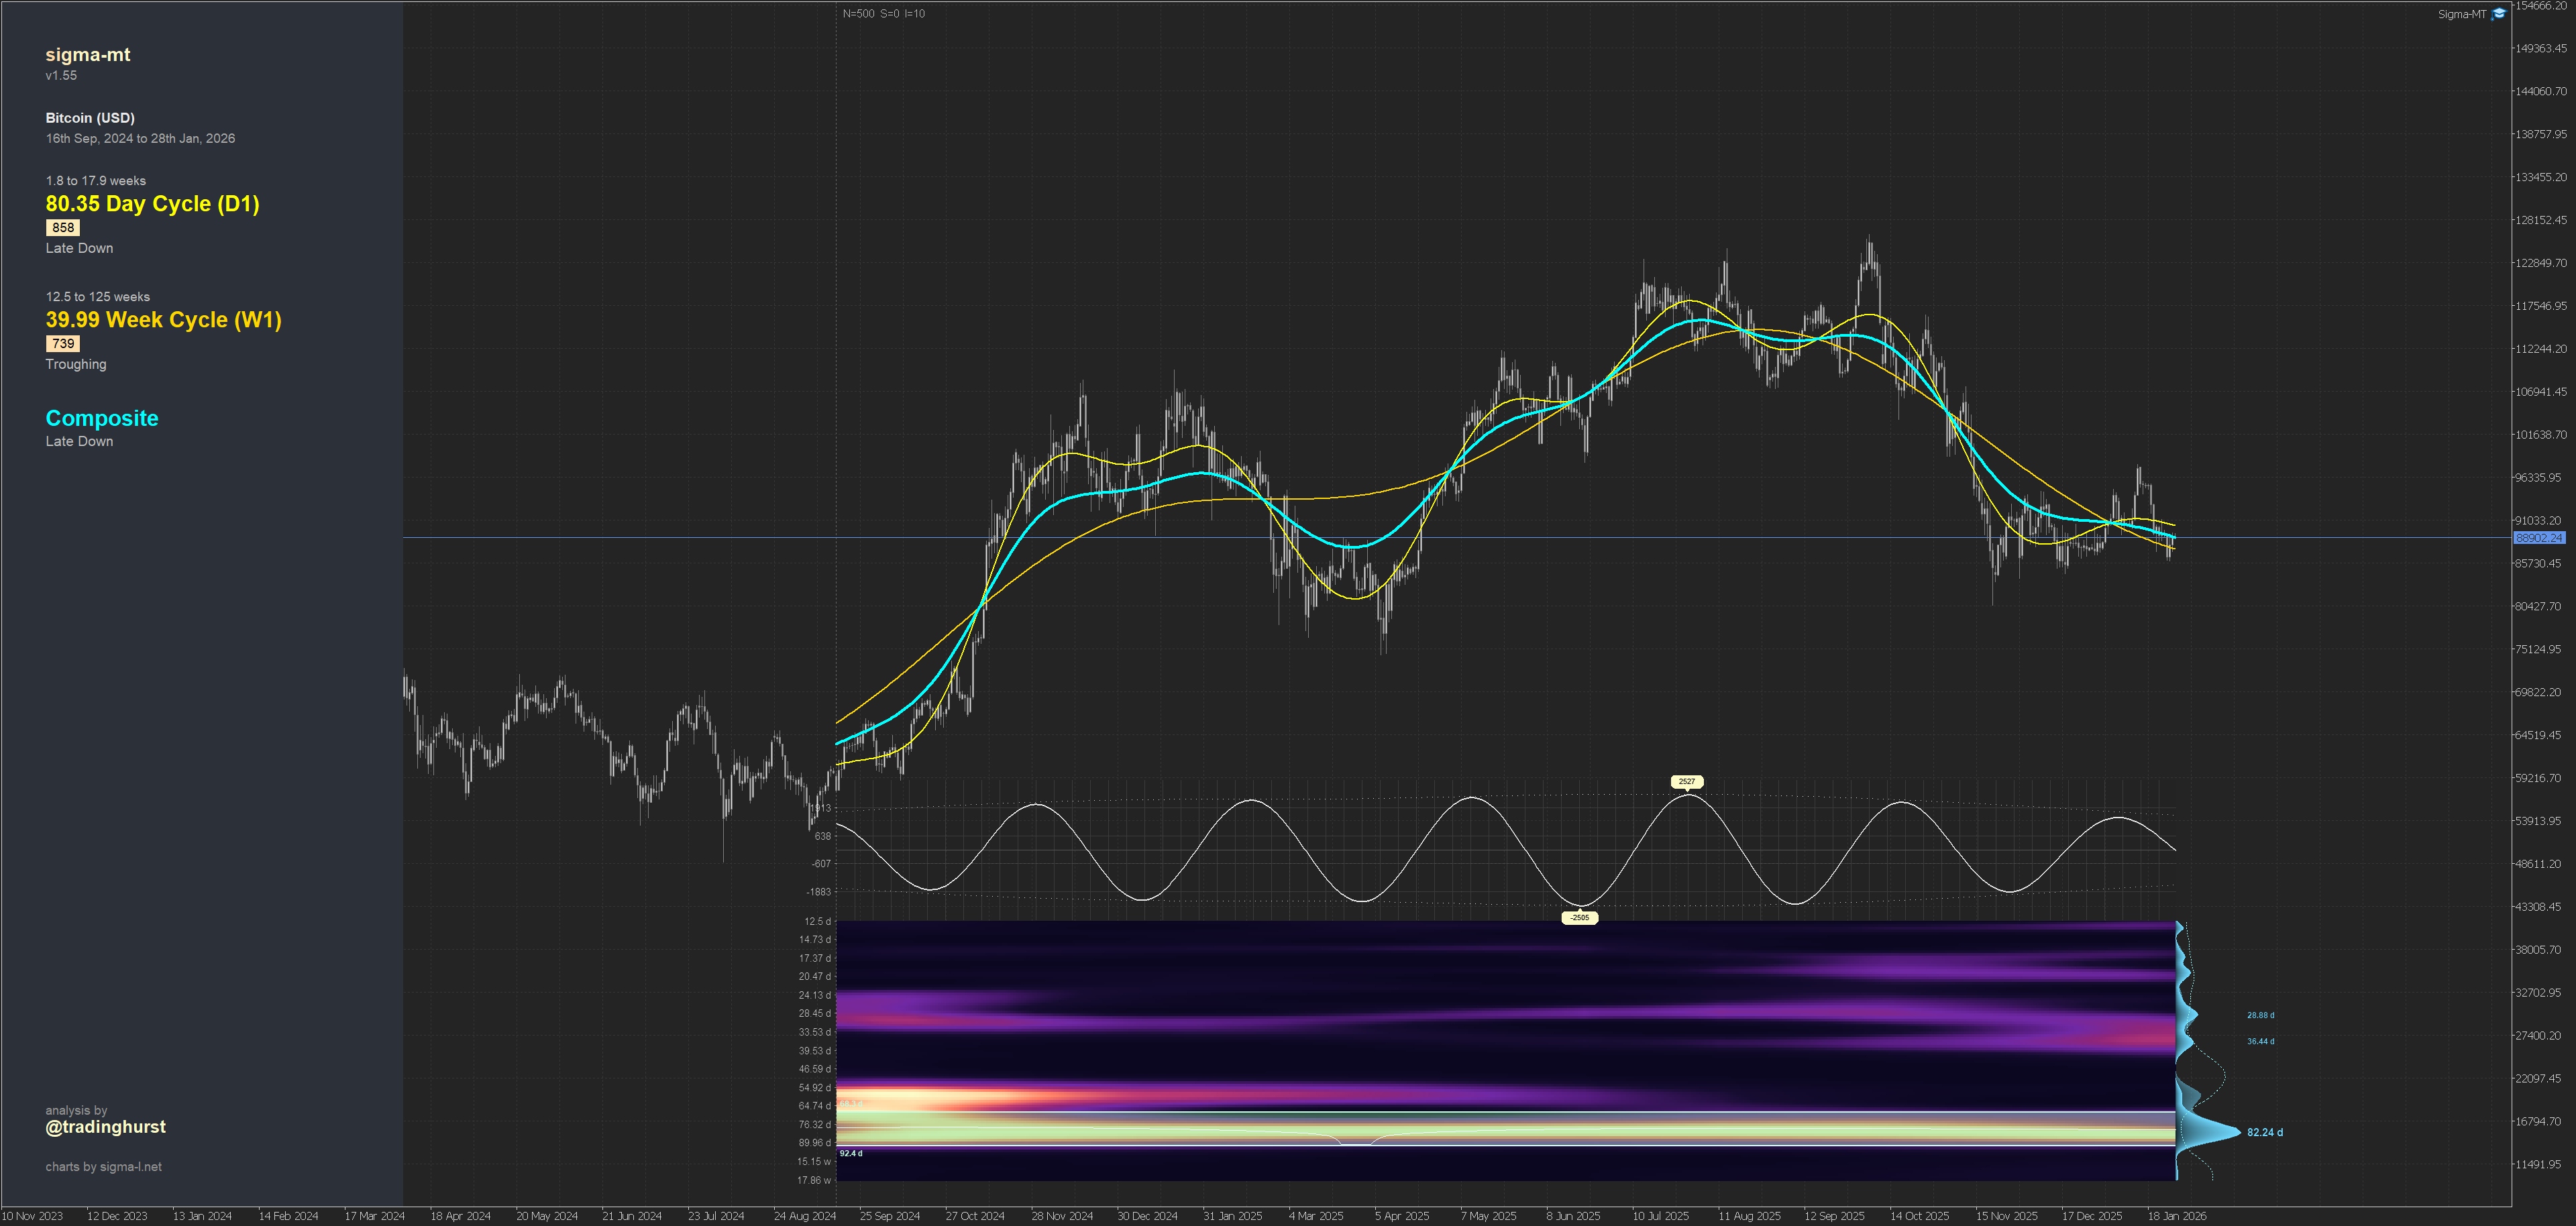
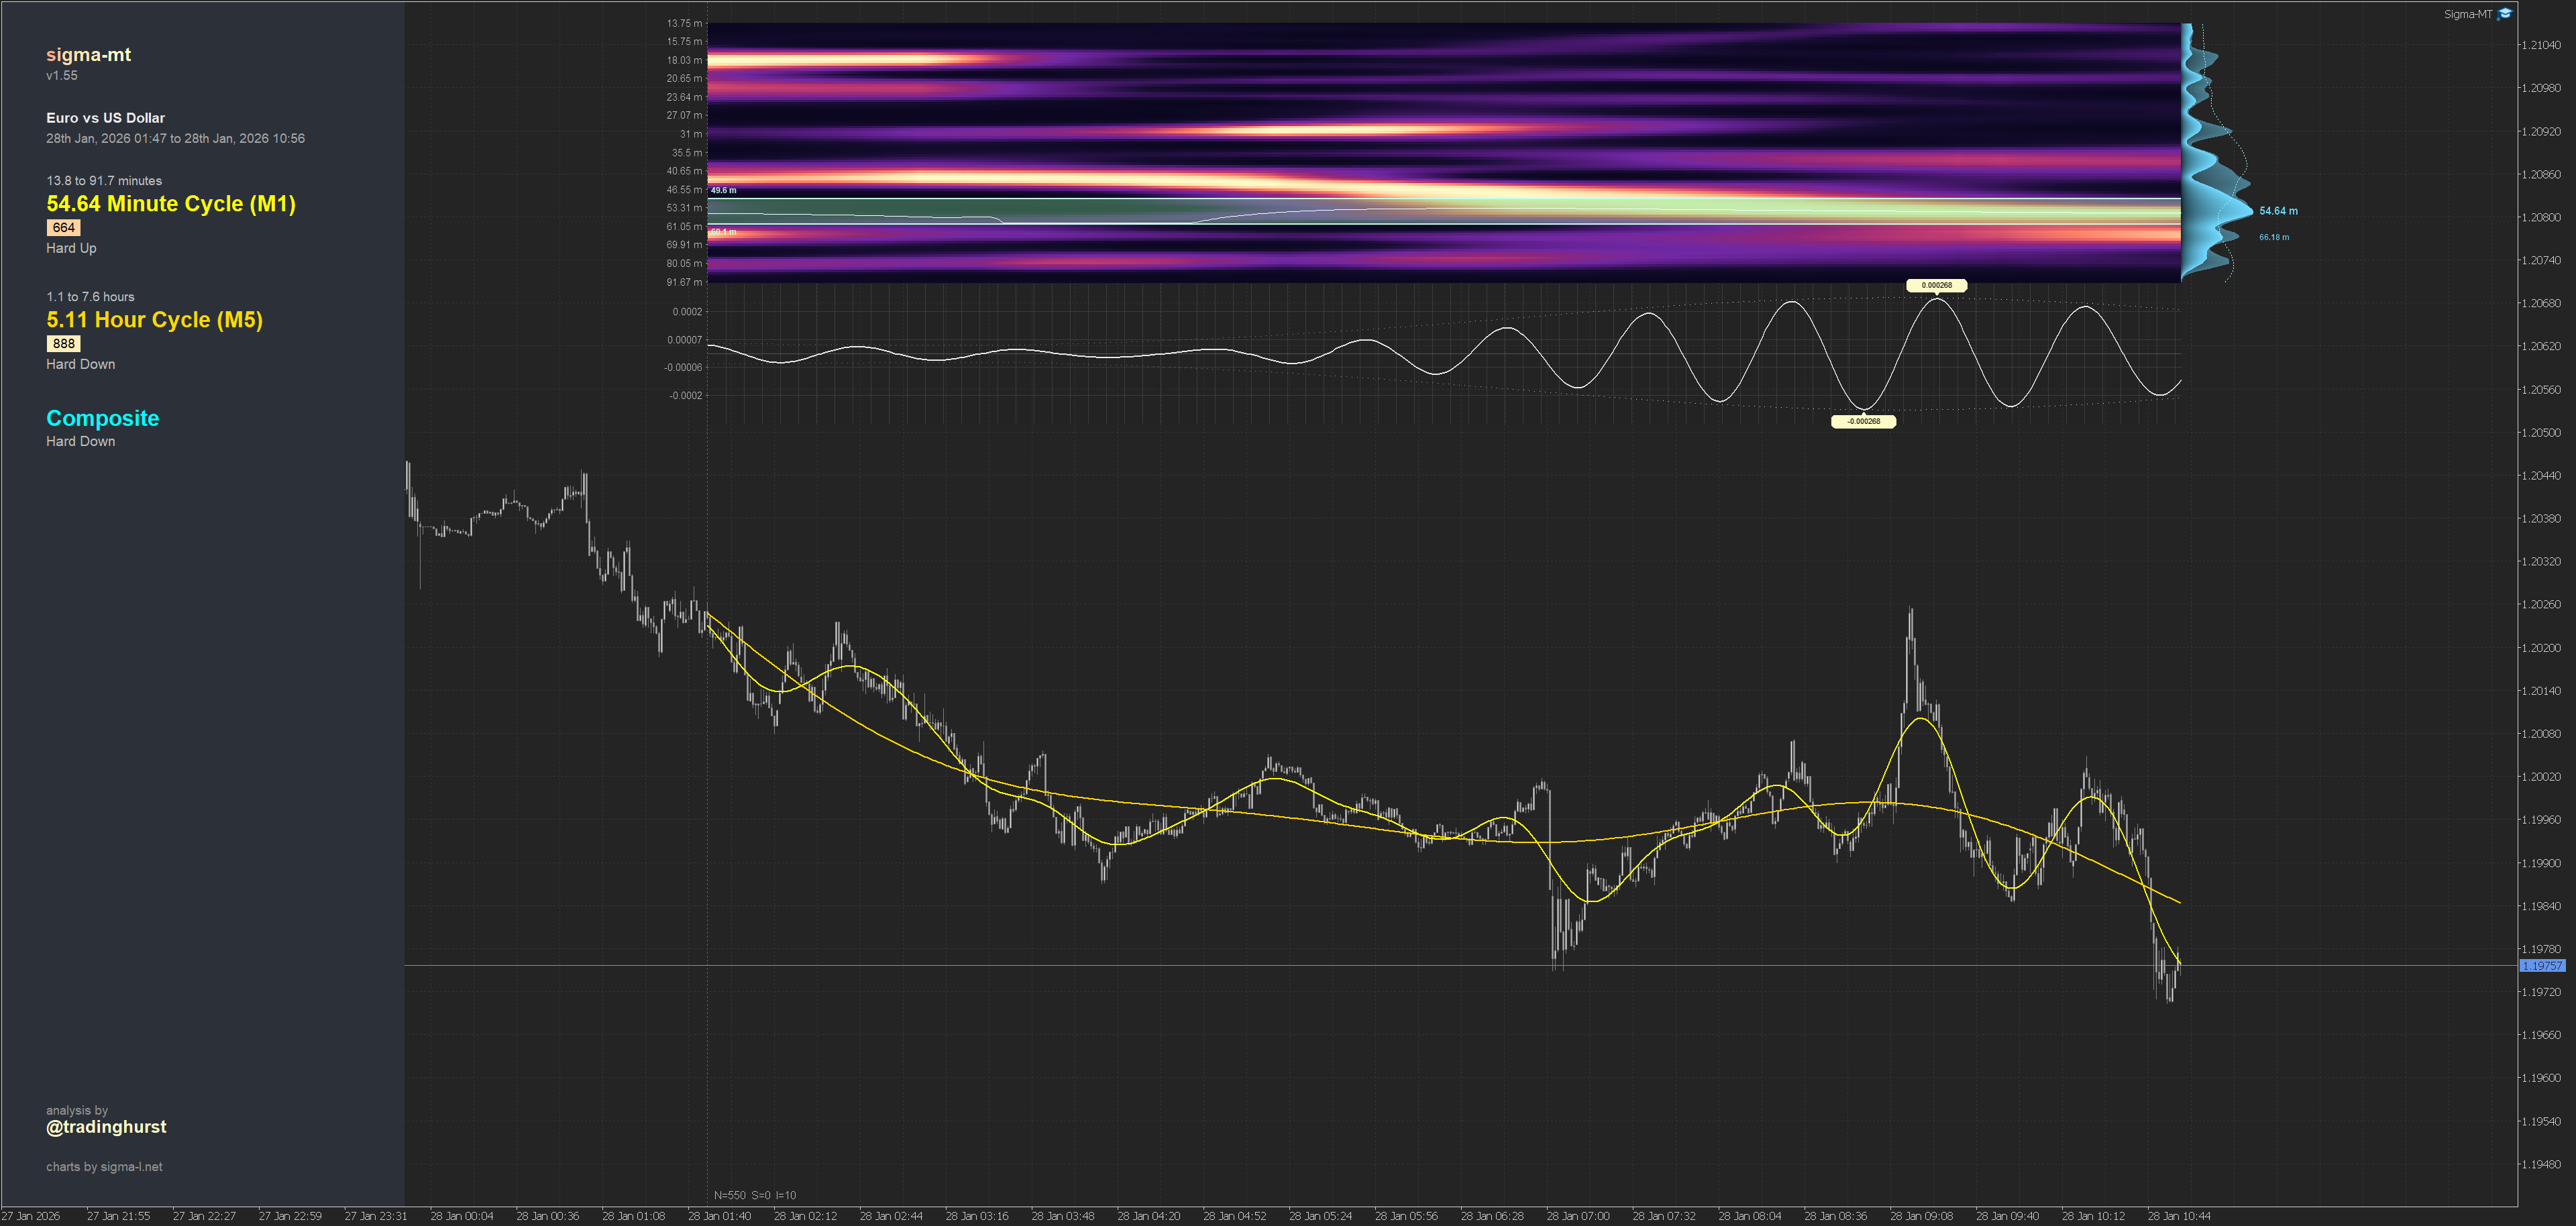
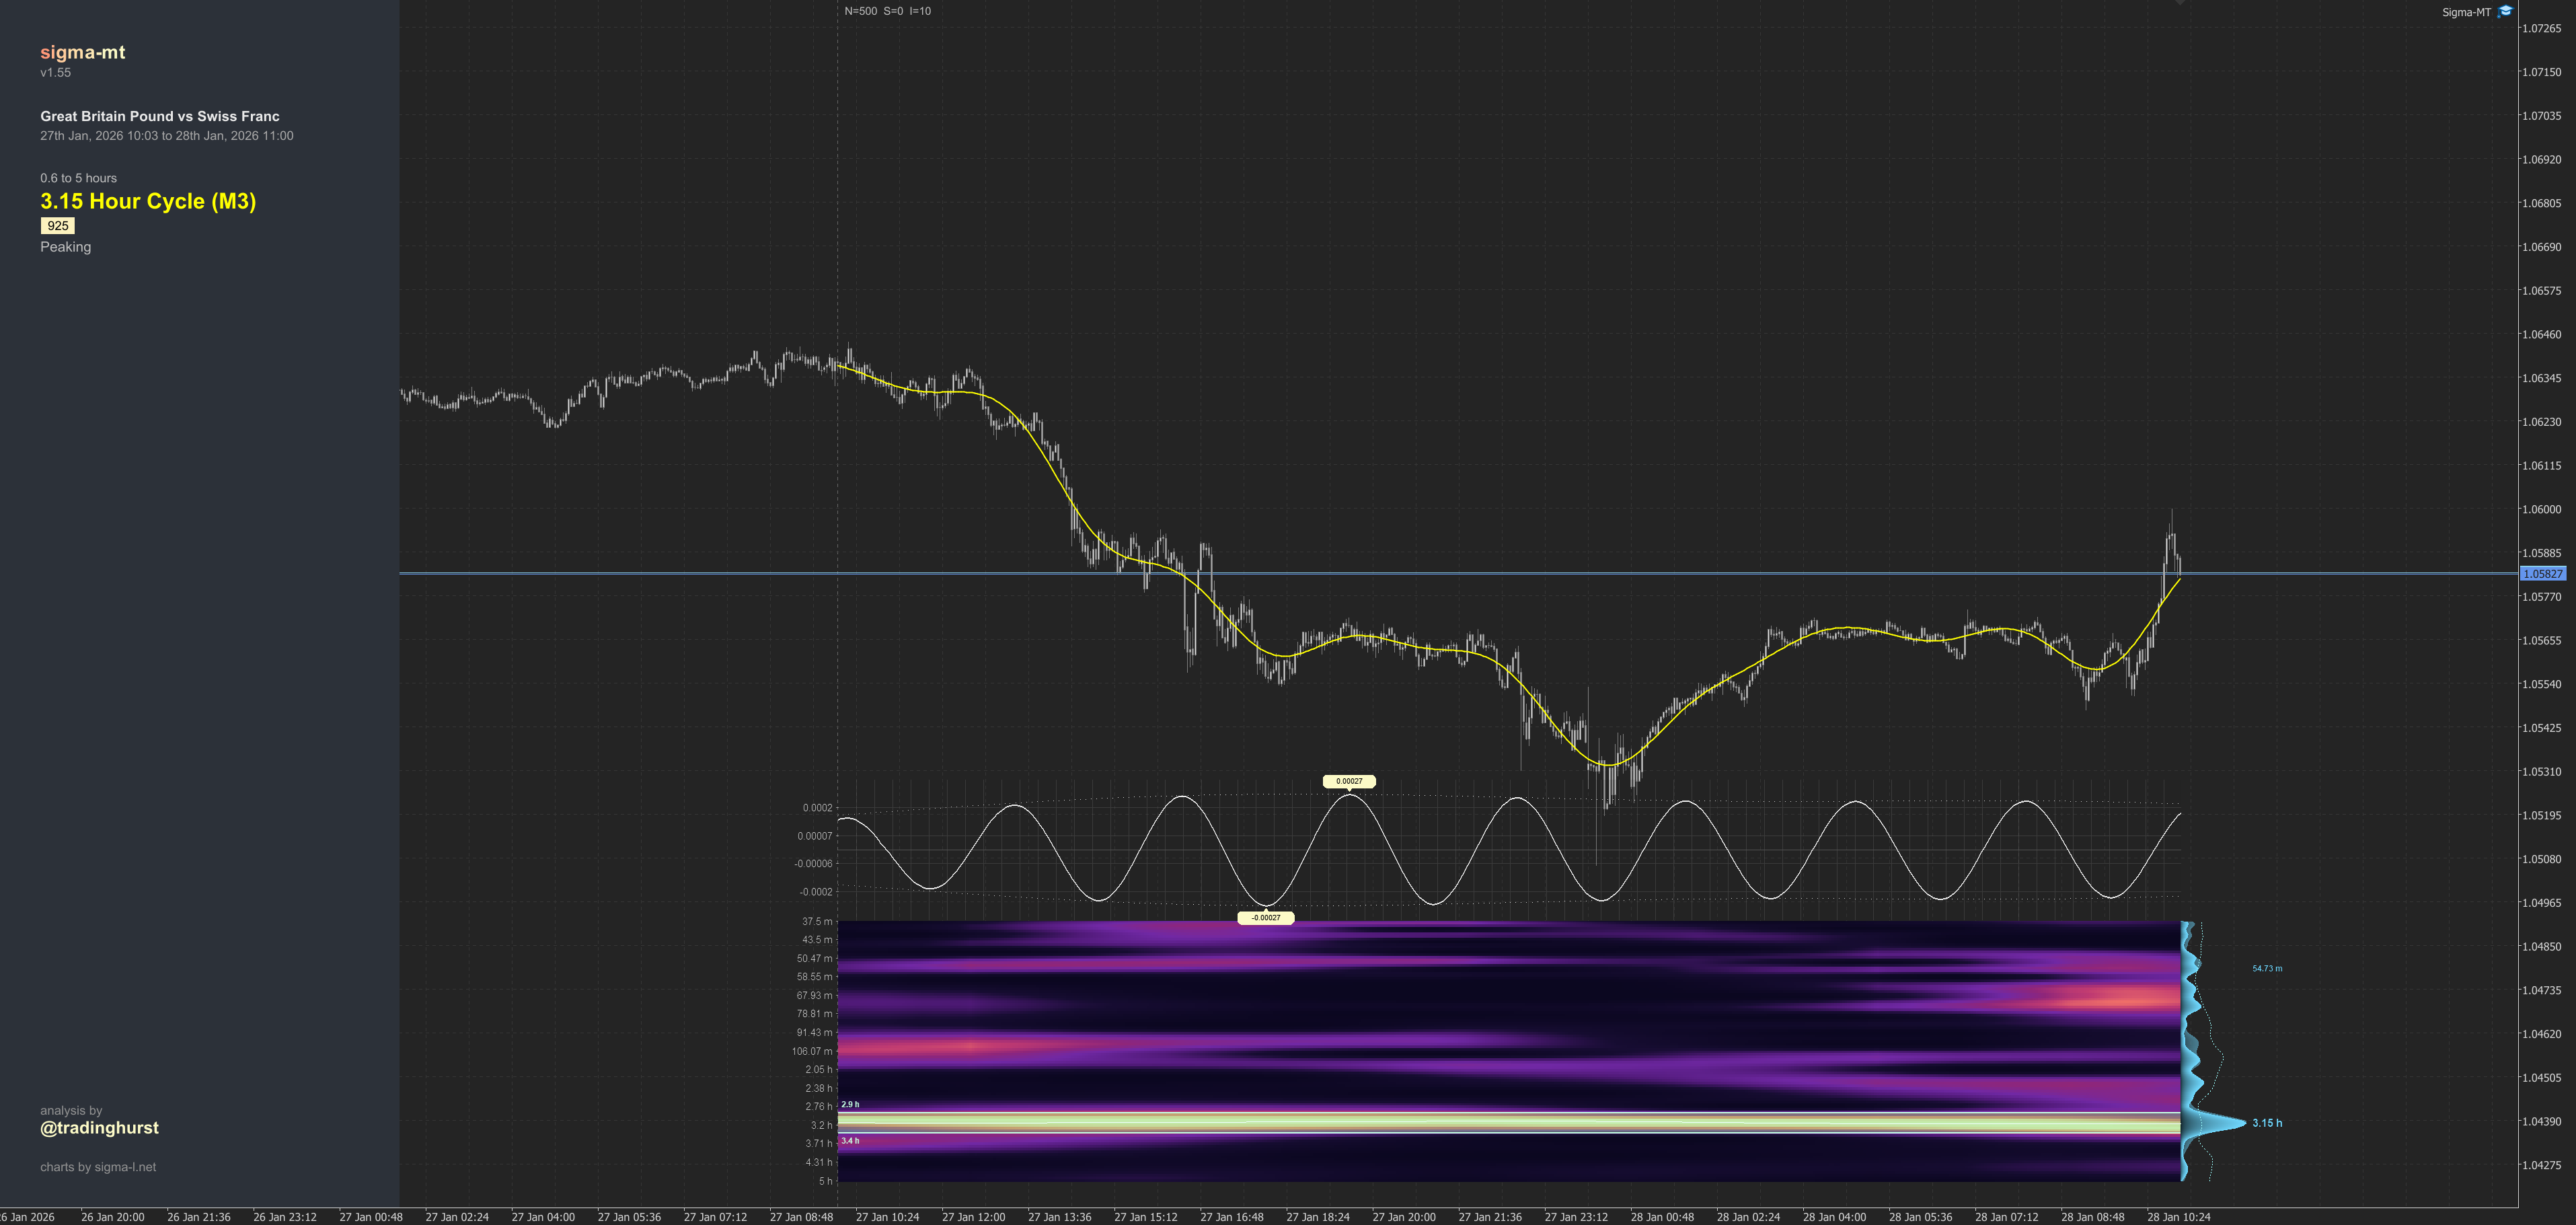
The multi-timeframe analysis system performs independent wavelet convolutions for each enabled timeframe - short, medium, and long-term. Each process transforms the price series into the frequency domain, applies a rapid convolution process and returns a time-frequency power matrix showing how spectral energy evolves across the analysis window.
When analysing higher timeframes, the system retrieves the appropriate bar data, performs the full convolution at that resolution, then interpolates the resulting bandpass signal back to the chart timeframe for overlay. This interpolation maps the higher timeframe’s filtered output onto the short-term bar structure, accounting for the timeframe ratio. A cycle detected on H4 while viewing an M15 chart will display correctly aligned with the underlying price bars.
Dominant cycle detection begins by using CFAR (Constant False Alarm Rate) as the default method - the same adaptive thresholding technique used in radar systems. Rather than applying a fixed SNR threshold across all frequencies, CFAR calculates a local threshold for each frequency bin based on the surrounding spectral energy. Reference cells on either side of each bin establish the local noise floor, with guard cells preventing the signal itself from contaminating the estimate. The detection threshold adapts to the spectral shape, maintaining consistent false alarm probability regardless of whether you’re examining a flat spectrum or one with significant slope.
The ranking score combines multiple metrics: peak prominence above the CFAR threshold, spectral isolation from neighbouring frequencies, amplitude stability across the recency window, and consistency of the instantaneous frequency estimate. A high score indicates a cycle that stands clearly above the noise, maintains stable characteristics, and persists through the analysis period rather than appearing transiently.
Wavelength display throughout the interface now uses adaptive unit conversion. The base unit is determined by your chart timeframe - minutes for M1-M30, hours for H1-H12, days for daily charts. Values then convert upward when they exceed natural thresholds: minutes to hours beyond 120, hours to days beyond 24, days to weeks beyond 100. This ensures the Y-axis labels, information panel, and cycle readouts all express wavelengths in immediately meaningful terms.
Workflow with Sister Scanner App
Sigma-MT and the Sigma-MT Scanner serve different analytical needs within the same workflow.
The scanner processes your entire market watch, applying the same wavelet convolution engine across every instrument and ranking results by cycle strength. It answers the question of where to focus attention. Which markets are exhibiting periodicity now?
Sigma-MT provides the detailed examination. The full spectrogram reveals how cycle strength evolves through time, the bandpass filter isolates the dominant component and the information panel displays phase status, wavelength, and detection score. A cycle flagged by the scanner will appear with identical characteristics when examined in Sigma-MT - the underlying detection will be consistent across both tools.
Keyboard Configuration
So far we have added some very useful keyboard shortcuts to help the user navigate the spectra in an analysis.
Analysis Window:
A / D - Shift analysis left/right through price history
W / S - Increase/decrease sample size (N)
Q / E - Decrease/increase increment value
Ctrl + Click - Centre analysis on clicked bar
Frequency Bounds:
L / O - Decrease/increase lowest frequency of analysis
I / H - Increase/decrease highest frequency of analysis
Display:
F - Flip spectrogram/bandpass to top or bottom of chart
P - Toggle information panel
Left click on spectrogram - show spectral summation and detection threshold at the clicked timepoint
< / > - Increase/decrease panel width
Cycles:
1 / 2 / 3 - Toggle short/medium/long-term cycle visibility
4 - Toggle composite cycle overlay
Availability
Sigma-MT remains available to a small group of founding members for testing and I thank them for their help. As we approach a stable release, it will also be listed on the Meta-Trader market for all, in addition to being available for all new founding members of Sigma-L at release.
More updates to follow and exciting features to add, not least extrapolation, which everyone seems to love!
David