

Tesla Inc. (TSLA) - 20th July 2023 | @ 156 Days
'C' class signal detected in Tesla Inc. (TSLA). Running at an average wavelength of 156 days over 8 iterations since March 2020. Currently peaking.

Instrument Summary
Tesla Inc. (TSLA) is an innovative electric vehicle (EV) and clean energy company, pioneering sustainable transportation and energy solutions. As a significant player in the EV market, Tesla designs, manufactures, and sells electric cars, solar energy products, and energy storage systems. Its revolutionary products, led by visionary entrepreneur Elon Musk, have reshaped the automotive industry and driven advancements in renewable energy technology.
Current Signal Status
Defining characteristics of the component detected over the sample period.
Detected Signal Class: B - learn more
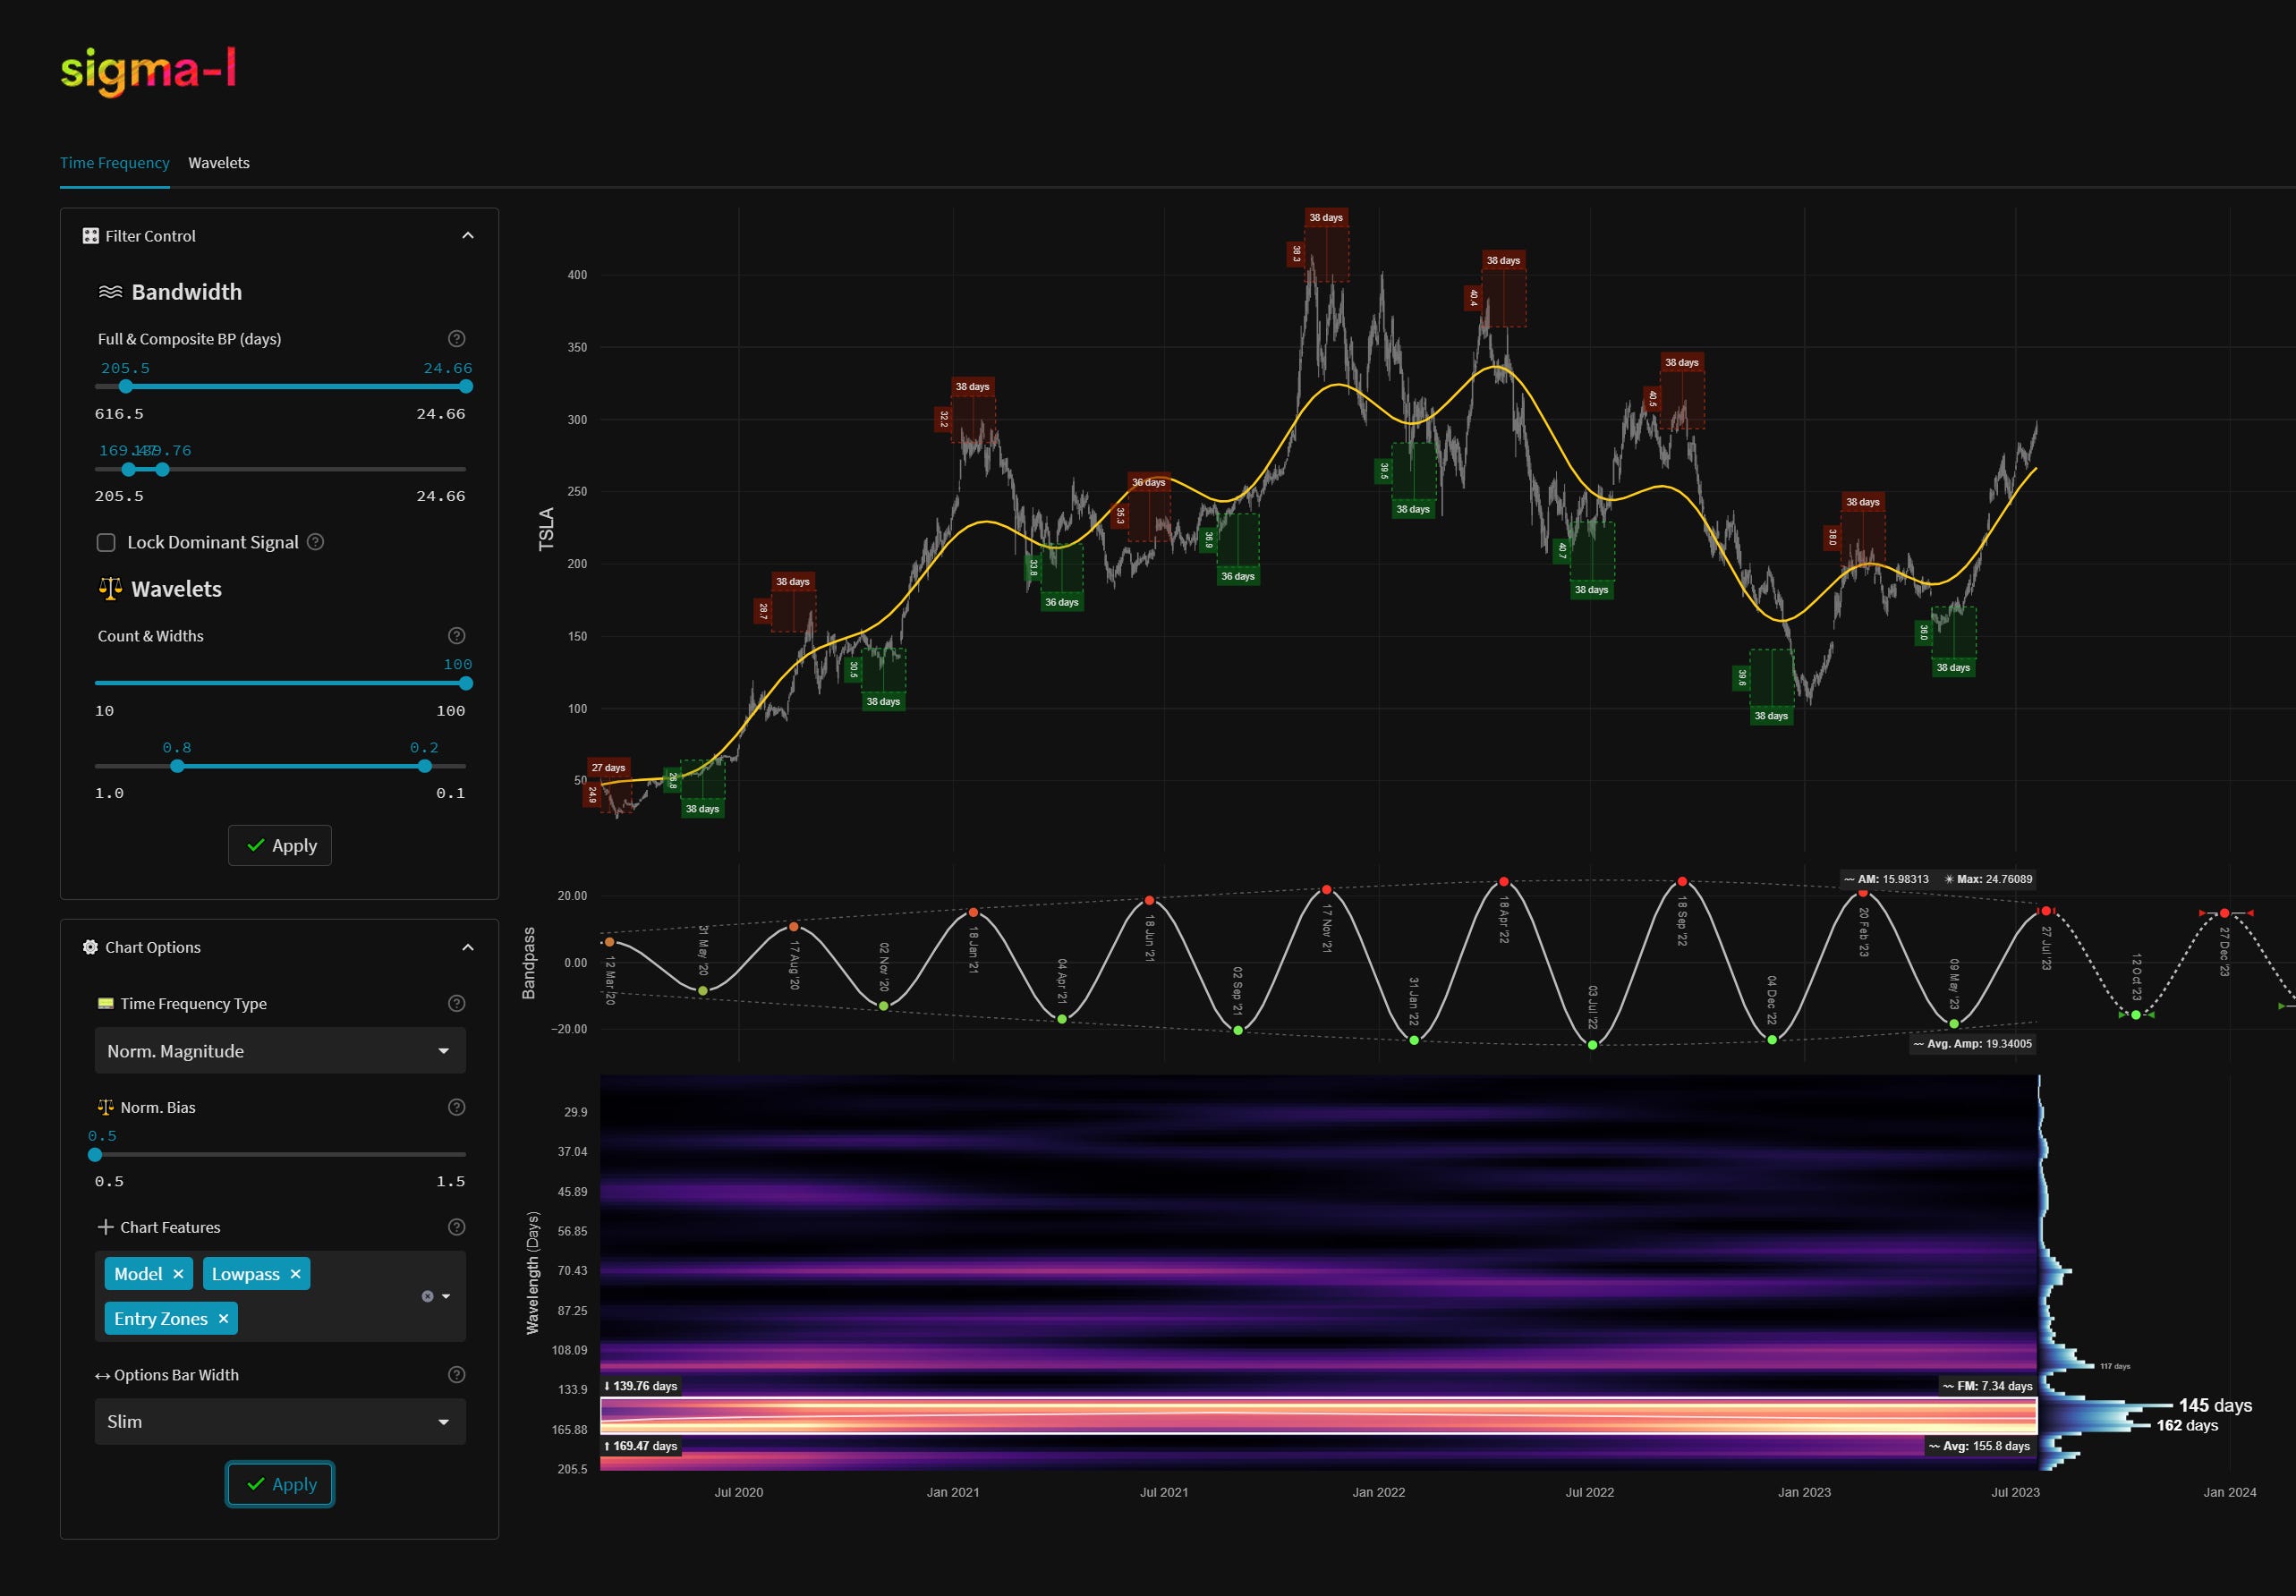
Average Wavelength: 155.8 Days
Completed Iterations: 8
Time Frequency Analysis
Time frequency charts (learn more) below will typically show the cycle of interest against price, the bandpass output alone and the bandwidth of the component in the time frequency heatmap, framed in white. If a second chart is displayed it will usually show highpassed price with the extracted signal overlaid for visual clarity.

Current Signal Detail & Targets
Here we give more detail on the signal relative to speculative price, given the detected attributes of the component. In most cases the time target to hold a trade for is more important, given we focus on cycles in financial markets. Forthcoming trough and peak ranges are based upon the frequency modulation in the sample (learn more).
Phase: Peaking / Peaked
FM: +- 7 Days
AM: 15.98313
Next Trough Range: 5th October - 19th October, 2023
Next Peak Range: 15th December, 2023 - 4th January, 2024
Sigma-L Recommendation: Sell
Time Target: ~ 12th October, 2023
Current Signal Phase
This is ‘how far along’ the cycle is in it’s period at now time and is related to the predicted price action direction.
Current Signal Frequency Modulation (FM)
This is how much, on average, the signal detected varies in frequency (or wavelength) over the whole sample. A lower variance is better and implies better profitability for the component. Frequency usually modulates relatively slowly and over several iterations.
Current Signal Amplitude Modulation (AM)
This is how much the component gains or loses power (price influence) across the sample, on average. Amplitude modulation can happen quite quickly and certainly is more evident than frequency modulation in financial markets. The more stable the modulation the better.