

S&P 500: Hurst Cycles - 12th January 2023
The 20 week component has been amongst the most dominant in the last 12 months. As stock markets approach the next peak of this wave, we will see dominance continue?

Essentials: Nominal Model | FLD | FLD Trading Strategy | FLD Trading Strategy (Advanced) | Principle of Nominality | Underlying Trend | Time Frequency Analysis
Analysis Summary
Stock markets have established their respective 18 month nominal lows, likely in early October and are currently approaching a peak of the 20 week nominal component ,with varying degrees of enthusiasm. The S&P 500 is muted, as are other US markets while European markets surge higher in recent weeks. The disparity in amplitude at the 20 week component is not matched by a similar disparity in frequency, commonality is very apparent.

The peak of this 20 week component is the first chance to see if the longer term phasing, which anticipates a 4.5 year nominal low in late 2023 /early 2024 is correct and is still exerting influence on price action. The area to watch will be around the 54 month FLD, which has formed crisp support for price in recent months (see ST charts below). Both Sentient Trader and our own time frequency analysis suggest a trough of this component in early February. It is highly likely, if the longer term phasing is accurate, the 54 month FLD support will be broken (and target established) within this first 40 week component. The 40 week component is due to trough in June.
Price most likely formed the most recent 80 day nominal low toward the end of December, pushing up meekly when compared to indices such as the FTSE 100 in the United Kingdom. This is slightly later than postulated in our last report and nicely brings the US indices into line with their European counterparts. The 18 month FLD will likely form resistance to price and the 20 week FLD is currently being tracked in the latest move up. A line in the sand for confirmation of the 20 week nominal peak occurring is the 80 day VTL, drawn below on the Sentient Trader charts at the short term.
Phasing Analysis
Sentient Trader
Utilising a pattern recognition algorithm and Hurst’s diamond notation


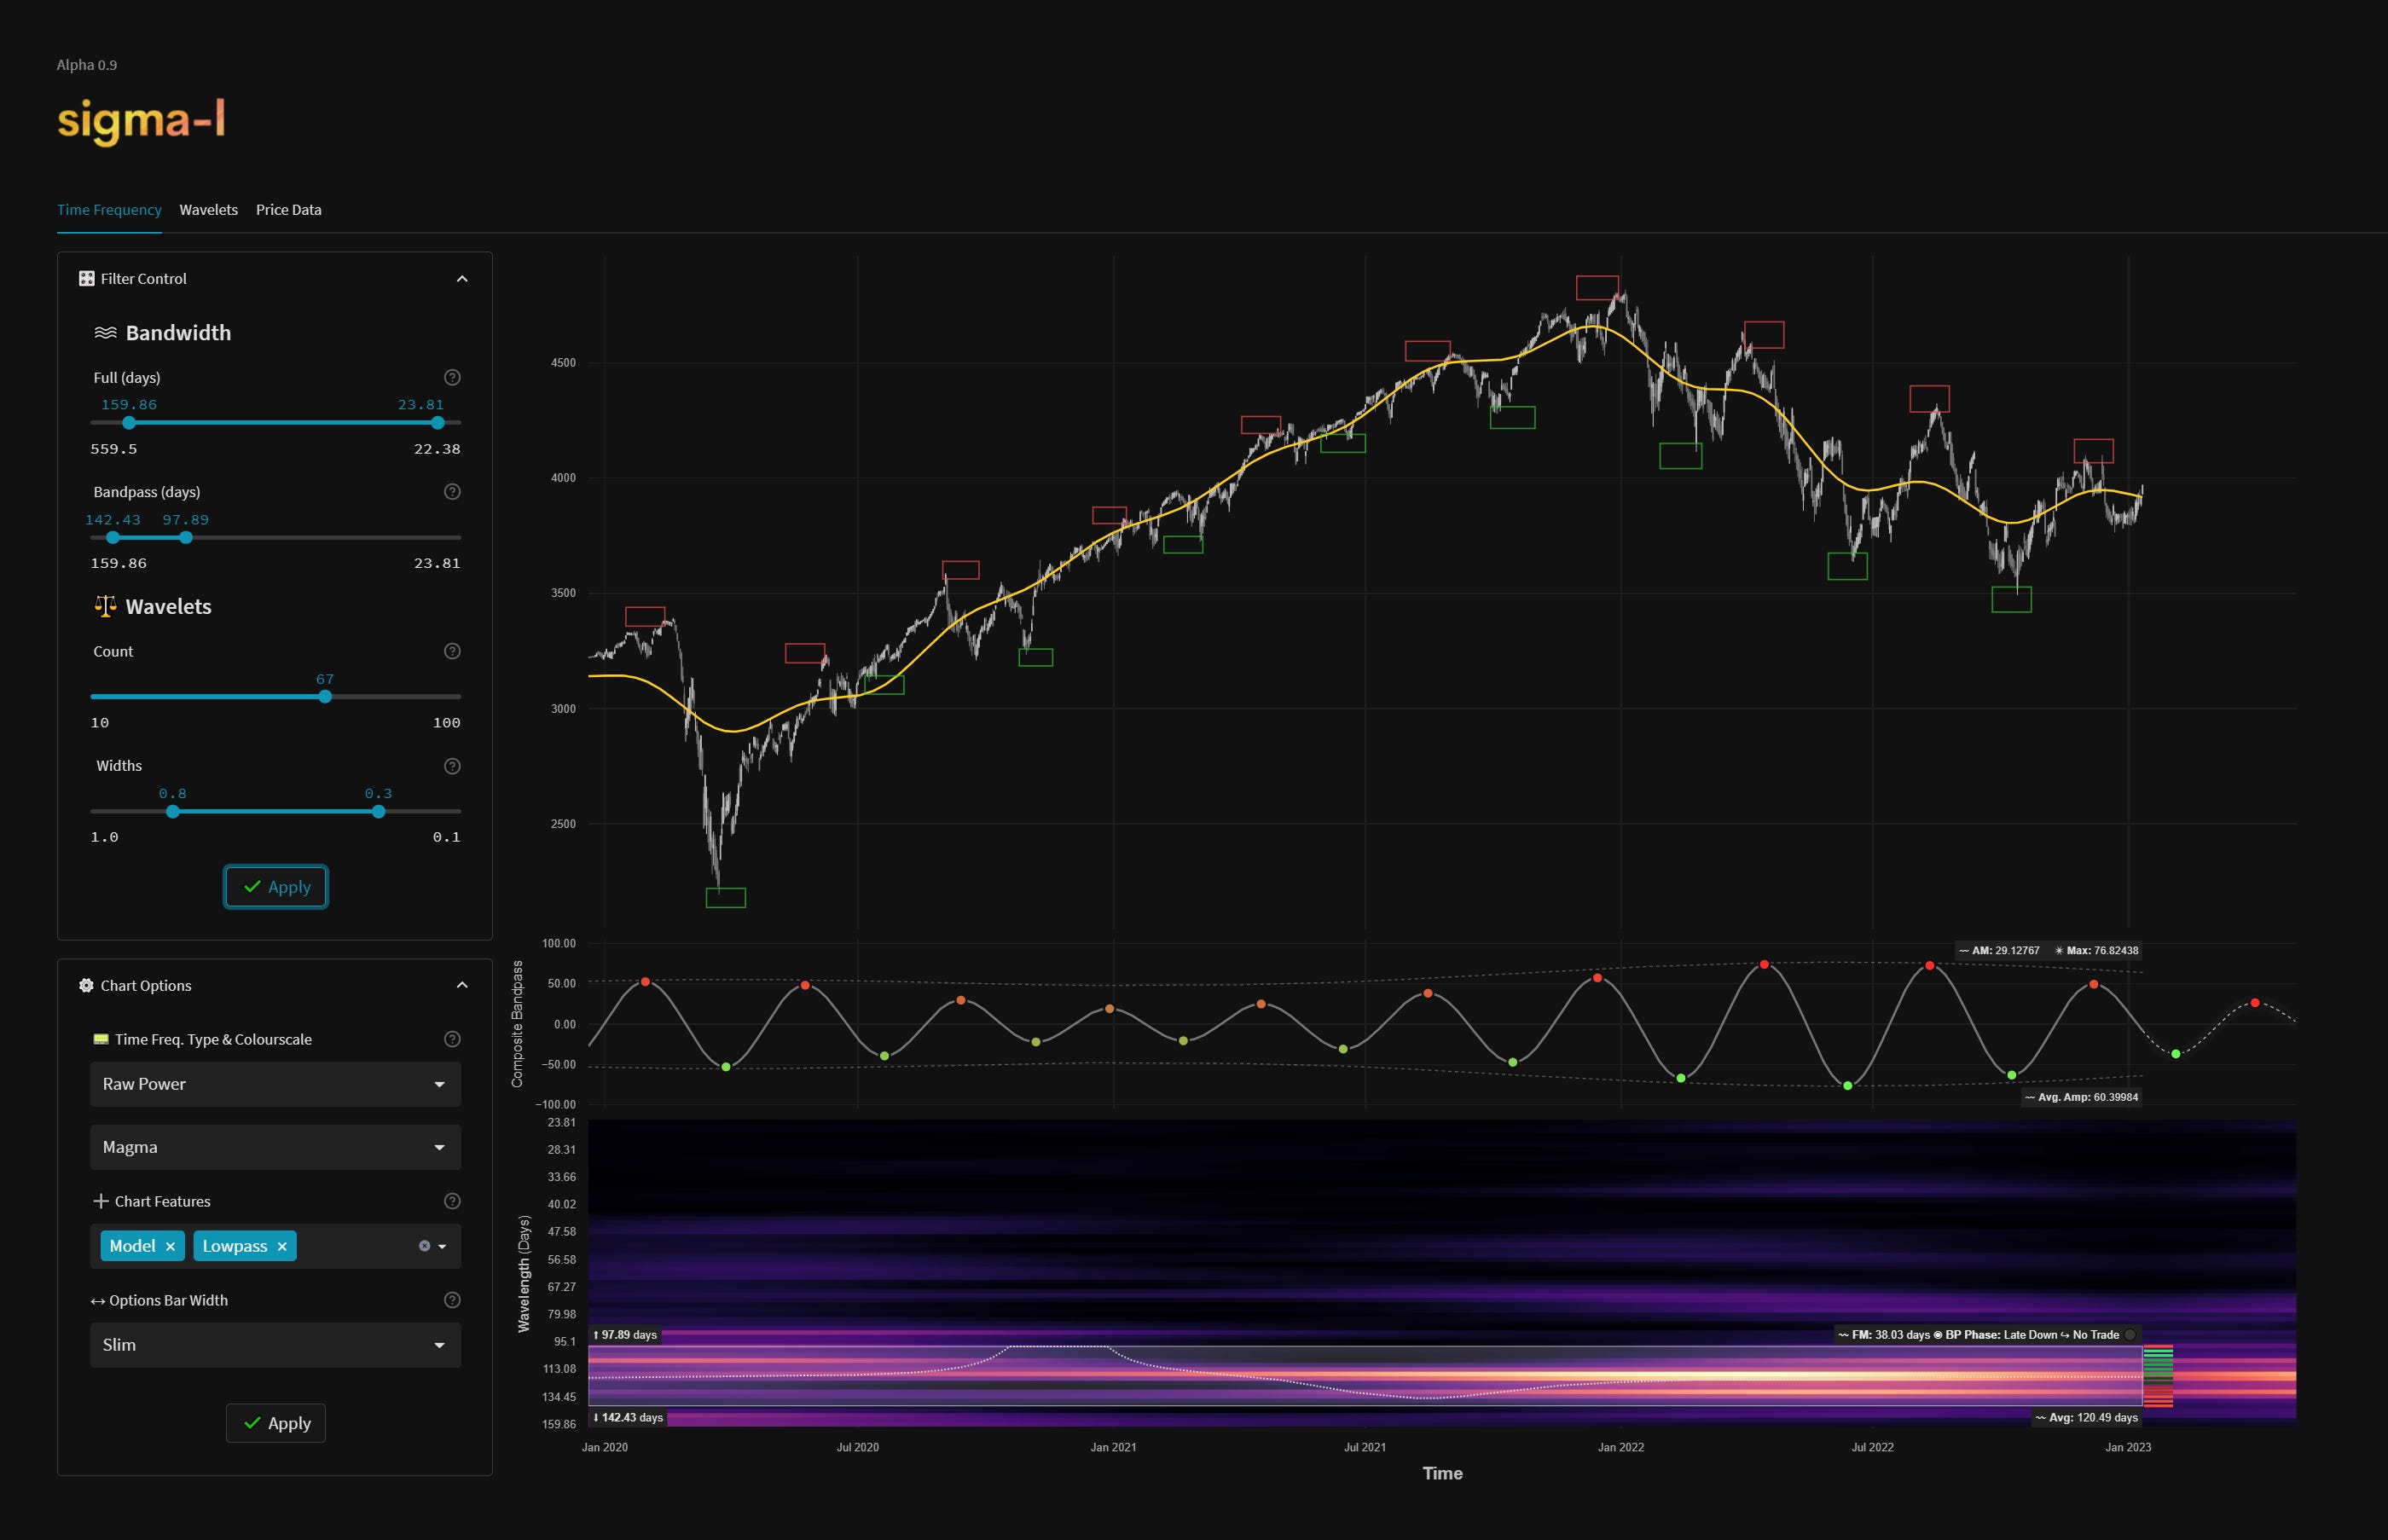
Time Frequency Analysis
Wavelet convolution targeting 20 week, 80 day and 40 day nominal components


Trading Strategy
Interaction Status
Interactions and price in the FLD Trading Strategy (Advanced). This looks at an idealised 40 week cycle and an array of 3 FLD signal cycles. We apply the instrument’s phasing to the model and arrive at an overall summary for the interactions with the 20 day FLD, current and forthcoming.

Sigma-L recommendation: Risk Sell
Entry: 10 day FLD (risk on) / 20 Day FLD
Stop: Above forming 40 day nominal peak
Target: 3800, tracking 20 week FLD, support at 54 month FLD
Reference 20 Day FLD Interaction: D2
Underlying 40 Day FLD Status: F
Underlying 80 Day FLD Status: D
A straightforward opportunity here, price has bullish influence from the recently formed 18 month nominal component so targets are modest around the 54 month support. Should price breach the 54 month FLD on a weekly median price bar basis within this 20 week iteration, due to trough early February, that is a bearish sign and supports the longer term phasing with compelling evidence.
FLD Settings
If you do not have the use of Sentient Trader use these settings to plot common FLDs in your trading software (daily scale) to more easily follow trading signals and strategy from Sigma-L.
Make sure to account for non-trading days if your broker omits them in the data feed (weekends, for example). The below offsets are given with no added calculation for non-trading days.
80 day nominal: 62.7 days | 31 day FLD offset
40 day nominal: 32.3 days | 16 day FLD offset
20 day nominal: 15.7 days | 8 day FLD offset
10 day nominal: 8.8 days | 4 day FLD offset
Correlated Exposure
A non exhaustive list of correlated instruments for consideration
SPDR S&P 500 ETF Trust SPY 0.00%↑
iShares Core S&P 500 ETF IVV 0.00%↑
Vanguard S&P 500 ETF VOO 0.00%↑
SPDR Portfolio S&P 500 ETF SPLG 0.00%↑
Direxion Daily S&P 500 Bull 3X Shares SPXL 0.00%↑
Direxion Daily S&P 500 Bear 3X Shares SPXS 0.00%↑
ProShares UltraPro Short S&P500 SPXU 0.00%↑
ProShares UltraPro S&P500 UPRO 0.00%↑
Great stuff David. It's all coming together nicely thanks to your clear & concise explanations
David, I see 1) the 20w component recently losing amplitude in the last iteration, 2) the 22nd of January peaking cluster having very small amplitude and 3) the expected 20w low that was supposed to happen around these days to be apparently compressed under the pressure of a bigger component pushing from behind. Moreover, 4) we created a higher high after pushing out of the 80day through. I see strong bullish pressure now, till the 40w component peak... Is this interpretation reasonable and consistent with facts and the theory? Thank you. Alessandro