

Silver: Hurst Cycles - 20th January 2023
Silver, in commonality to Gold, moves swiftly from an 18 month nominal low, formed around October 2022. Price now approaches a likely 20 week nominal crest - we look at the latest phasing.

Essentials: Nominal Model | FLD | FLD Trading Strategy | FLD Trading Strategy (Advanced) | Principle of Nominality | Underlying Trend | Time Frequency Analysis
Analysis Summary
Silver has moved with a similar enthusiasm to Gold from the 18 month nominal low we discussed back in November 2022. Much of the analysis below is very similar to our recent report on Gold so please do read that if you have not already.
From 21st November Report:
Price has breached both the 20 and 40 week FLDs, suggesting a low of at least 40 week magnitude has occurred but the next 80 day and 20 week component troughs should seal the deal. If the 18 month component has occurred, we should expect these troughs to form higher lows. These are expected mid December and late January / early February respectively, at current average wavelengths.
What is notable about this analysis of Silver is the suggestion of the a 40 week nominal peak being imminent. There is a lot of bullish sentiment on fintwit around Gold and Silver at the moment. This technical and objective finding is totally at odds with that sentiment. If that is the case the move from this 20 week peak will likely breach the 20 week FLD support, shown on the Sentient Trader charts.
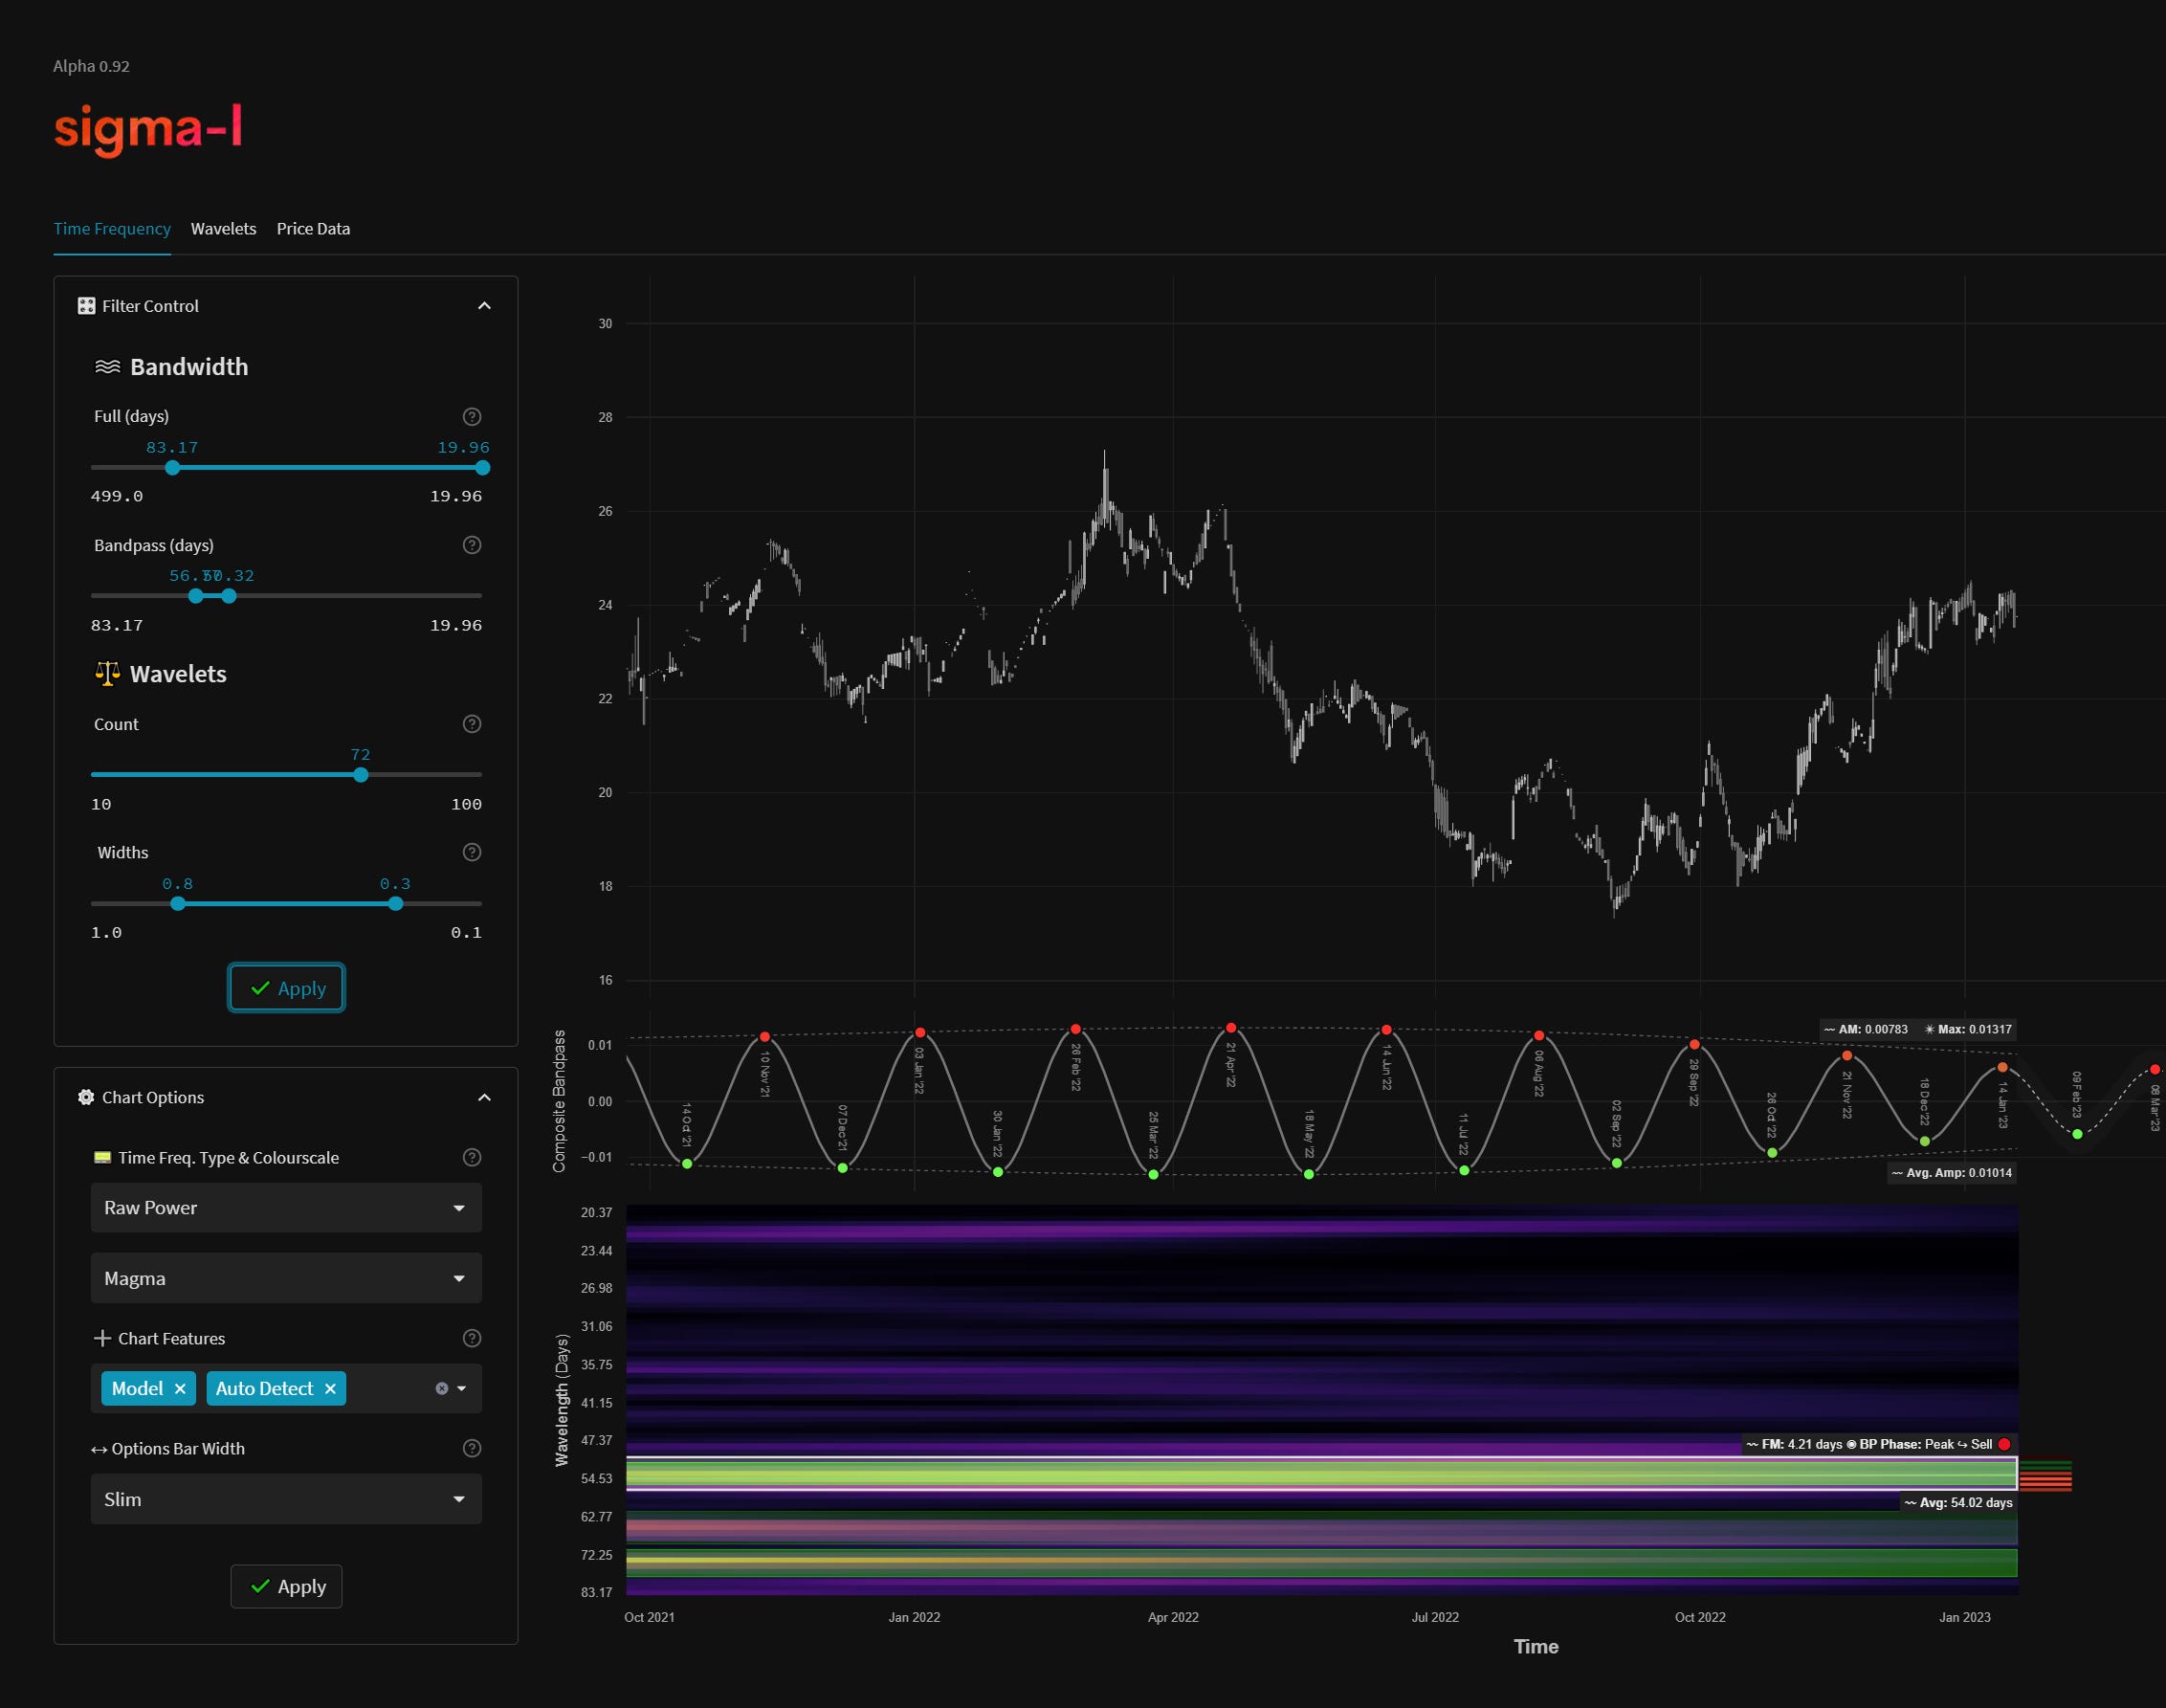
As we highlighted in previous reports, the component around 55 days, which we christened ‘the beacon’ back in mid 2022 due to it’s remarkably stationary properties, is more apparent in Silver (and indeed Platinum). The short term time frequency analysis shows the strength of this component is still in the market, although it has been heavily attenuated in the last two iterations due to the upward influence of the 18 month component.
Phasing Analysis
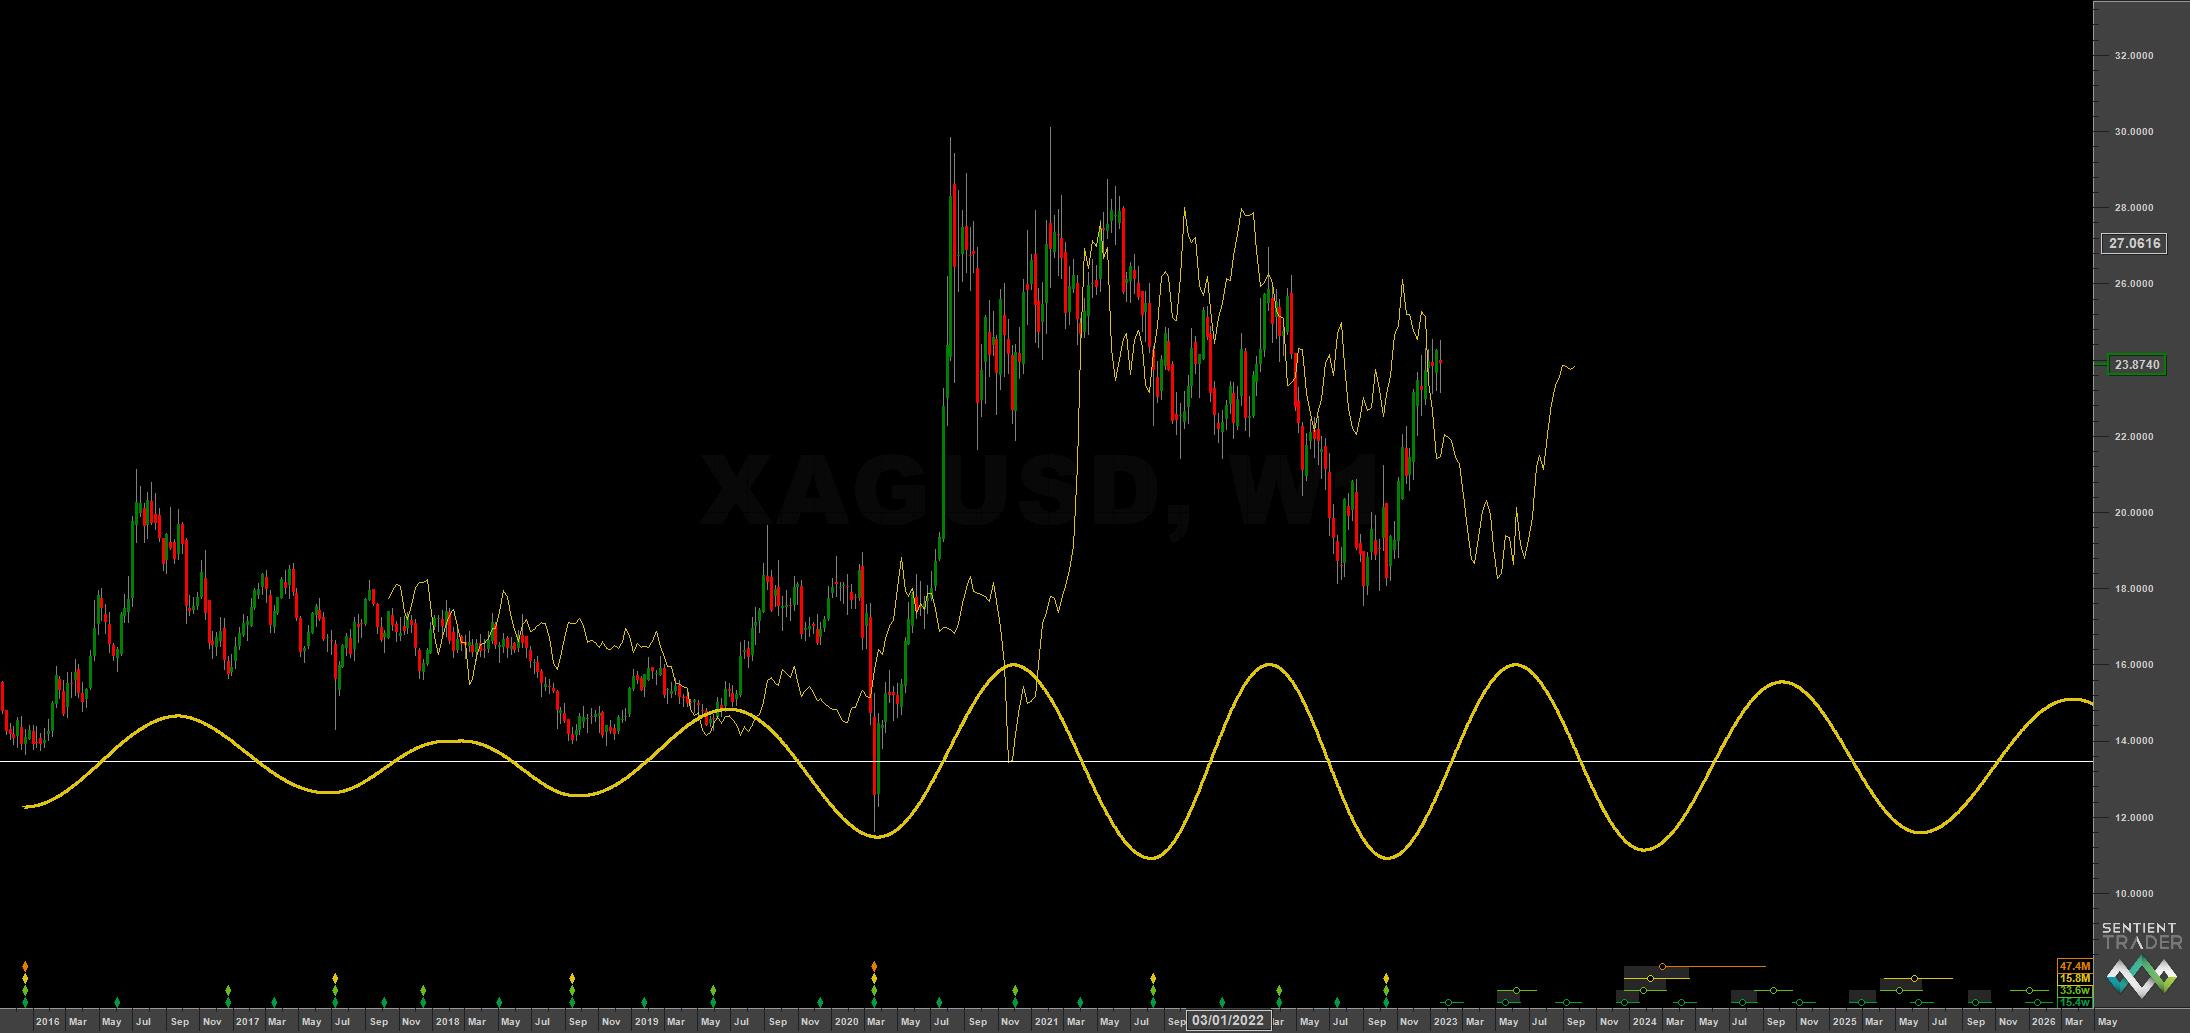
Long Term
Components including and longer than the 18 month nominal wave

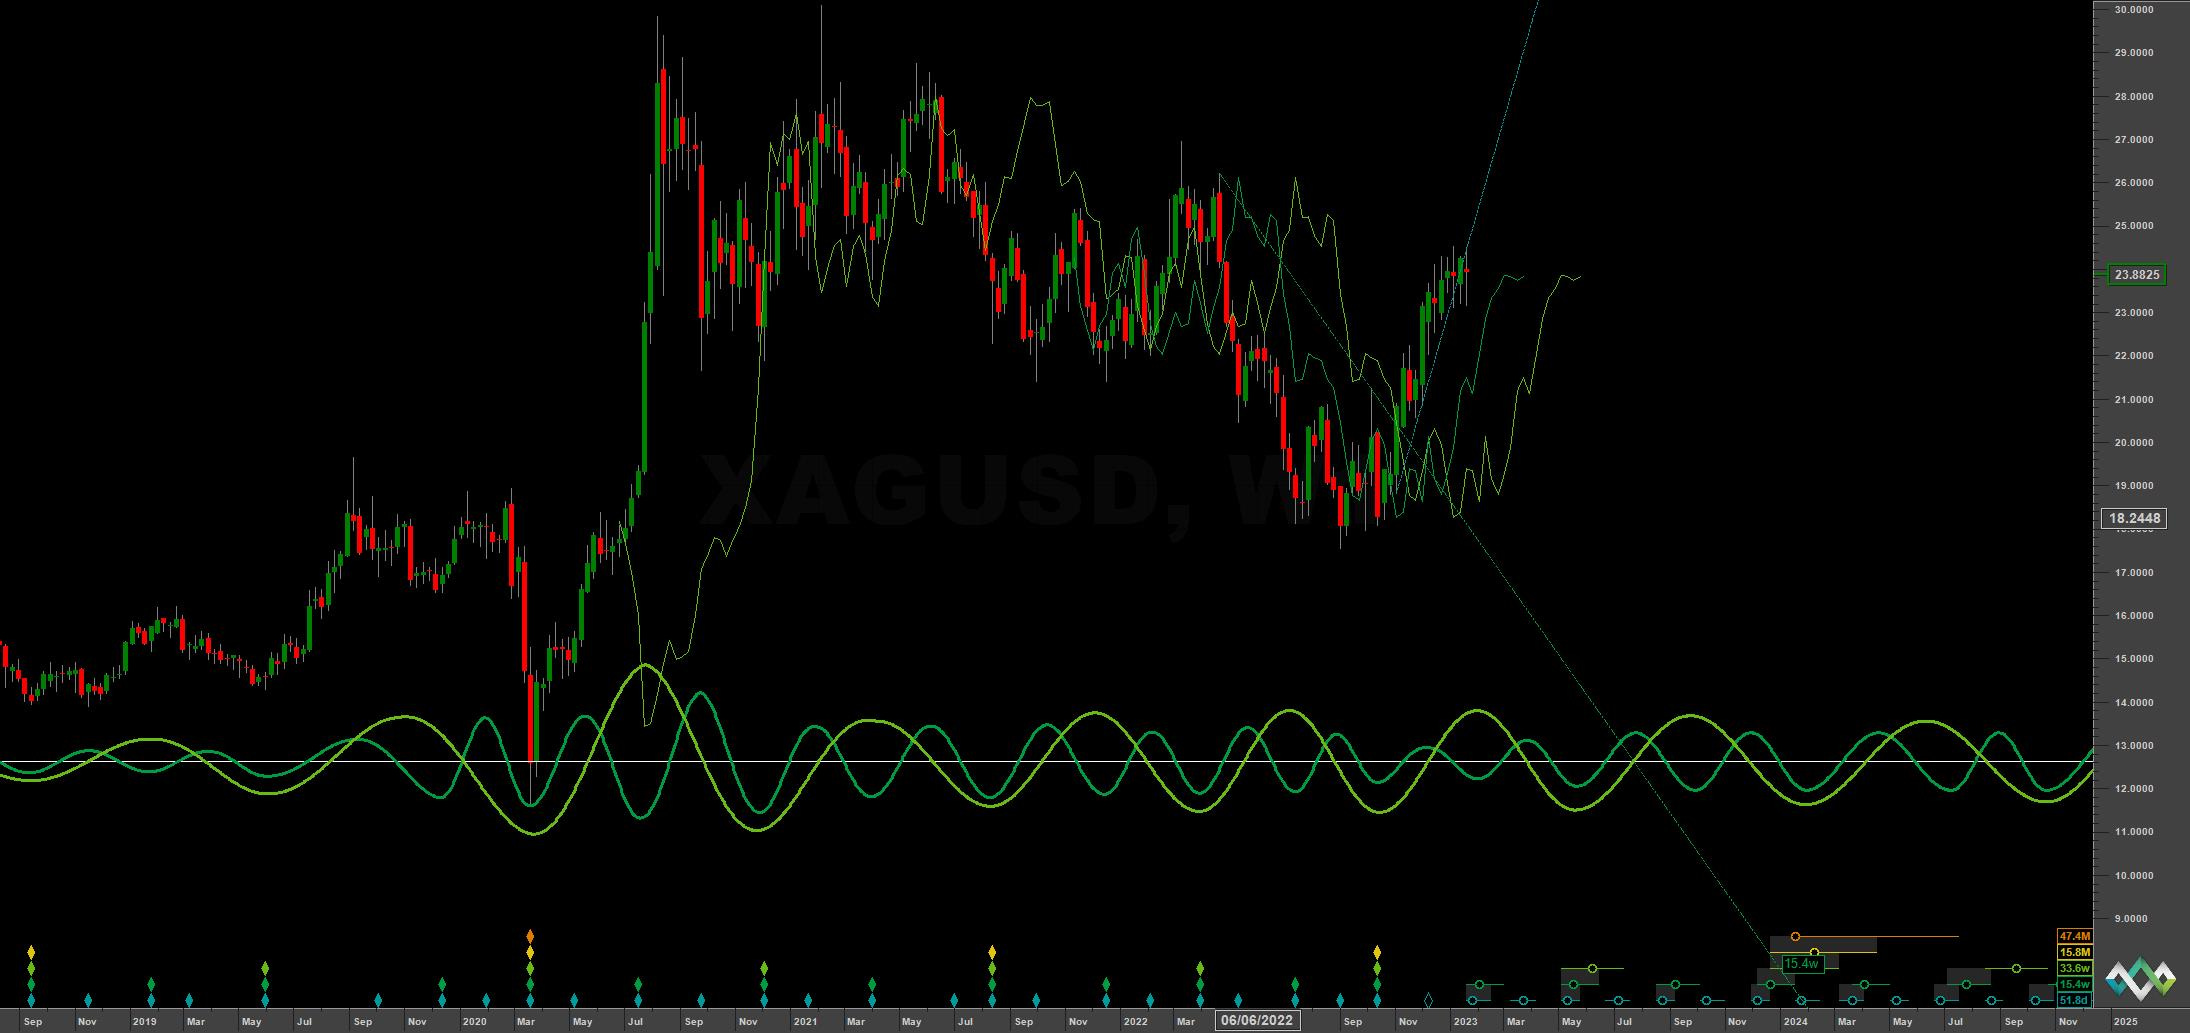
Medium Term
Components between the 20 week to 18 month nominal wave

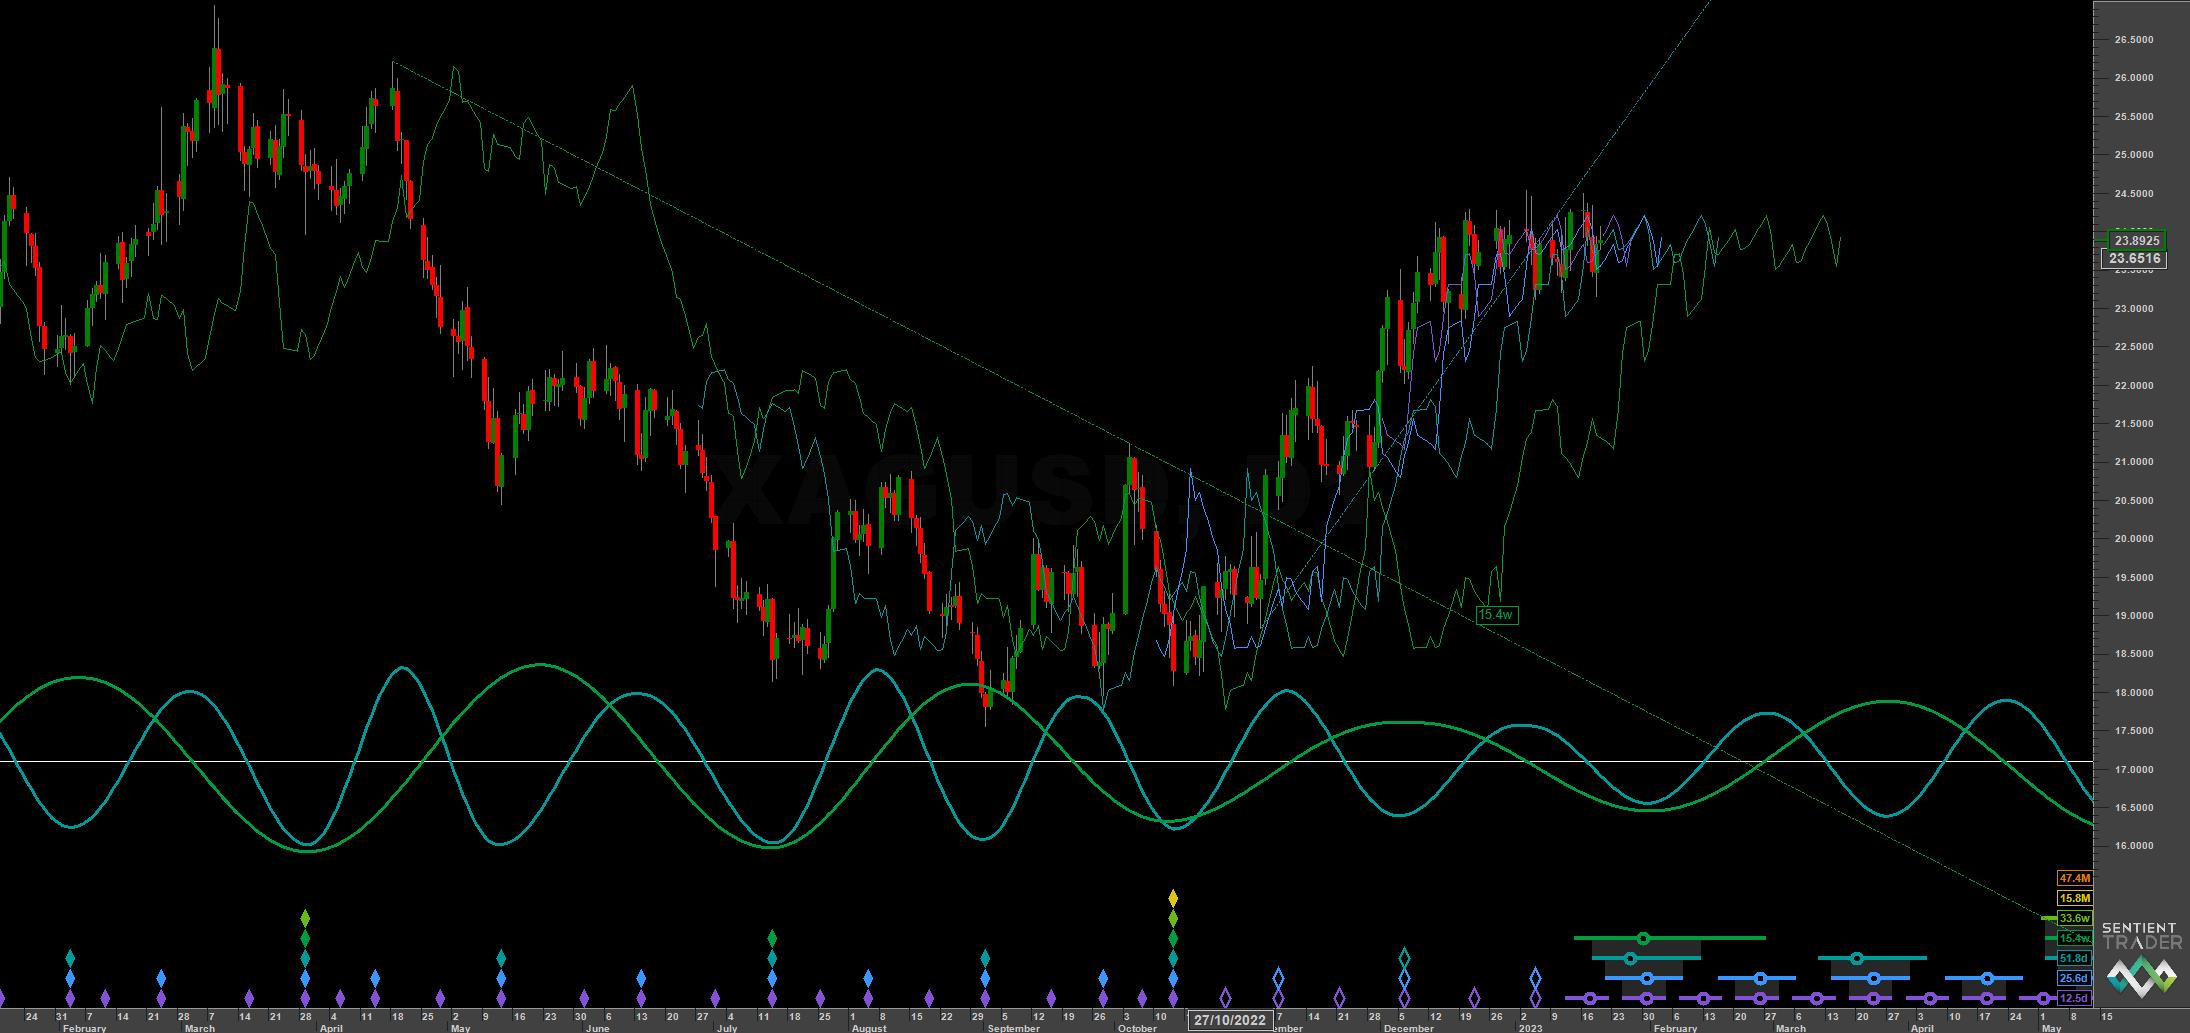
Short Term
Components shorter than the 20 week nominal wave
Trading Strategy
Interaction Status
Interactions and price in the FLD Trading Strategy (Advanced). This looks at an idealised 40 week cycle and an array of 3 FLD signal cycles. We apply the instrument’s phasing to the model and arrive at an overall summary for the interactions with the 20 day FLD, current and forthcoming.

Sigma-L recommendation: Risk Sell
Entry: 10 Day FLD
Stop: Above formed 20 week nominal peak
Target: 20-22.5 (20 week FLD support)
Reference 20 Day FLD Interaction: F2 / H2
Underlying 40 Day FLD Status: G-H
Underlying 80 Day FLD Status: D
Assuming the 20 week component is peaking here a risk sell is a possible trade. Bullish traders may wish to wait for a potentially more profitable trade long out of the 20 week nominal low, likely at the 20 week FLD support around 22.5.
Price is currently within several horizontal FLDs at the shorter scale, indicating a pause zone. Silver generally is more volatile at the shorter wavelengths than Gold.
FLD Settings
If you do not have the use of Sentient Trader use these settings to plot common FLDs in your trading software (daily scale) to more easily follow trading signals and strategy from Sigma-L.
Make sure to account for non-trading days if your broker omits them in the data feed (weekends, for example). The below offsets are given with no added calculation for non-trading days.
80 day nominal: 51.8 days | 26 day FLD offset
40 day nominal: 25.6 days | 13 day FLD offset
20 day nominal: 12.5 days | 6 day FLD offset
10 day nominal: 6.2 days | 3 day FLD offset
Correlated Exposure
A non exhaustive list of correlated instruments for consideration
iShares Silver Trust SLV 0.00%↑
Aberdeen Standard Physical Silver Shares ETF SIVR 0.00%↑
ProShares Ultra Silver ETF AGQ 0.00%↑
Invesco DB Silver Fund DBS 0.00%↑
Global X Silver Miners ETF SIL 0.00%↑
ETFMG Prime Junior Silver ETF SILJ 0.00%↑
iShares MSCI Global Silver Miners ETF SLVP 0.00%↑