

S&P 500 - Market Cycles - 28th February 2023
After the 18 month nominal low was established, is price completing a well overdue 20 week nominal trough? The next few months will be crucial for the longer term outlook, we look at the phasing here

Essentials: Nominal Model | FLD | FLD Trading Strategy | FLD Trading Strategy (Advanced) | Principle of Nominality | Underlying Trend | Time Frequency Analysis
Analysis Summary
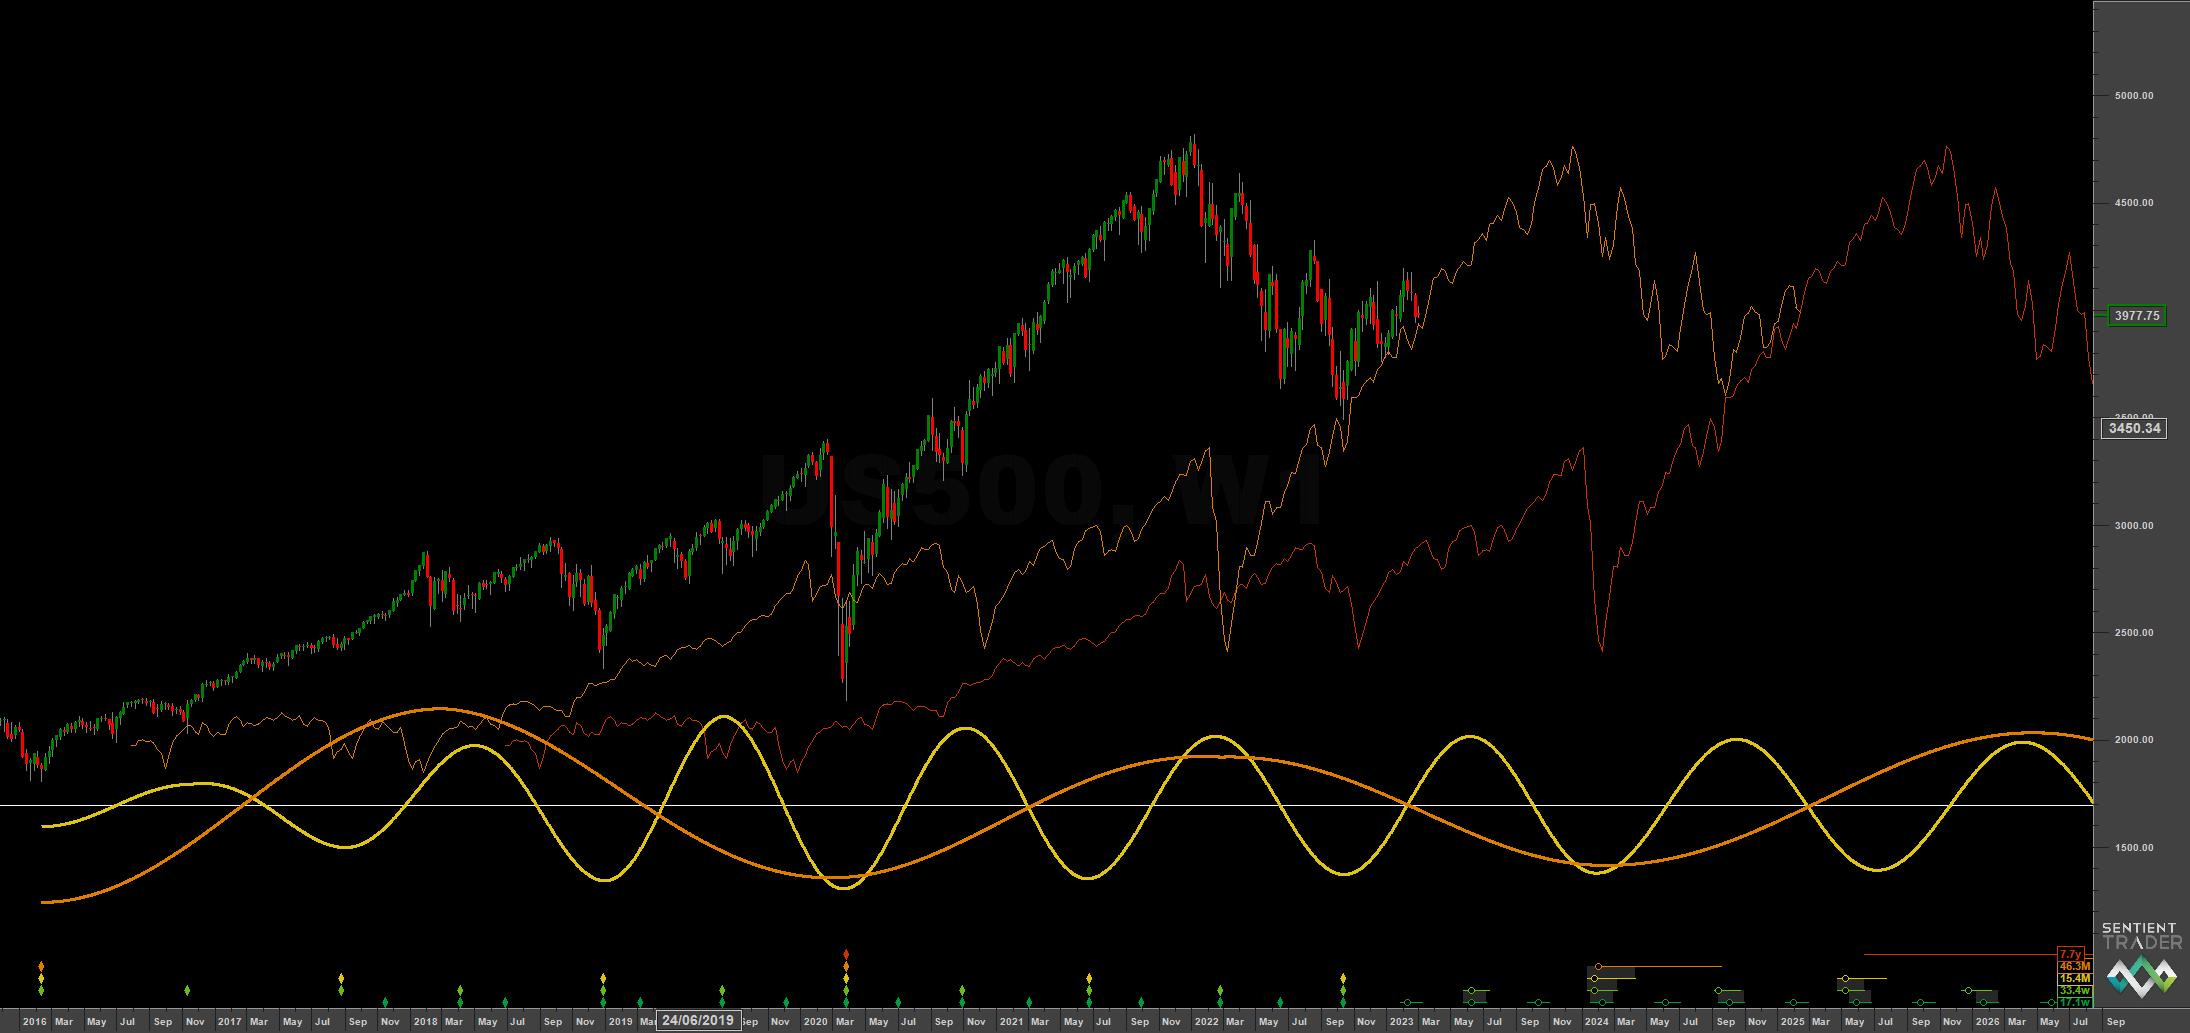
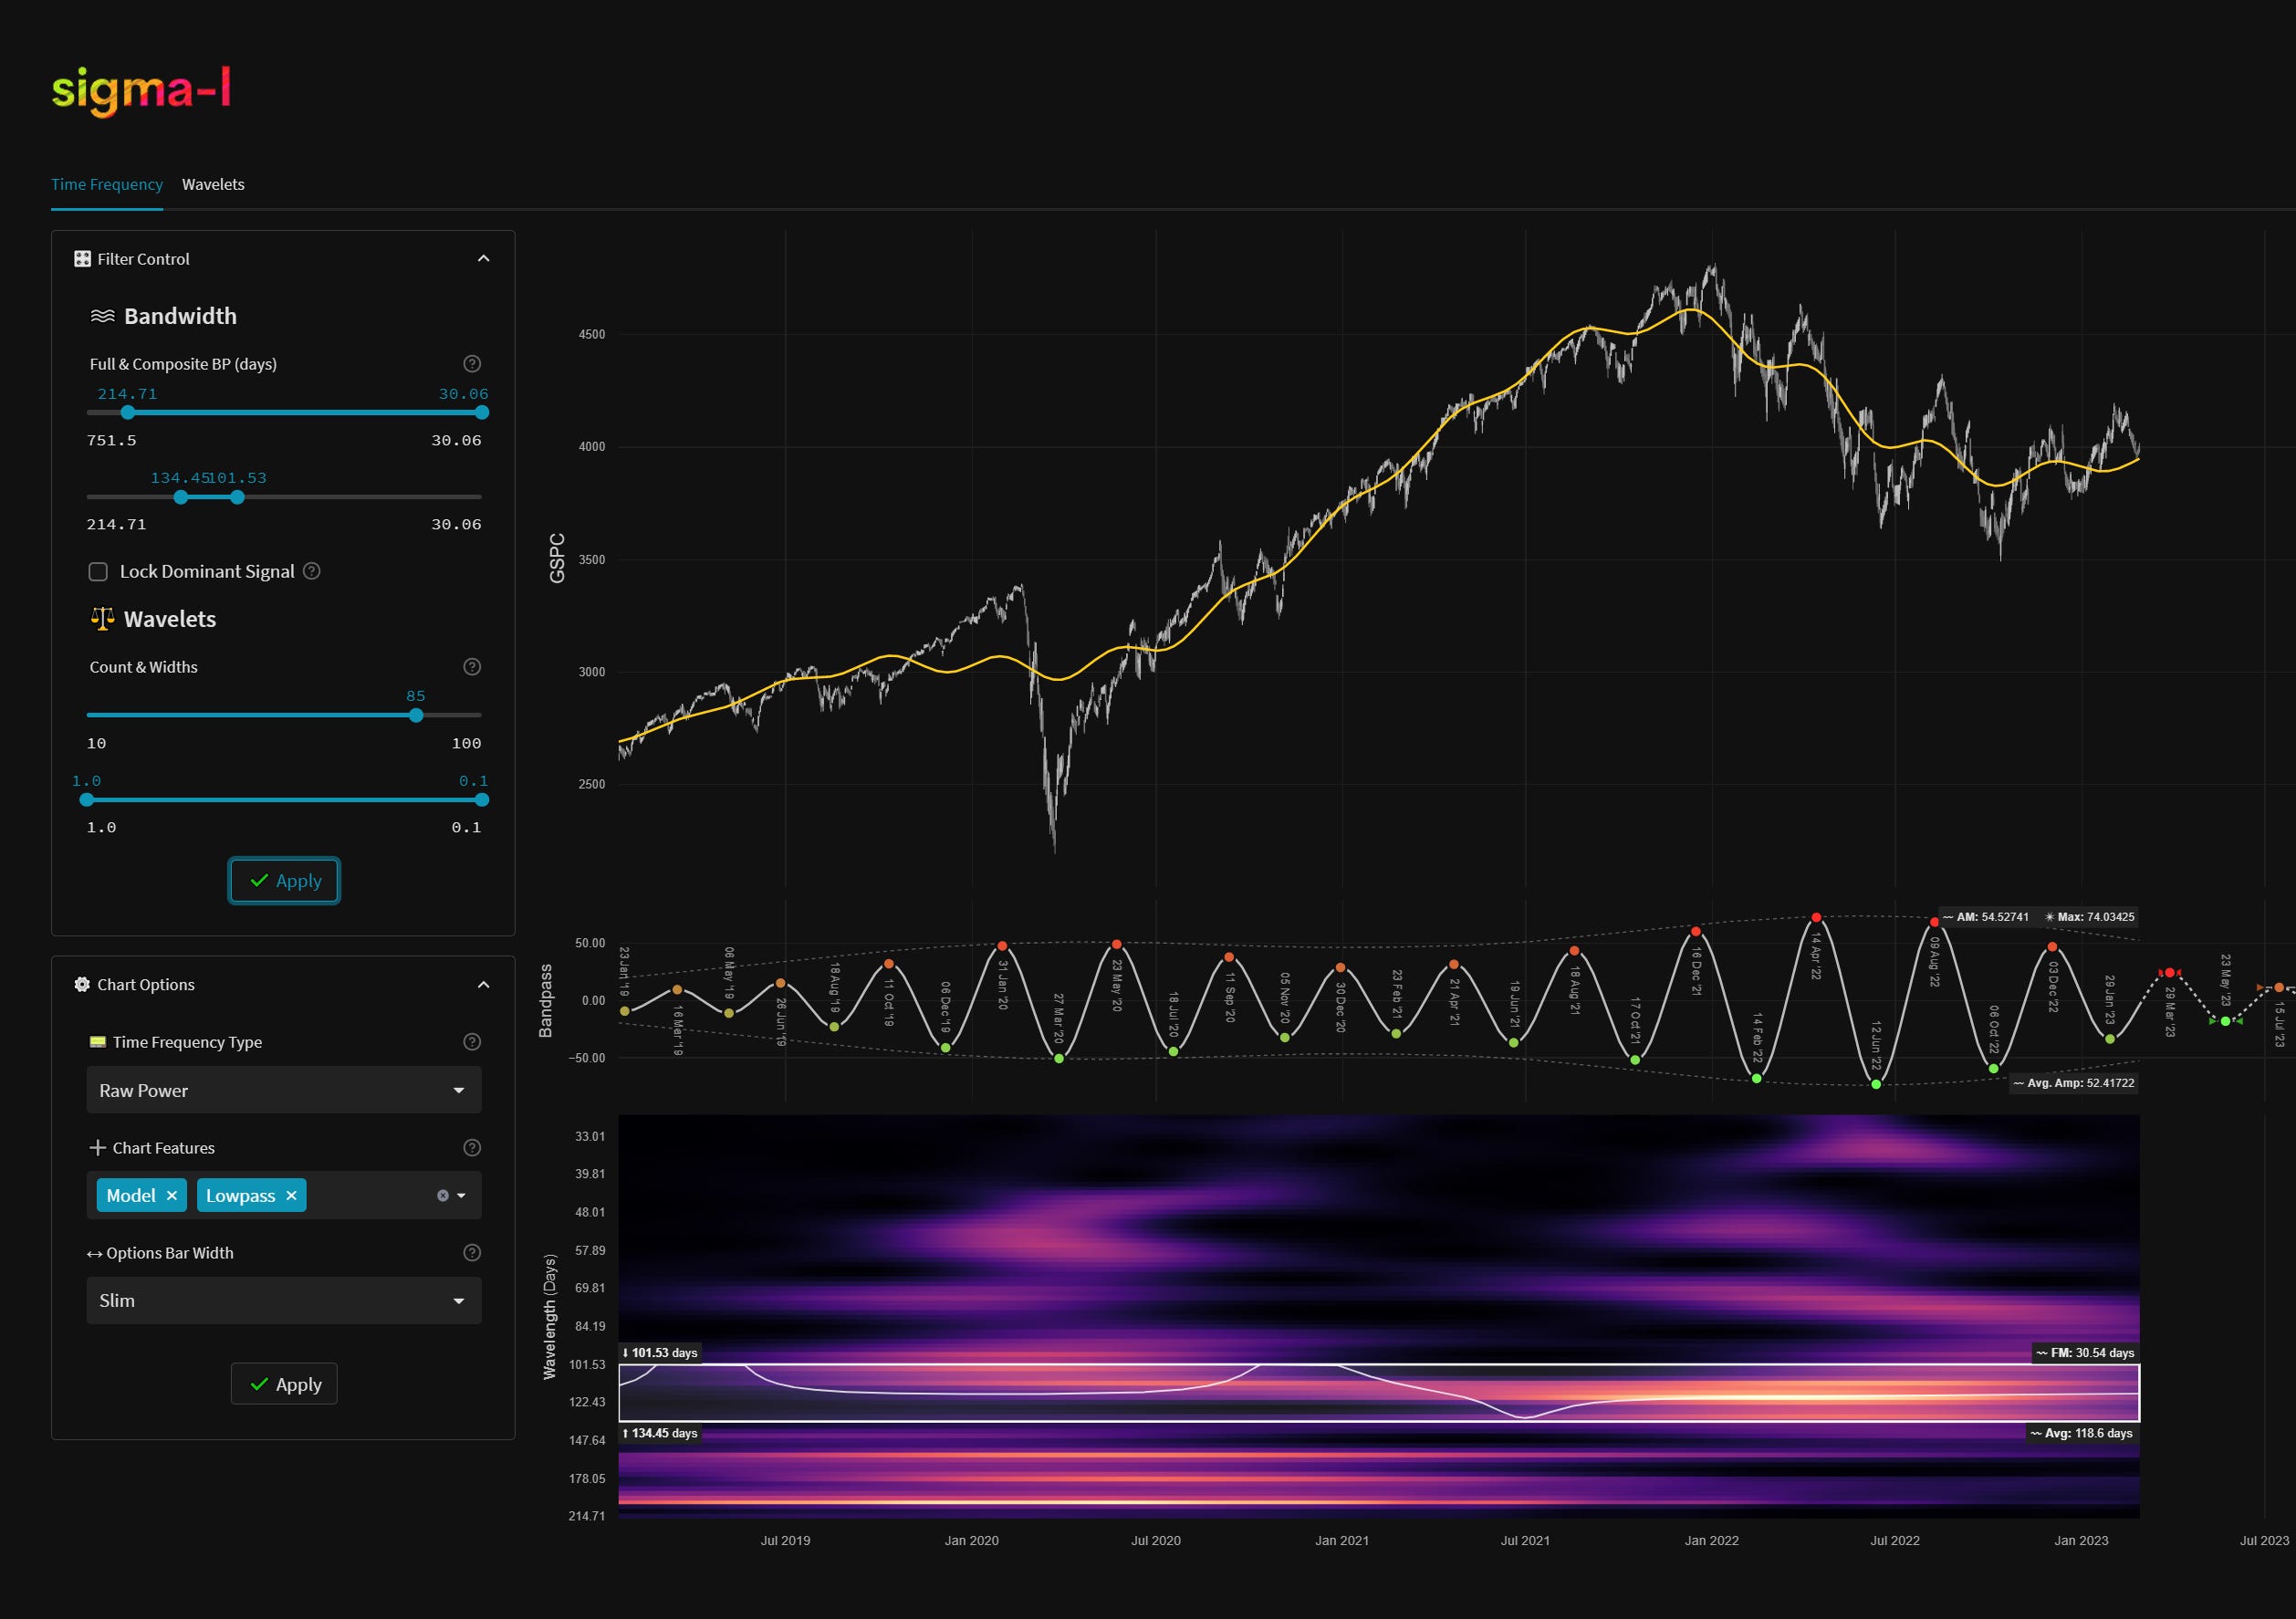
The S&P 500 has continued to lag European indices, tracing out a bullish but lacklustre 20 week component. What is notable about the S&P 500 (and some other global indices) is the excellent support at the 54 month FLD by price over the last few months and out of the 18 month nominal low in October. A support area, such as this, does suggest an accurate longer term phasing, although the surge in the European indices has laid question marks around the 9 year nominal low in 2020. All will be clarified by the summer as the trough of the 40 week component is established, a lower low at that point will precede a collapse, likely to the 9 year FLD. This will also breach the 54 month nominal FLD (shown below on the time frequency analysis) and establish a downside target for those that prefer to trade levels, rather than time. The 54 month FLD has only been breached once since the 2009 lows, at the ‘Covid’ lows in 2020. This is a significant FLD support.
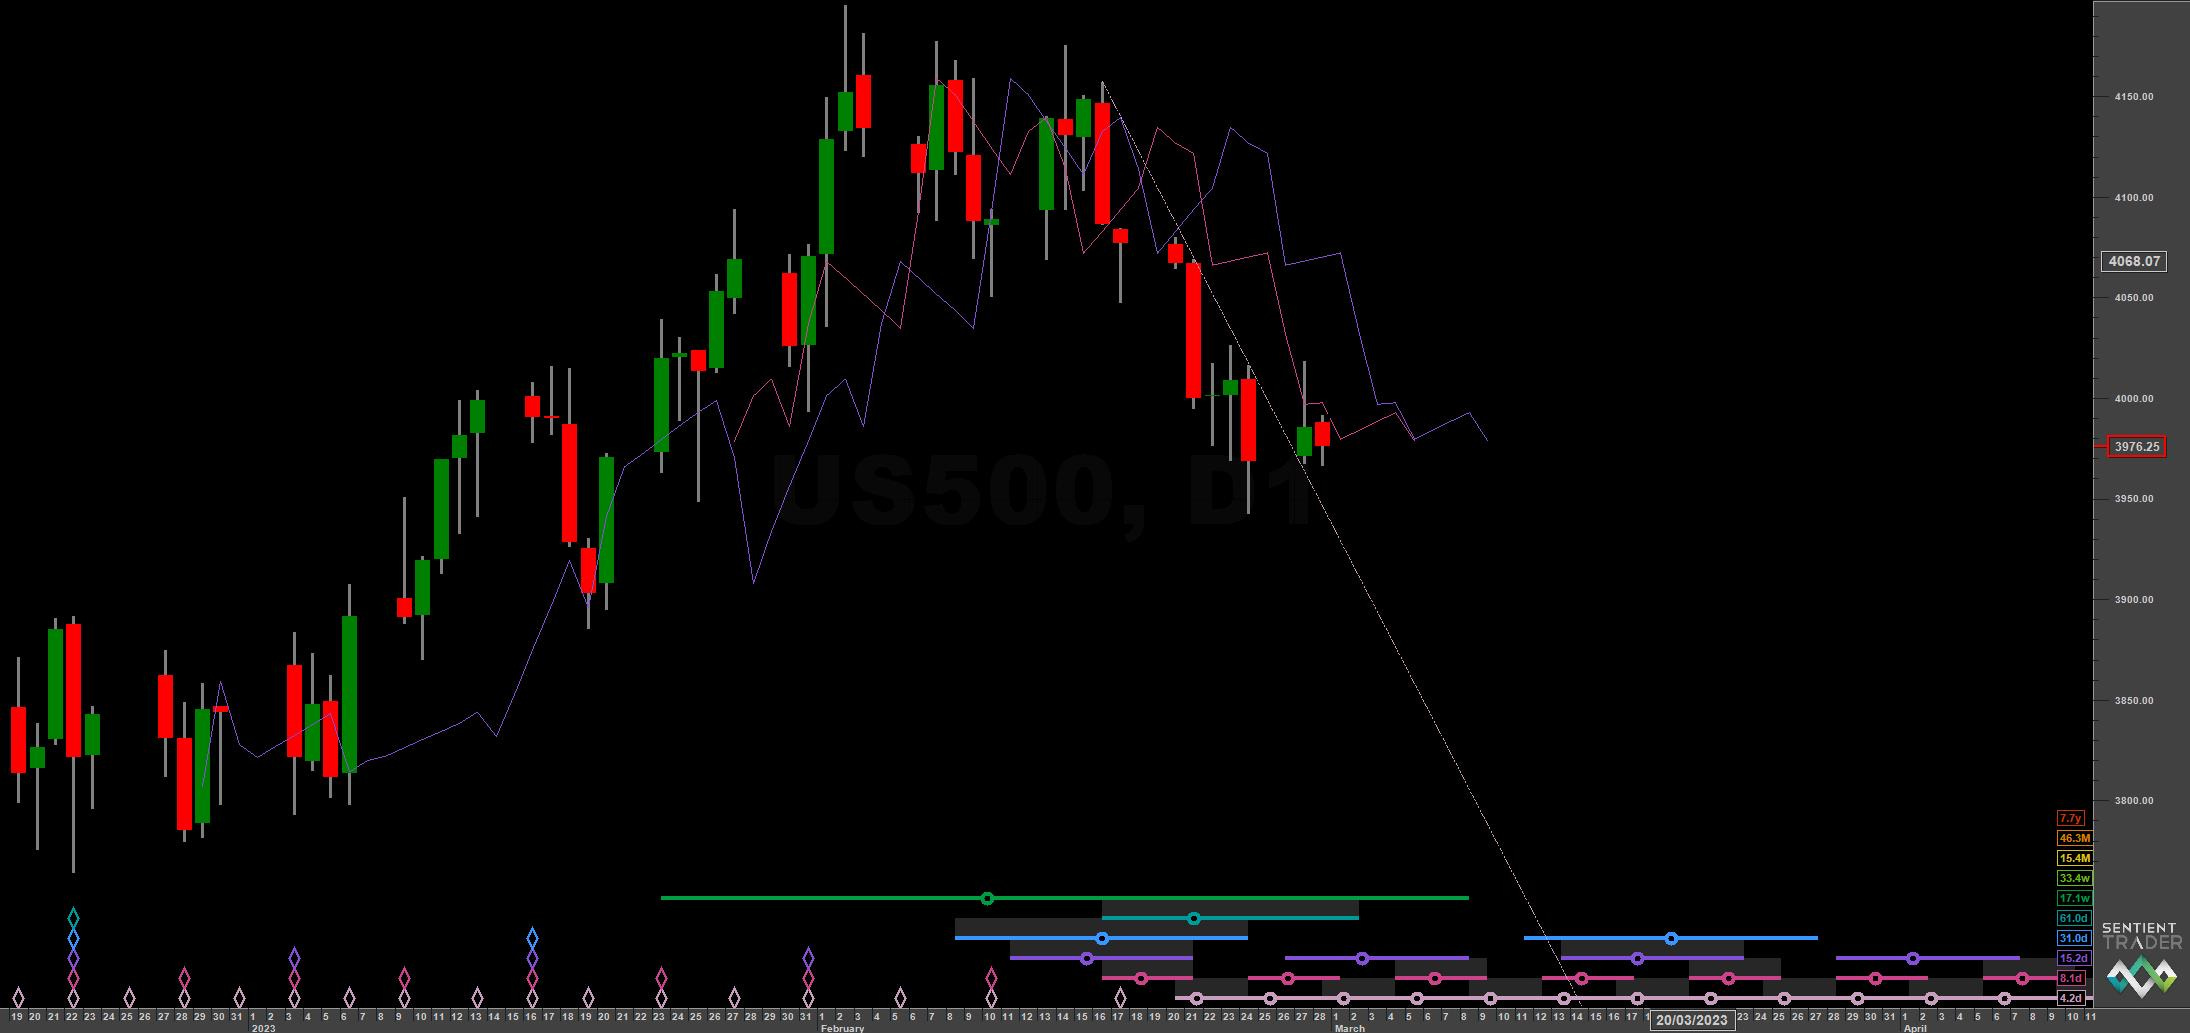
At the medium to short term the 20 week component has been somewhat modulated, the 80 day component has increased in wavelength to around 75 days and is the cause of this modulation. There was mention of this in our last report where we noted the existence of two viable signals fighting for spectral power around the 60-80 day bandwidth. Fortunately for us the 80 day component is dominant recently and is clear on the unbiased time frequency analysis. Lows of both components are due and the latter is at the support of it’s FLD. Price is also near the crucial 54 month FLD support.
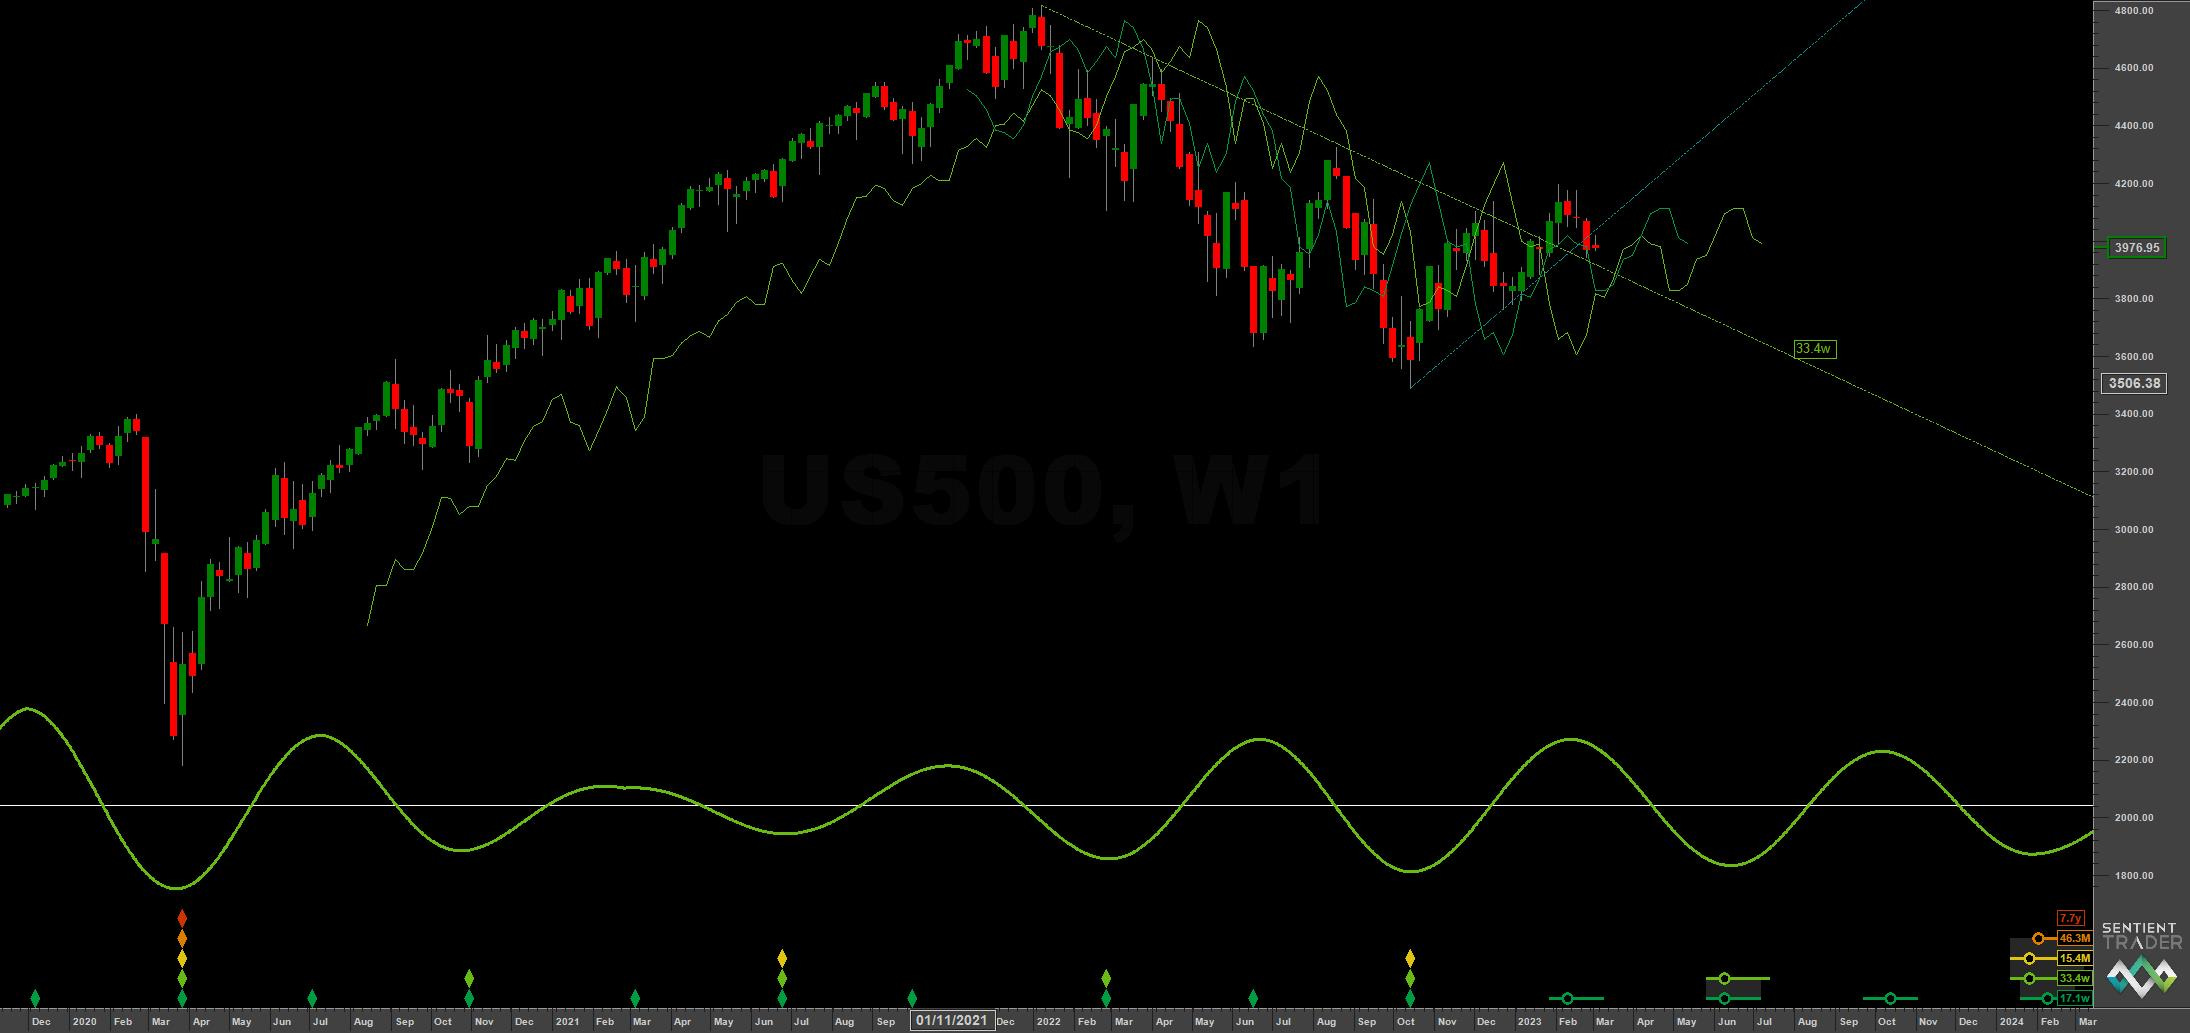
The 40 week FLD trough is directly below the most recent peak in price (20 week) suggesting that the crest may also be a peak of the 40 week component. If that is the case price should struggle to breach the high around 4200.
The next couple of months may well present an outstanding shorting opportunity as the longer components (assumed to be bearish) begin to push down once again.
Phasing Analysis
Long Term
Components including and longer than the 18 month nominal wave

Medium Term
Components between the 20 week to 18 month nominal wave
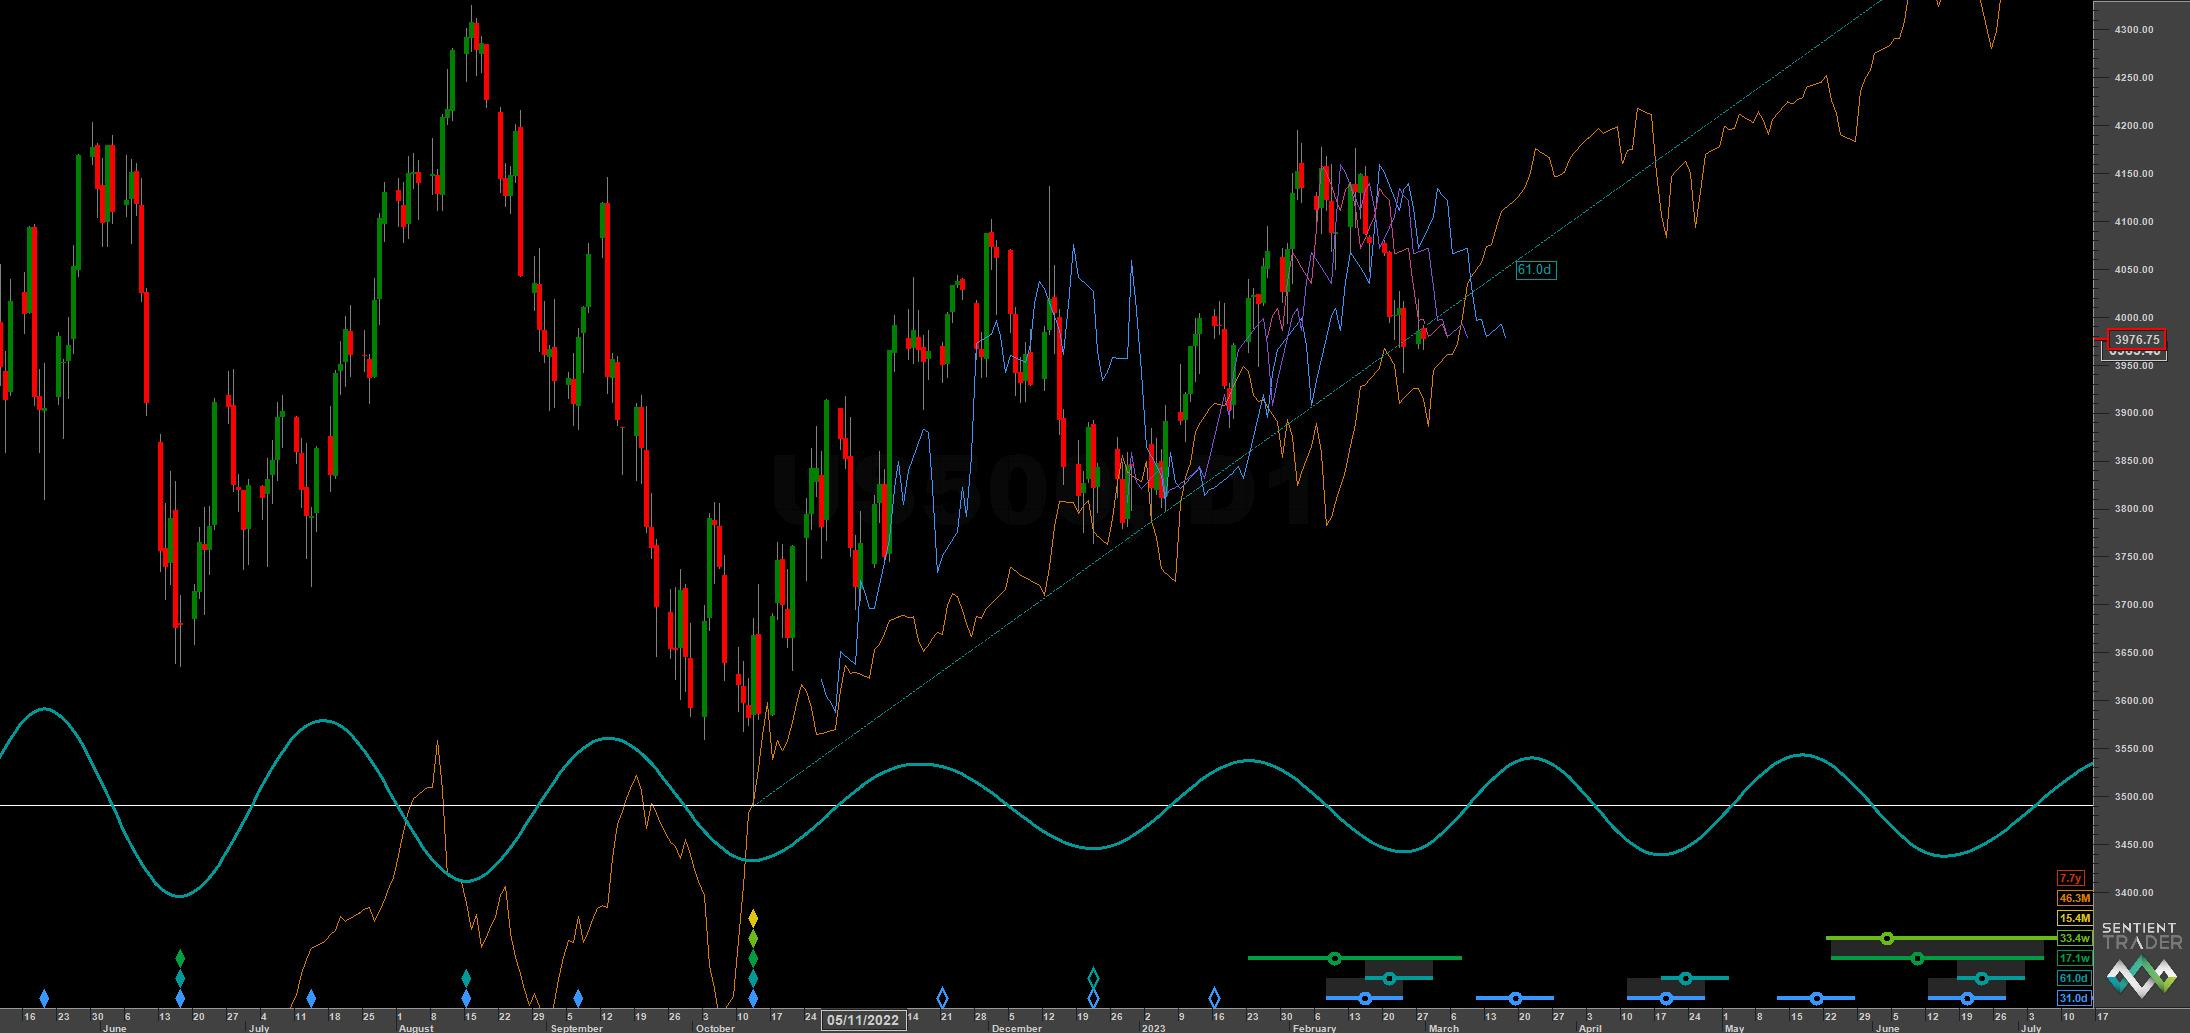
Short Term
Components shorter than the 20 week nominal wave

Trading Strategy
Interaction Status
Interactions and price in the FLD Trading Strategy (Advanced). This looks at an idealised 40 week cycle and an array of 3 FLD signal cycles. We apply the instrument’s phasing to the model and arrive at an overall summary for the interactions with the 20 day FLD, current and forthcoming.

Sigma-L recommendation: Risk Buy
Entry: 10 Day FLD / 20 Day FLD
Stop: Below forming 80 day nominal low
Target: 4150 - 4200
Reference 20 Day FLD Interaction: A3
Underlying 40 Day FLD Status: A2
Underlying 80 Day FLD Status: E
We expect a low of the 80 day component imminently and possibly the 20 week low although there is some uncertainty as to the placement, looking at the time frequency analysis. Therefore this buy is downgraded to a ‘risk buy’. A retest of the recent peaks around 4150-4200 is a fair target here.
The crucial ‘line in the sand’ is the 54 month FLD on the long term chart. Should the longer term phasing be accurate that FLD should be breached to the downside in the next couple of months.
FLD Settings
If you do not have the use of Sentient Trader use these settings to plot common FLDs in your trading software (daily scale) to more easily follow trading signals and strategy from Sigma-L.
Make sure to account for non-trading days if your broker omits them in the data feed (weekends, for example). The below offsets are given with no added calculation for non-trading days.
80 day nominal: 61 days | 32 day FLD offset
40 day nominal: 31 days | 16 day FLD offset
20 day nominal: 15.2 days | 8 day FLD offset
10 day nominal: 8.1 days | 4 day FLD offset
Correlated Exposure
A non exhaustive list of correlated instruments for consideration
SPDR S&P 500 ETF Trust SPY 0.00%↑
iShares Core S&P 500 ETF IVV 0.00%↑
Vanguard S&P 500 ETF VOO 0.00%↑
SPDR Portfolio S&P 500 ETF SPLG 0.00%↑
Direxion Daily S&P 500 Bull 3X Shares SPXL 0.00%↑
Direxion Daily S&P 500 Bear 3X Shares SPXS 0.00%↑
ProShares UltraPro Short S&P500 SPXU 0.00%↑
ProShares UltraPro S&P500 UPRO 0.00%↑