

Oil - Market Cycles - 22nd February 2023
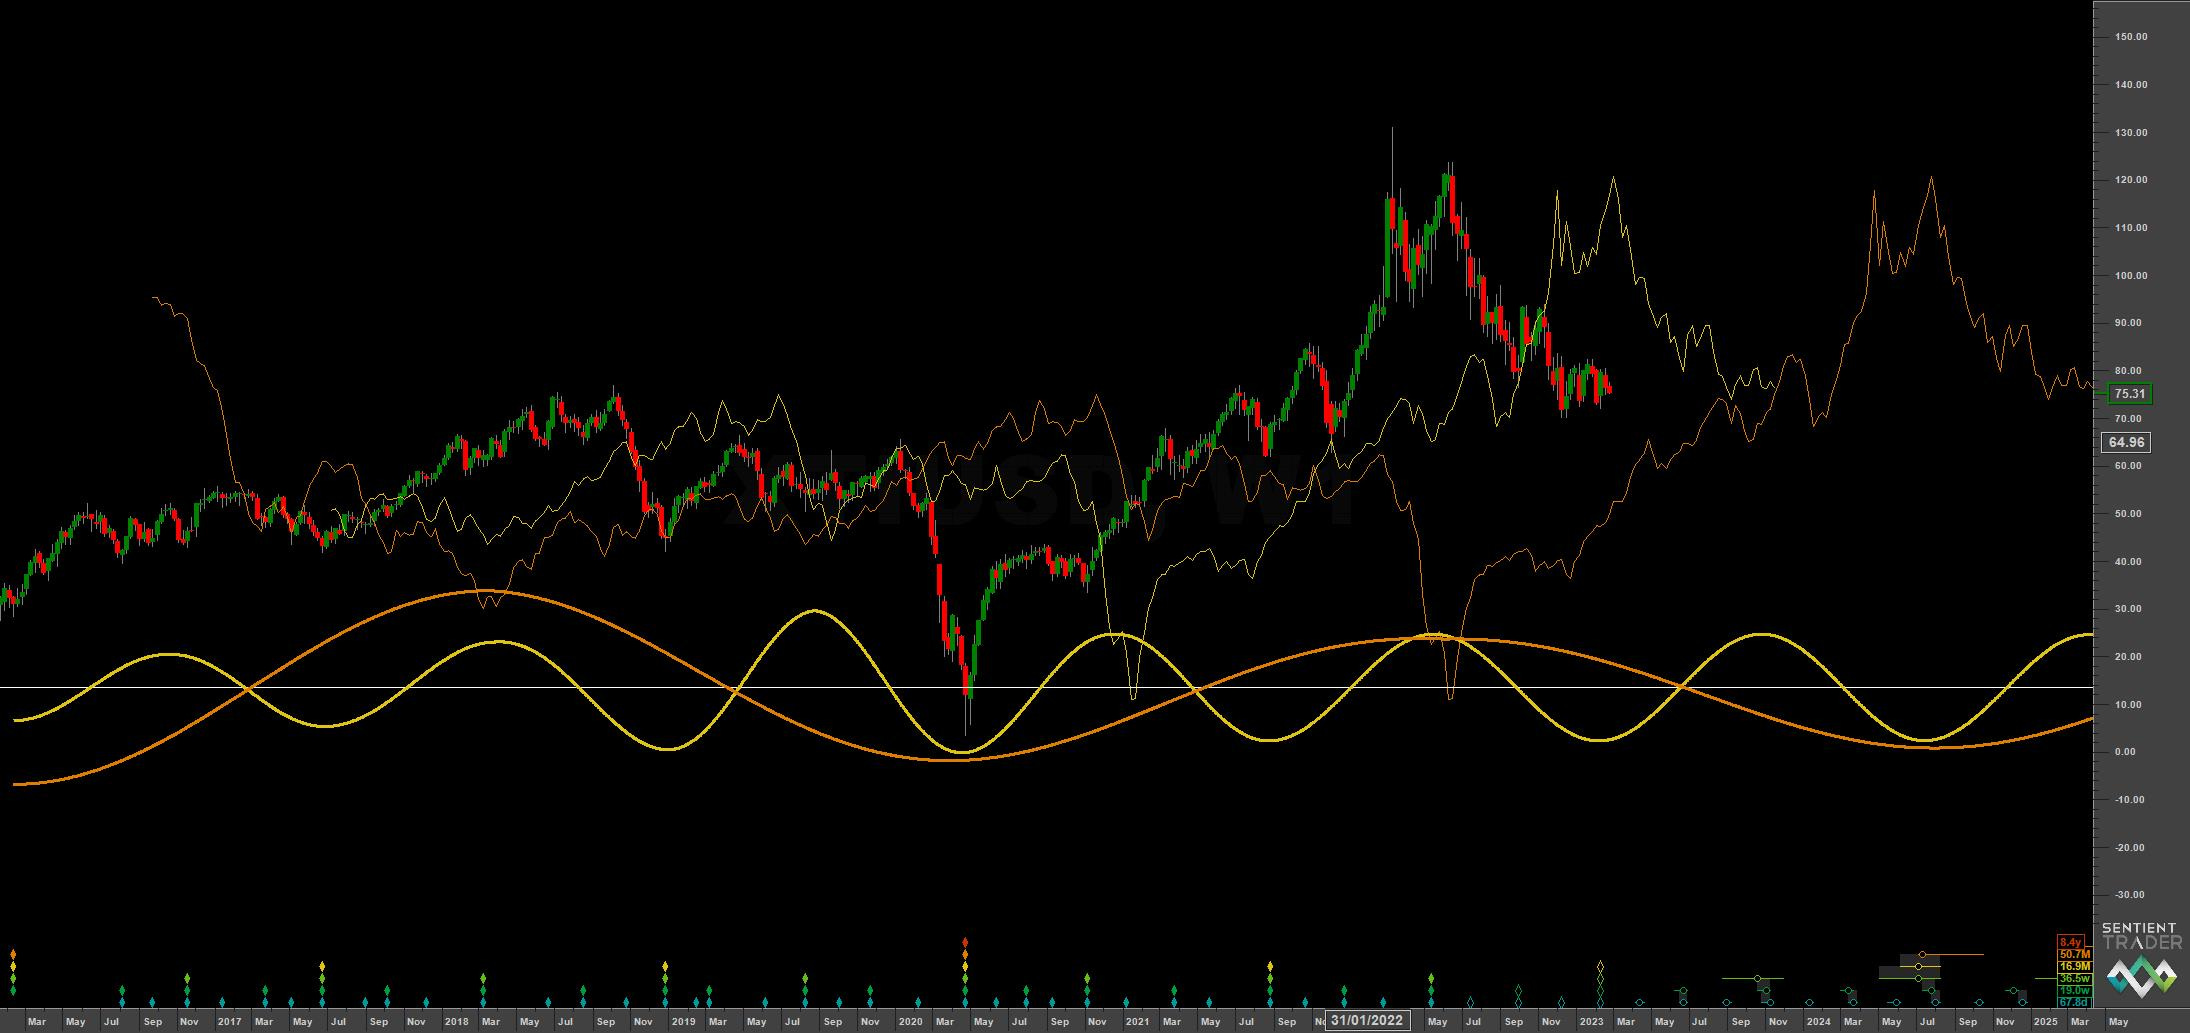
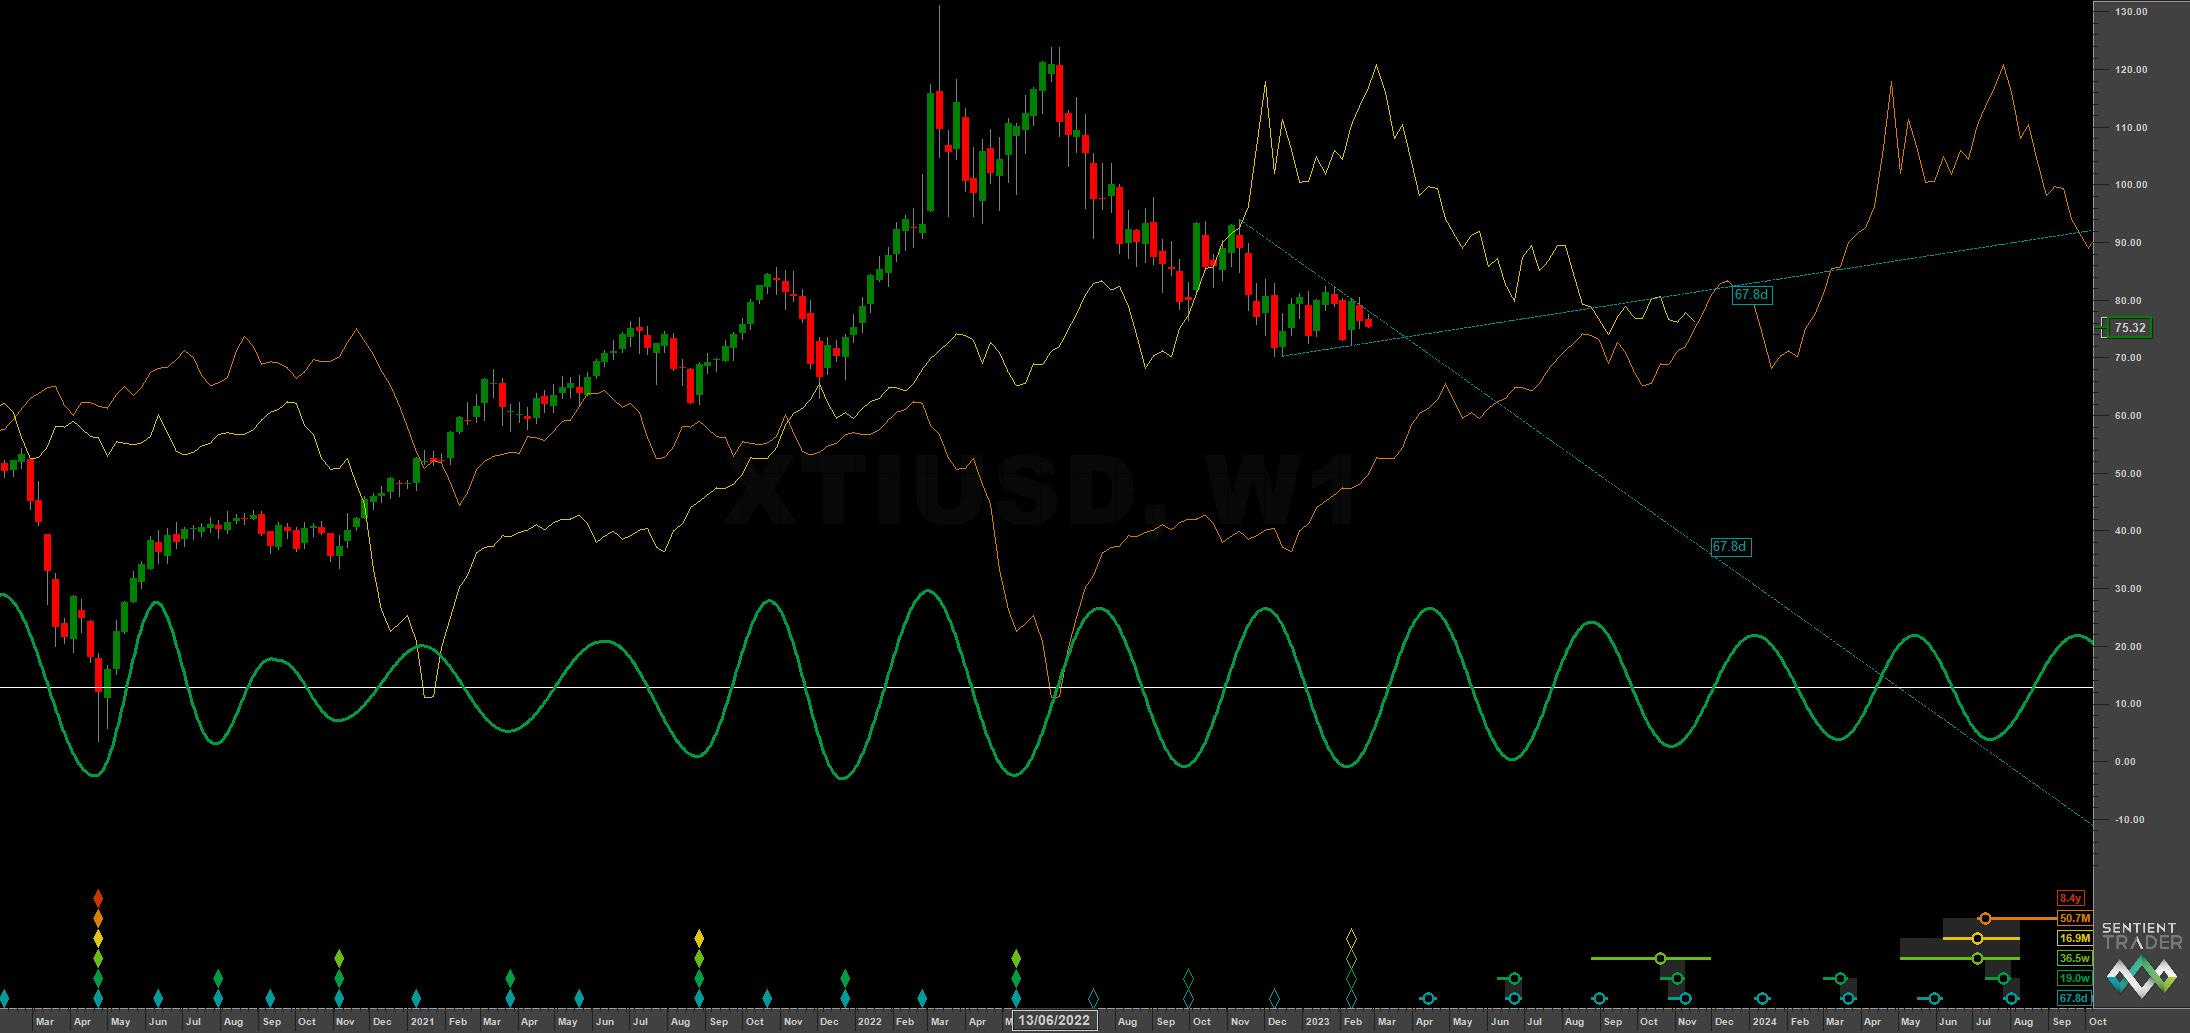
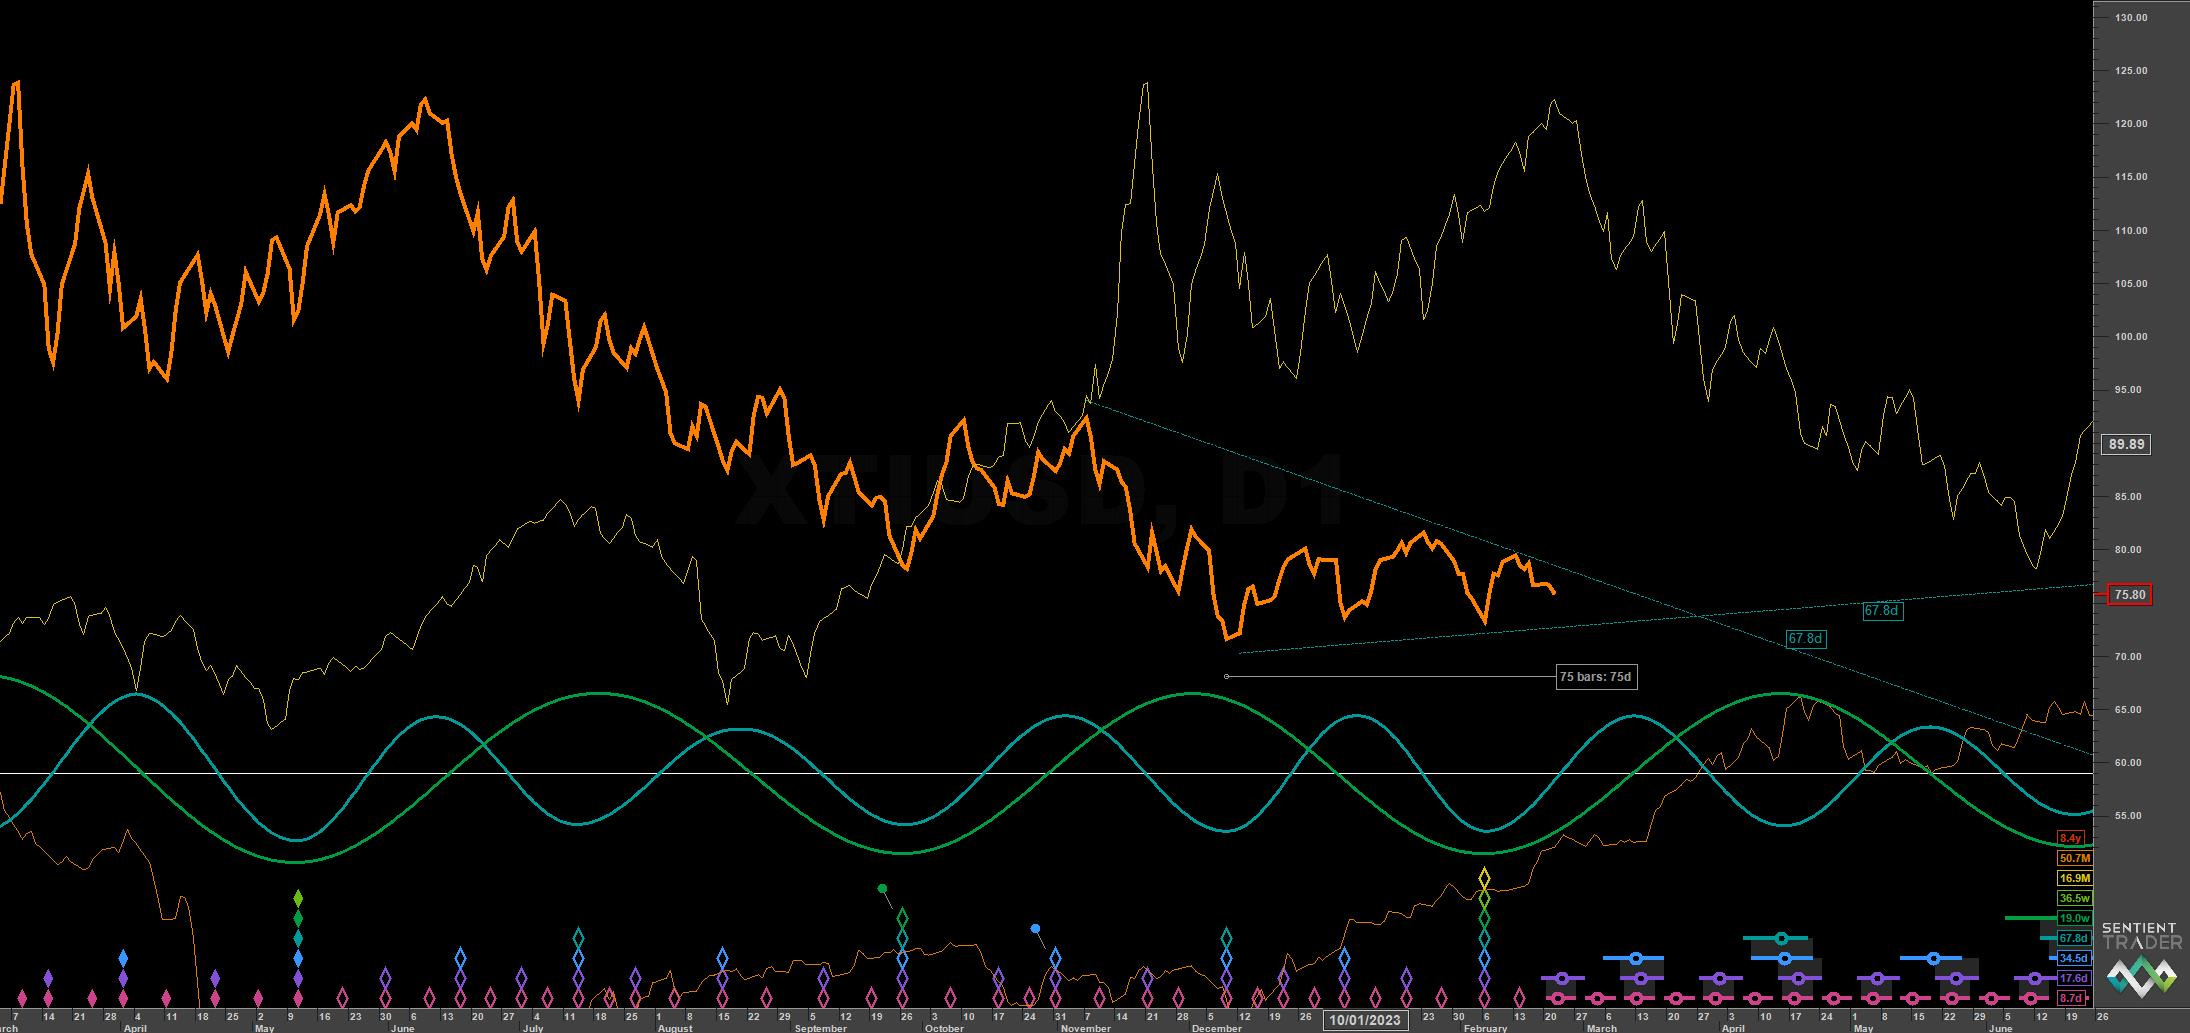
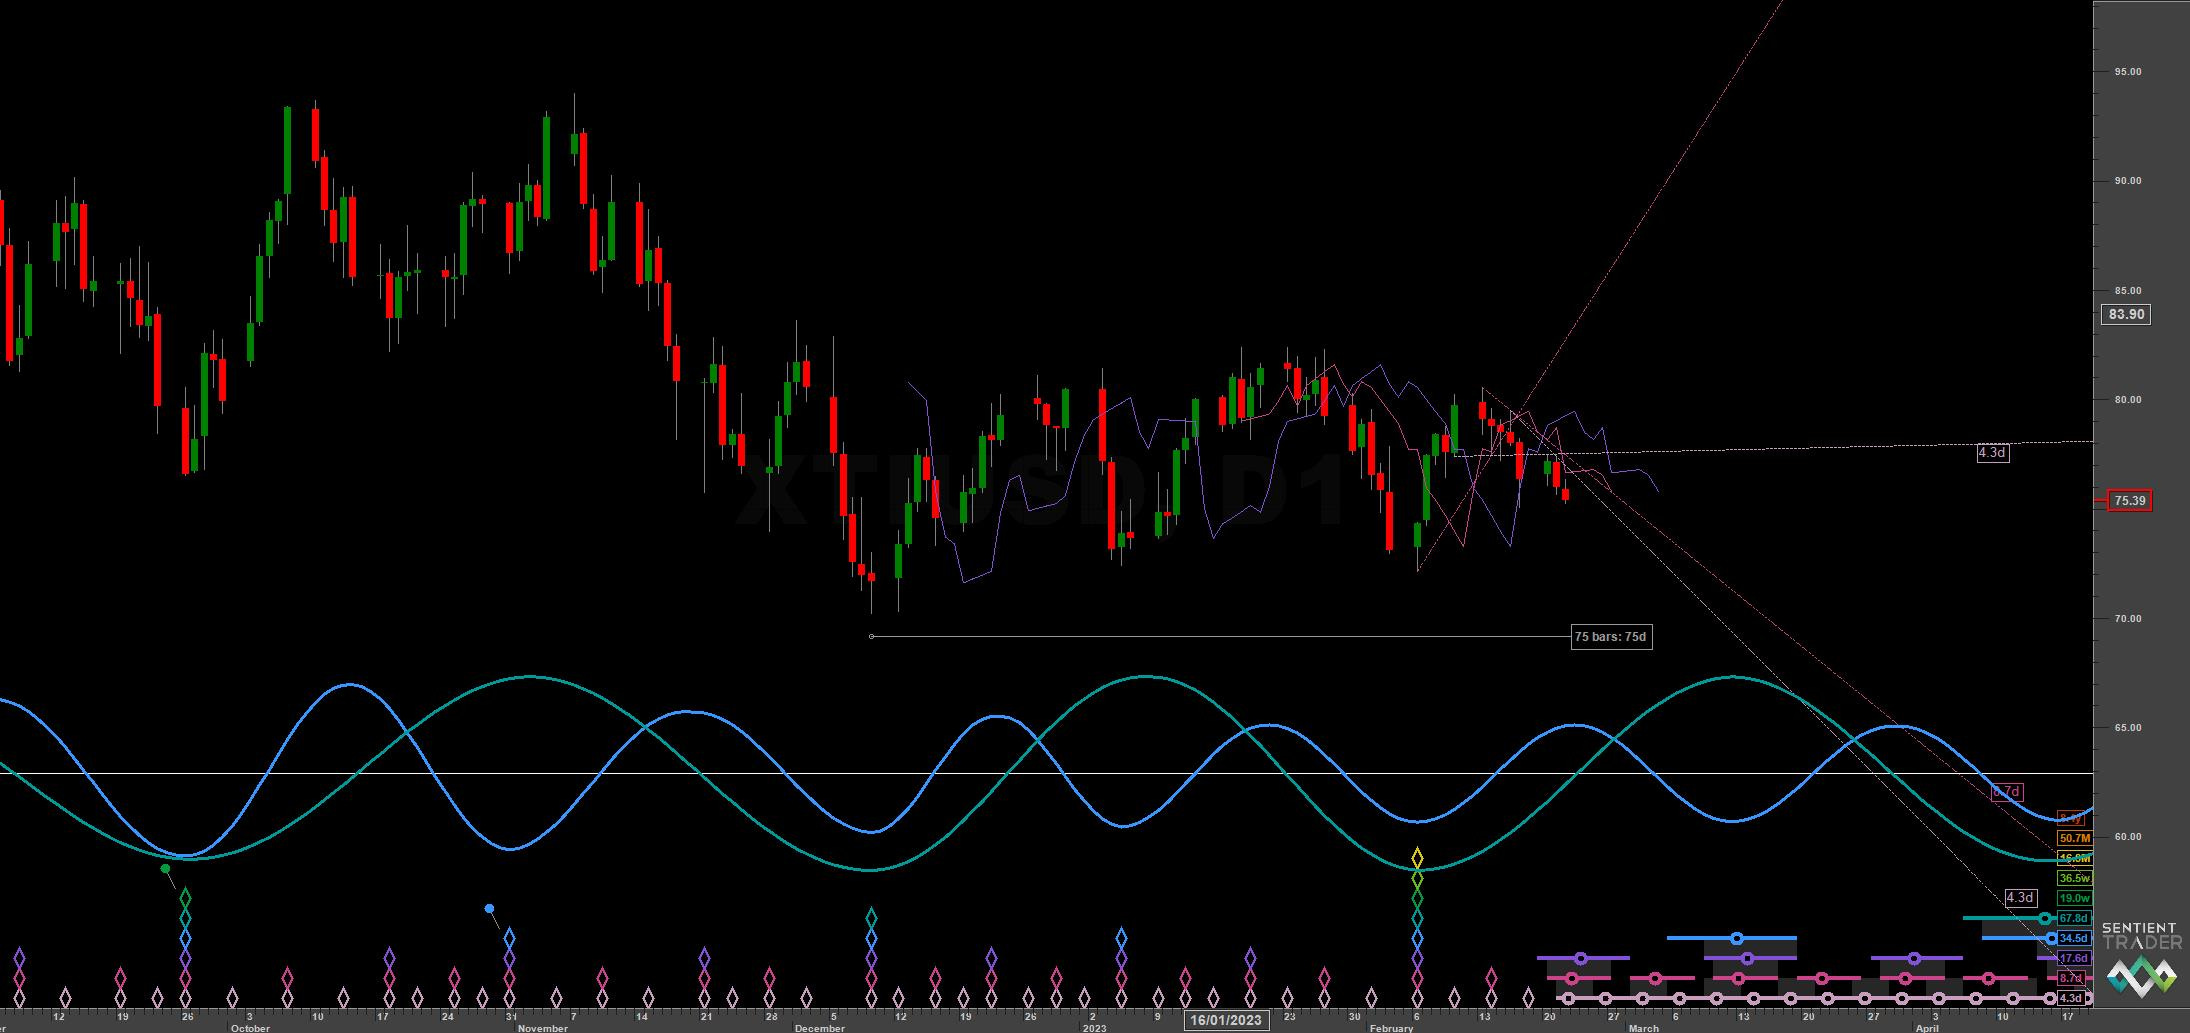
Has the 18 month component low formed in crude oil? A triangulation forms with the 80 day VTL providing a crucial line the sand for the next move

Essentials: Nominal Model | FLD | FLD Trading Strategy | FLD Trading Strategy (Advanced) | Principle of Nominality | Underlying Trend | Time Frequency Analysis
Analysis Summary
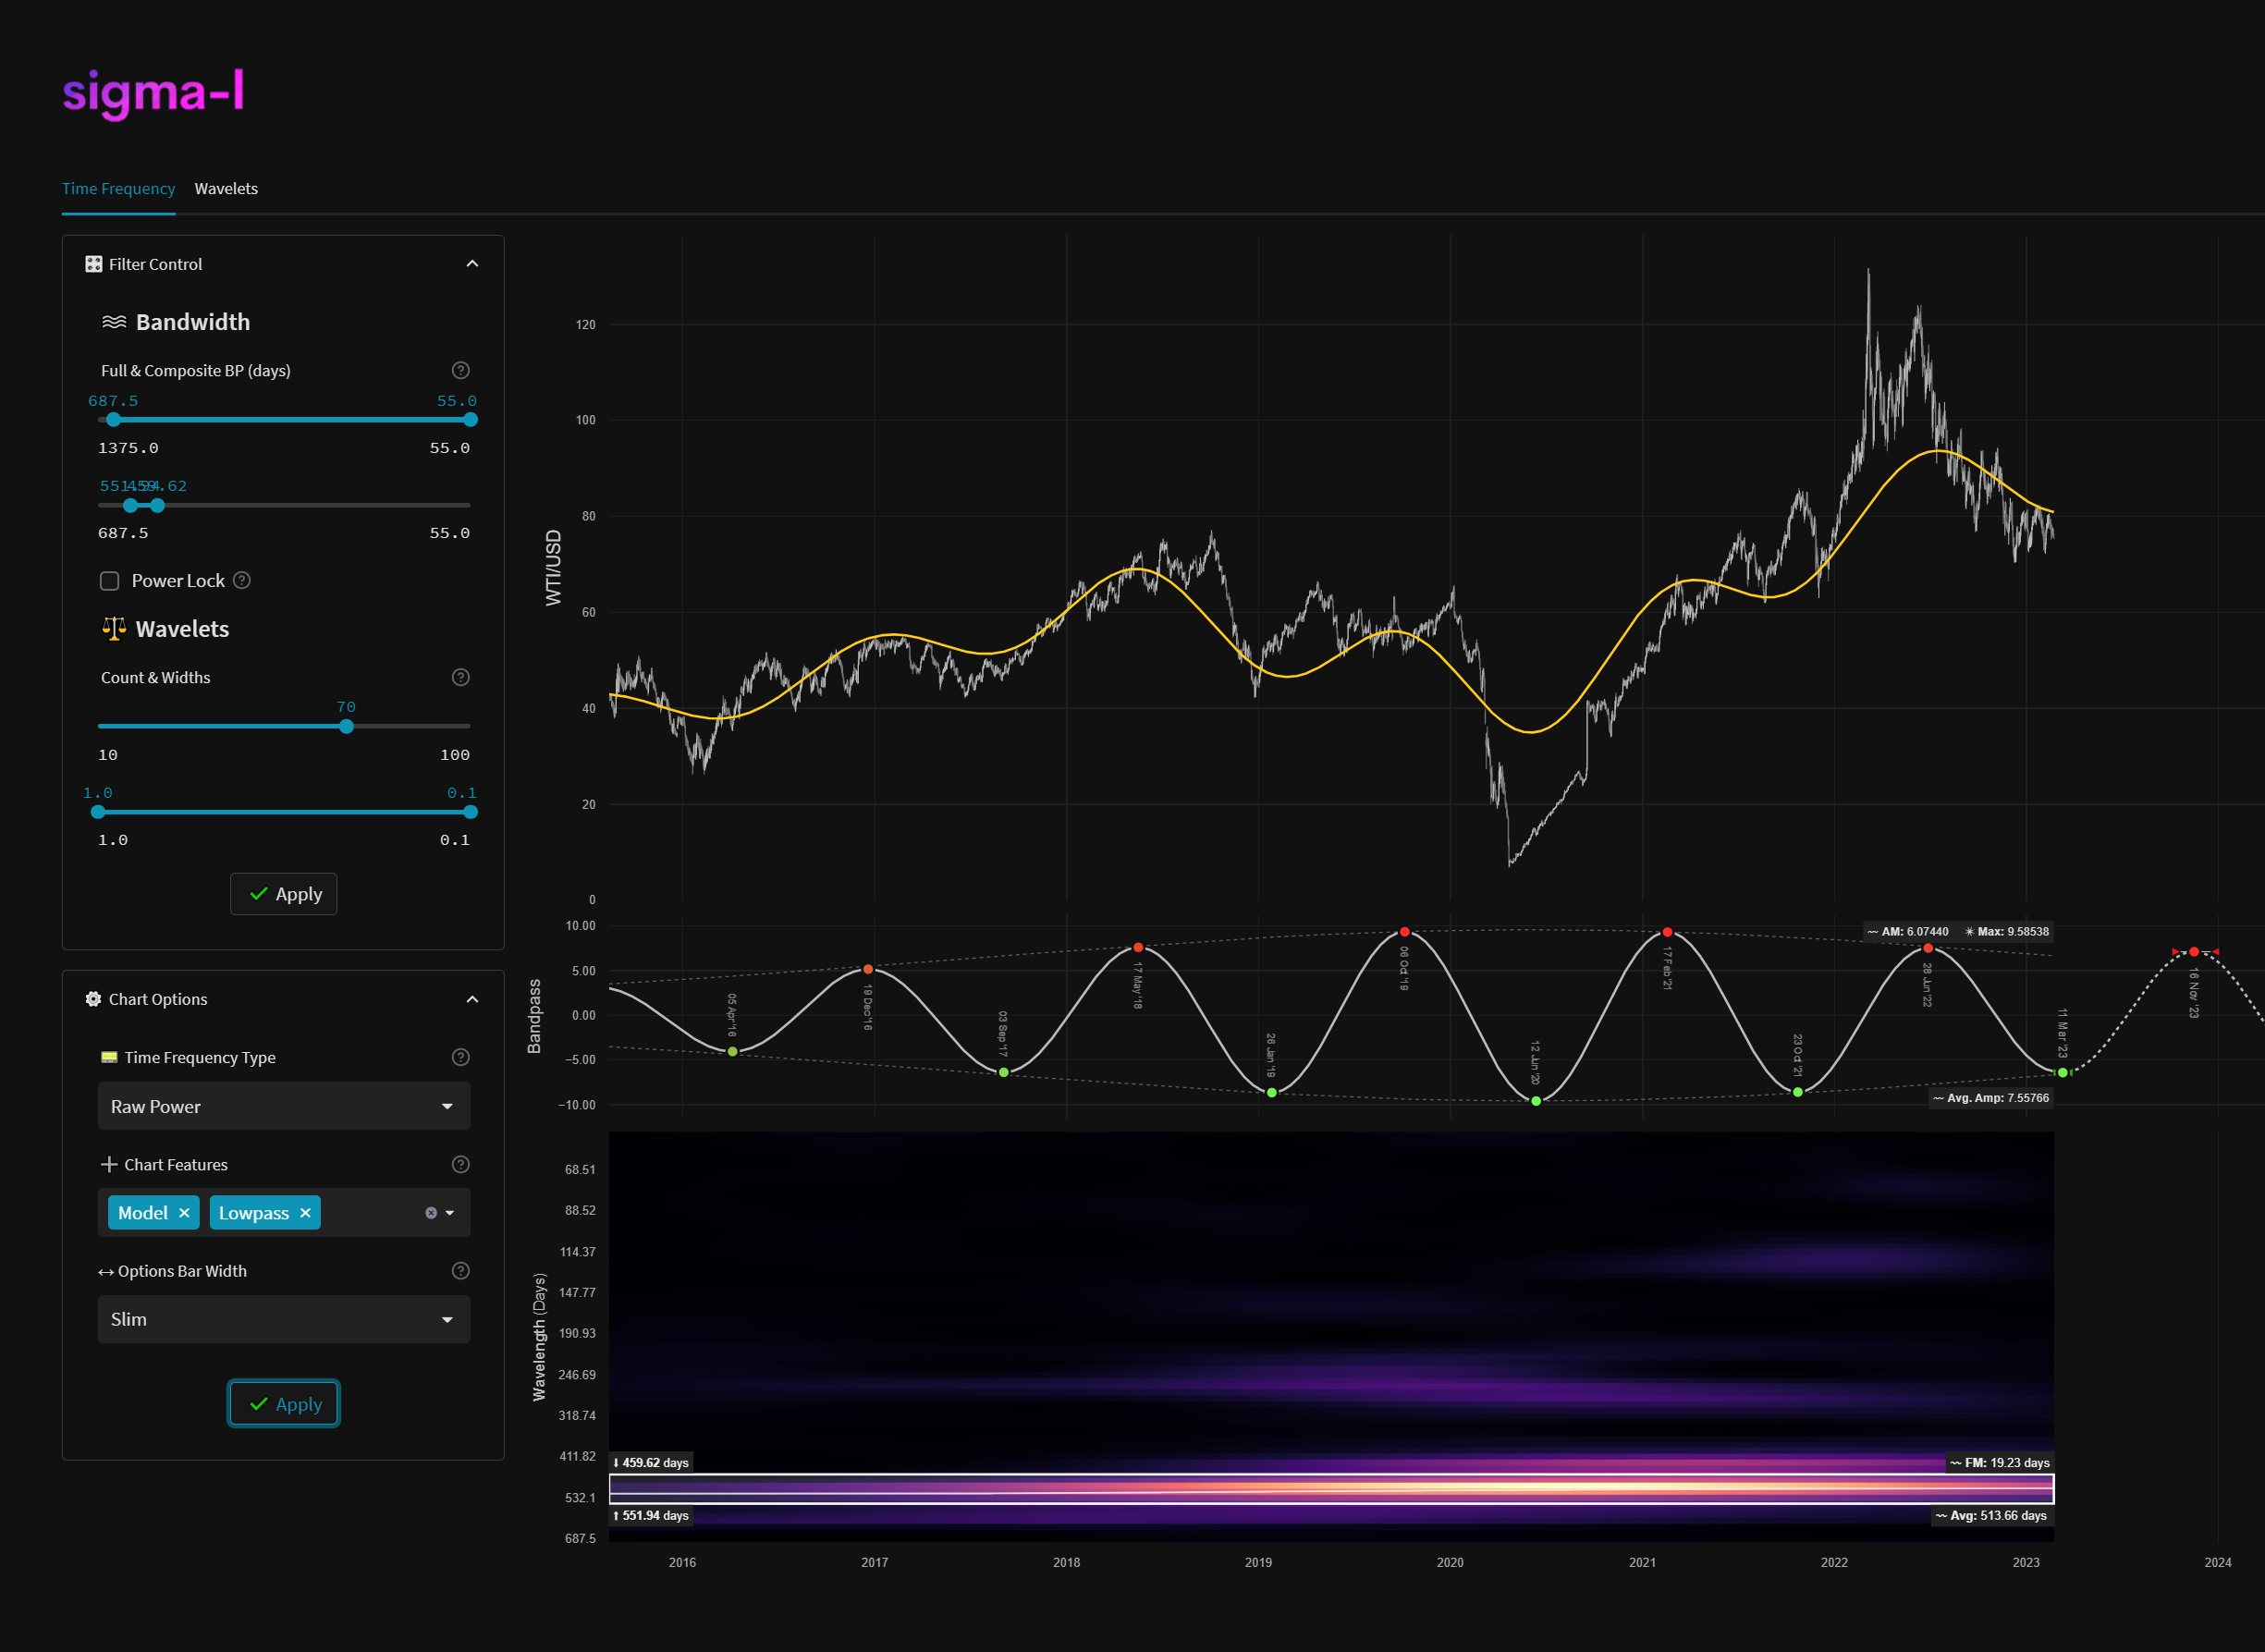
WTI Crude oil has moved sideways since our last update, notionally establishing the 80 day nominal low at a higher low than the low in December. However, that low is somewhat tenuous, with an overall fairly flat shape to the 80 day component, leaving us in some limbo as to the position of the 18 month component. The move to the 54 month FLD support around 55-60 is still very much a viable area but time is running out and it is worth looking at the bullish options in this report.
The 18 month component is running at around 17 months from the time frequency analysis and is currently 17.9 months along it’s phase, assuming the previous low was in August 2021. A move to the 54 month low in the next month or two will dictate a shift in that low to December 2021. This would, however, represent a significant frequency modulation from the sample average duration of around 17 months. This should be considered when speculating on the position of the longer component. Price is currently sitting directly under the 18 month FLD peak, a price trough here representing a flat underlying trend, perhaps what we might expect from the proposed final 18 month component of the larger wave.
At the medium and short term the component deemed the ‘nominal’ 80 day wave is a clear signal and has in fact formed a triangle over the last couple of iterations. The triangle is formed by connecting VTL peaks and troughs of the 80 day component. The downward subsection of that triangle forms an excellent ‘line in the sand’ for the formation of the 18 month component, a median price cross of this line conformation of the low with the current phasing. The move past this triangle (up or down) will likely be explosive.
The 18 month component trough is overdue, the 80 day component is troughing and crude oil has been relatively quiet. We think that is about to change with an imminent retrace back to the 18 month FLD over the next few months.
Phasing Analysis
Long Term
Components including and longer than the 18 month nominal wave
Medium Term
Components between the 20 week to 18 month nominal wave
Short Term
Components shorter than the 20 week nominal wave

Trading Strategy
Interaction Status
Interactions and price in the FLD Trading Strategy (Advanced). This looks at an idealised 40 week cycle and an array of 3 FLD signal cycles. We apply the instrument’s phasing to the model and arrive at an overall summary for the interactions with the 20 day FLD, current and forthcoming.

Sigma-L recommendation: Risk Buy
Entry: 10 Day VTL / FLD (risk on) / 20 Day FLD
Stop: Below 72.15 (assumed 18 month nominal low)
Target: 92-100 (18 month FLD resistance)
Reference 20 Day FLD Interaction: B-C
Underlying 40 Day FLD Status: A
Underlying 80 Day FLD Status: A
If the 18 month nominal low has occurred at the start of February a chance for a high reward / low risk long entry from the current pullback is a viable trade. A move upward out of the triangulation from the 80 day component is likely to be strong and test the 18 month FLD over the next couple of months.
Keep in the mind the outlier scenario of the 18 month low being still to come with support at the 54 month FLD. This will be clarified in the next week or two by price action, should it breach the low in early February.
FLD Settings
If you do not have the use of Sentient Trader use these settings to plot common FLDs in your trading software (daily scale) to more easily follow trading signals and strategy from Sigma-L.
Make sure to account for non-trading days if your broker omits them in the data feed (weekends, for example). The below offsets are given with no added calculation for non-trading days.
80 day nominal: 67.8 days | 34 day FLD offset
40 day nominal: 34.5 days | 17 day FLD offset
20 day nominal: 17.6 days | 9 day FLD offset
10 day nominal: 8.7 days | 4 day FLD offset
Correlated Exposure
A non exhaustive list of correlated instruments for consideration
United States Oil Fund LP $USO Energy Select Sector SPDR Fund XLE 0.00%↑
ProShares Ultra Bloomberg Crude Oil UCO 0.00%↑
Invesco DB Oil Fund DBO 0.00%↑
United States 12 Month Oil Fund LP USL 0.00%↑
ProShares K-1 Free Crude Oil Strategy ETF OILK 0.00%↑
MicroSectors Oil & Gas Exp. & Prod. 3x Leveraged ETN OILU 0.00%↑
MicroSectors Oil & Gas Exp. & Prod. -3x Inverse Leveraged ETN OILD 0.00%↑
United States Brent Oil Fund BNO 0.00%↑
iPath Pure Beta Crude Oil ETN OIL 0.00%↑