

Natural Gas: Hurst Cycles - 16th November 2022
Price collapses to our target of 5.73 and support around the 18 month FLD is imminent. An adjustment to the phasing suggests the low as a more probable position for the 40 week component trough

Tools required: Nominal Model | FLD | FLD Trading Strategy | FLD Trading Strategy (Advanced) | Principle of Nominality | Underlying Trend
Analysis Summary
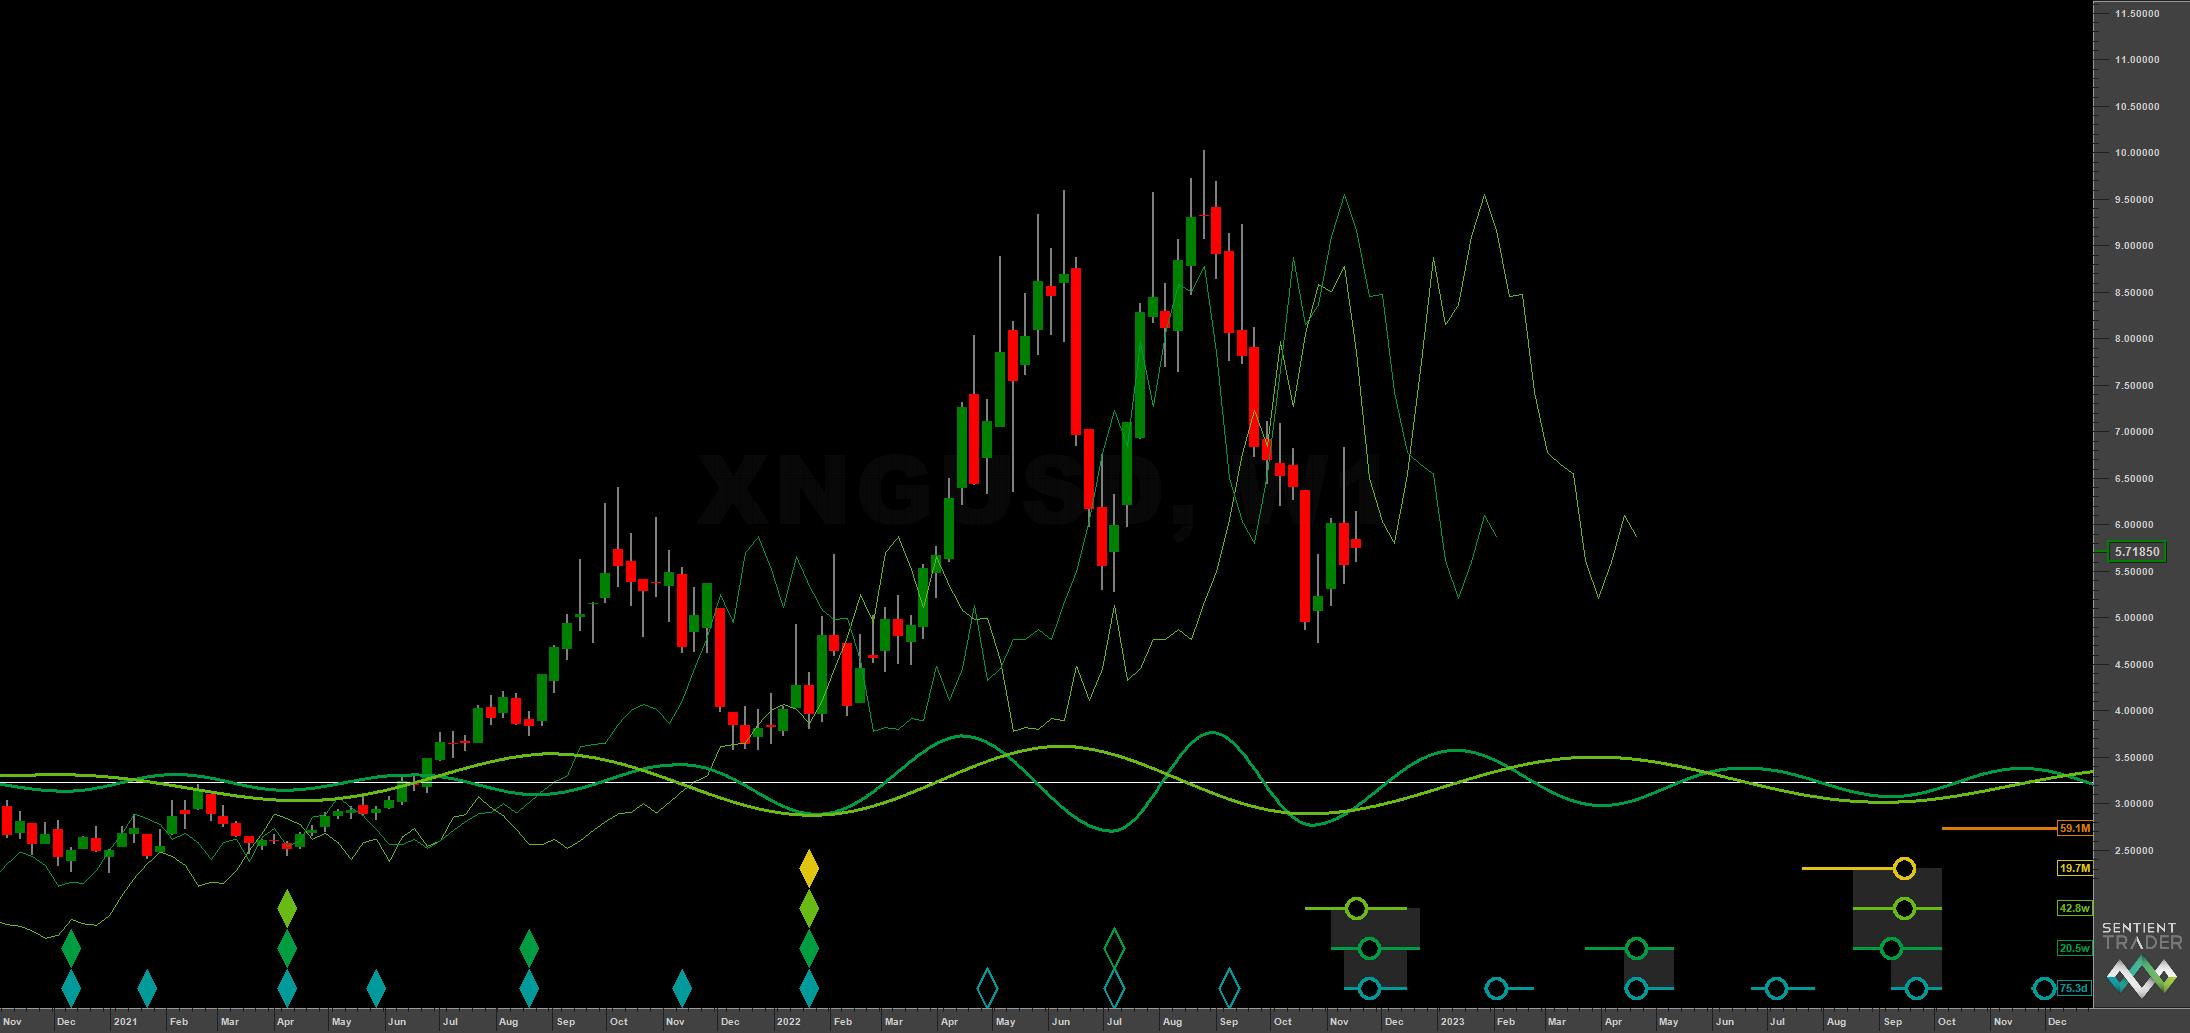
US Natural Gas collapsed in late October from a very weak 40 day component, described in our last report as a reliable signal from the phasing analysis. Price reached the 20 week FLD cross target of 5.73 and is now around the 18 month FLD support, most likely completing the final 40 day component in the current 80 day wave.
We now have an incoming and more compelling position for the 40 week component, the last trough of which was questioned in October:
From 14th October Report:
The placement of the longer components, namely the 40 week wave, is now under scrutiny. The most likely candidate for the low is in July this year, although it would be a significant frequency modulation of the component. To clarify this placement we need to see the next 80 day component trough and confirmation, currently due mid November.
With the low almost in place we have adjusted the phasing slightly (infact by one 80 day component) to the right, placing the most recent 18 month iteration in mid January 2022, slightly offset from the actual price low. This results in a much more reasonable phasing with the 40 week component in early September removed, retaining only a trough of 80 day magnitude. It would have been very rare indeed to see a trough of 40 week magnitude breached within the first 20 day wave of that component, as it was in September. Therefore this phasing is much more appealing and technically sound. It does introduce a wider frequency modulation to the 40 week component but it is not a huge deviation, the average wavelength coming in at around 42 months.
If the phasing is now accurate price should launch from this 40 week nominal low over the coming months. We can expect it unlikely to breach the previous highs near 10, the 4.5 year nominal peak has probably occurred already. A test of the 20 week component FLD is highly likely at around 6.5-7 and should amplitude remain in the 20 week component until February, a test of the 40 week FLD around 7-8.
Shorter term there is volatile activity. Price may well come back down to test the 5 area before forming a double bottom style trough for the anticipated 40 week nominal low. More on that below in the trading strategy.
Phasing Analysis
Sentient Trader
Utilising a pattern recognition algorithm and Hurst’s diamond notation


Time Frequency Analysis
Wavelet convolution targeting 18 month and 20 week components


Trading Strategy
Interaction Status
Interactions and price in the FLD Trading Strategy (Advanced). This looks at an idealised 40 week cycle and an array of 3 FLD signal cycles. We apply the instrument’s phasing to the model and arrive at an overall summary for the interactions with the 20 day FLD, current and forthcoming.

Sigma-L recommendation: Buy
Entry: 20 Day FLD
Stop: Below formed 40/80 day and proposed 40 week nominal trough
Target: Initially 6.5-7 (20 week FLD resistance). Possibly up to 7.5-8 (40 week FLD resistance) over coming months
Reference 20 Day FLD Interaction: A
Underlying 40 Day FLD Status: A
Underlying 80 Day FLD Status: A
Price is in the process of finishing out what looks to be the final 40 day component of the 40 week wave as phased above. There may well be a final dip down to the level around 5 to form a ‘double bottom’ style low before price starts to move up. A median price cross of the 20 day FLD should prove to be good confirmation at this point in the 40 day cycle.
Initial targets are up at the 20 week FLD (shown on medium term charts) around 6.5-7 and then subsequently, depending on the shape of the first 80 day component here, perhaps up to 7.5-8.
Since NG has most likely formed it’s 4.5 year nominal peak (late August 2022), the underlying trend is slowly turning down but against that is the tremendously large amplitude of the 40 week and 20 week components recently.
FLD Settings
If you do not have the use of Sentient Trader use these settings to plot common FLDs in your trading software (daily scale) to more easily follow trading signals and strategy from Sigma-L.
Make sure to account for non-trading days if your broker omits them in the data feed (weekends, for example). The below offsets are given with no added calculation for non-trading days.
80 day nominal: 75.3 days | 37 day FLD offset
40 day nominal: 36 days | 18 day FLD offset
20 day nominal: 16.5 days | 8 day FLD offset
10 day nominal: 8.3 days | 4 day FLD offset
Correlated Exposure
A non exhaustive list of correlated instruments for consideration
United States Natural Gas Fund LP UNG 0.00%↑
ProShares Ultra Bloomberg Natural Gas BOIL 0.00%↑
United States 12 Month Natural Gas Fund LP UNL 0.00%↑
iPath Series B Bloomberg Natural Gas Subindex Total Return ETN GAZ 0.00%↑
ProShares UltraShort Bloomberg Natural Gas KOLD 0.00%↑