

Natural Gas: Hurst Cycles - 16th January 2023
A weak bounce from the 40 week nominal component precedes a collapse in the US Natural Gas price. We look at an incoming short term low and prospects over the next few months.

Essentials: Nominal Model | FLD | FLD Trading Strategy | FLD Trading Strategy (Advanced) | Principle of Nominality | Underlying Trend | Time Frequency Analysis
Analysis Summary
Natural Gas made a brief flurry upwards, subsequent to our last report in November 2022 in which we explored the convoluted placement of the 40 week component low. Whilst price hit and exceeded our target range of 6.5-7 the follow through from this component has been weak, further emphasising the 4.5 year nominal peak probability we mentioned in November.
From 16th November Report:
We can expect it unlikely to breach the previous highs near 10, the 4.5 year nominal peak has probably occurred already. A test of the 20 week component FLD is highly likely at around 6.5-7 and should amplitude remain in the 20 week component until February, a test of the 40 week FLD around 7-8.
Clearly amplitude at the 20 week component to the bullish side has collapsed, replaced by a bearish emphasis that is now likely to be troughing into a low of at least 80 day nominal magnitude. There is some compelling new evidence from the unbiased time frequency analysis of a component around 105 days in wavelength. This may well be a frequency modulated 20 week wave or a very long 80 day nominal component. We prefer the former and it will be fascinating to track this component moving forwards.
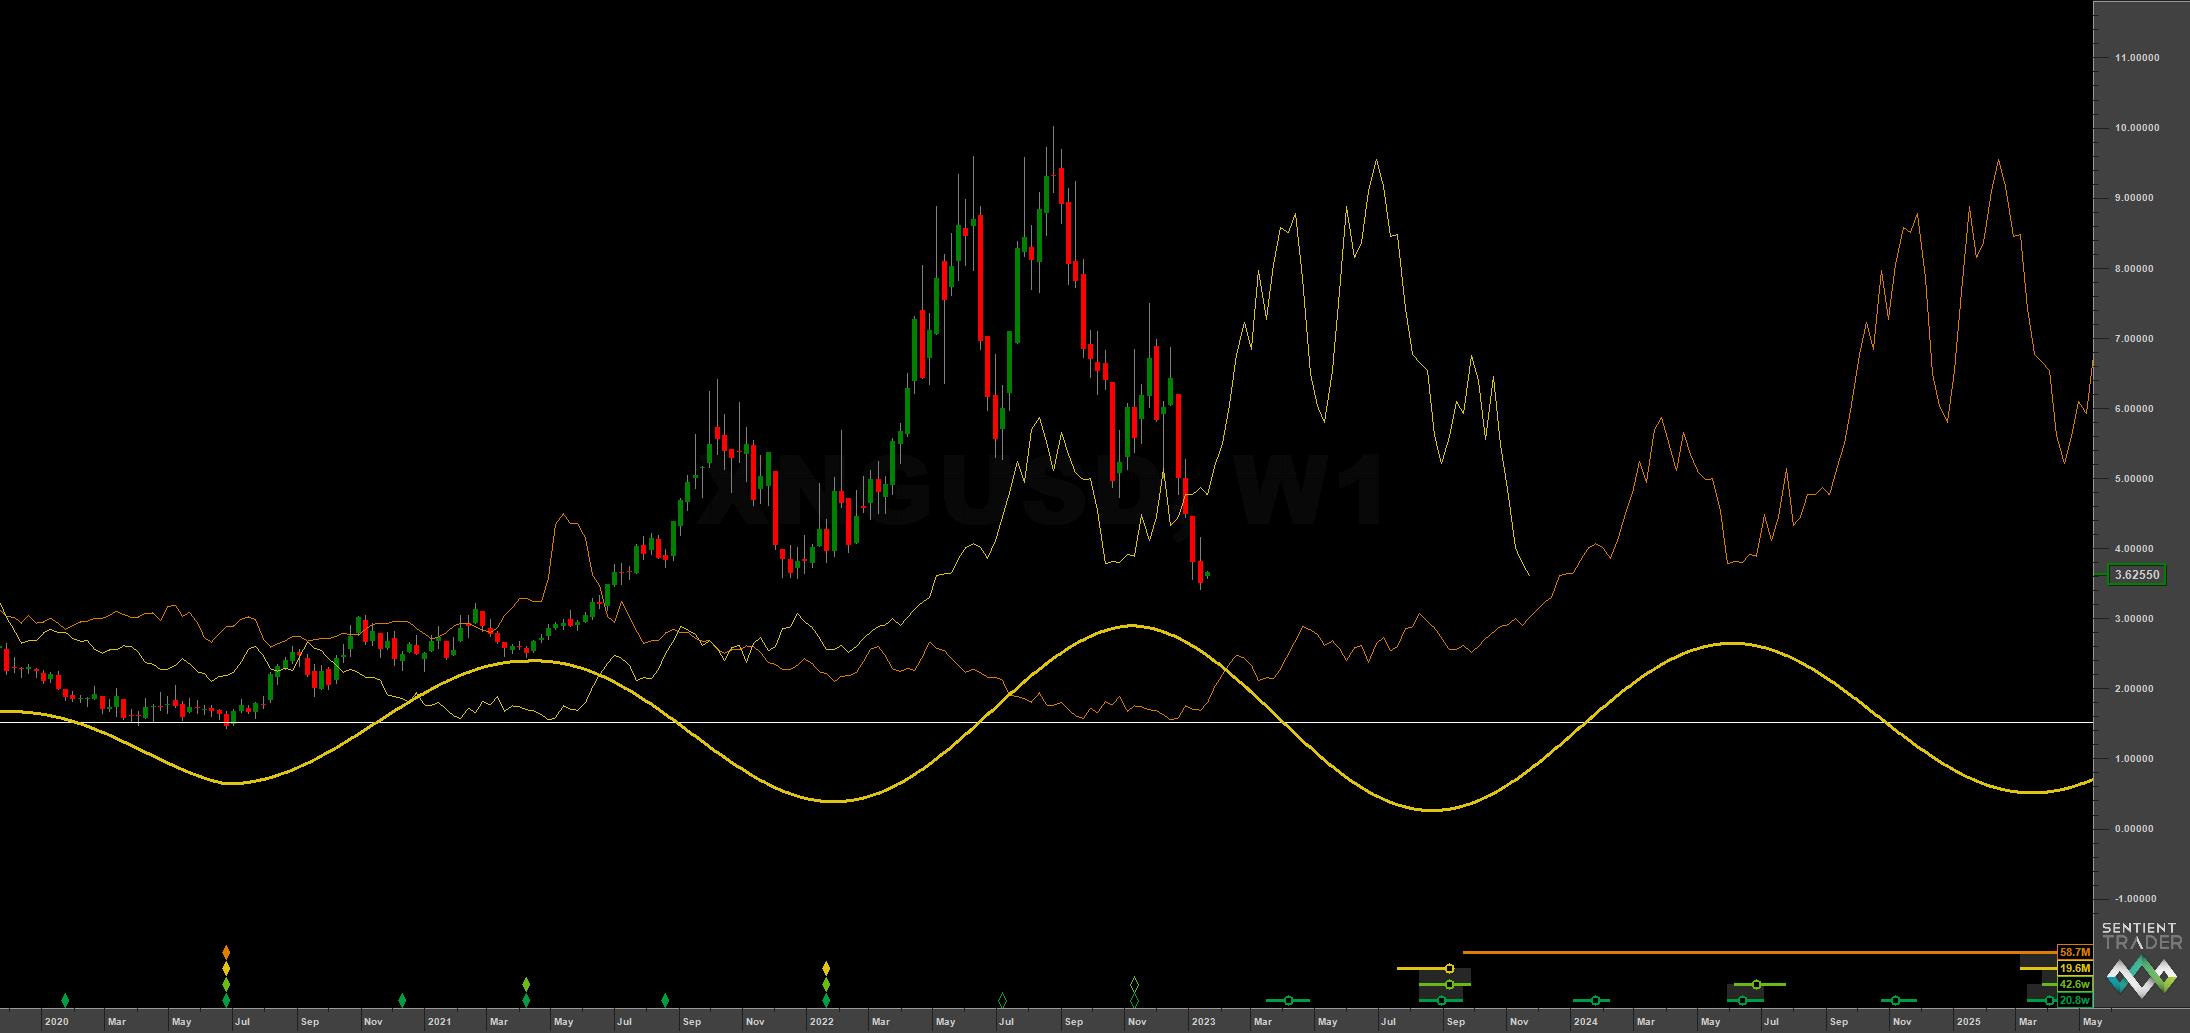
The 18 month component, running at around 17 months from the TFA below is due to trough around April to May this year and will likely co-incide with support at the 54 month FLD around 3, shown on the Sentient Trader long term chart.
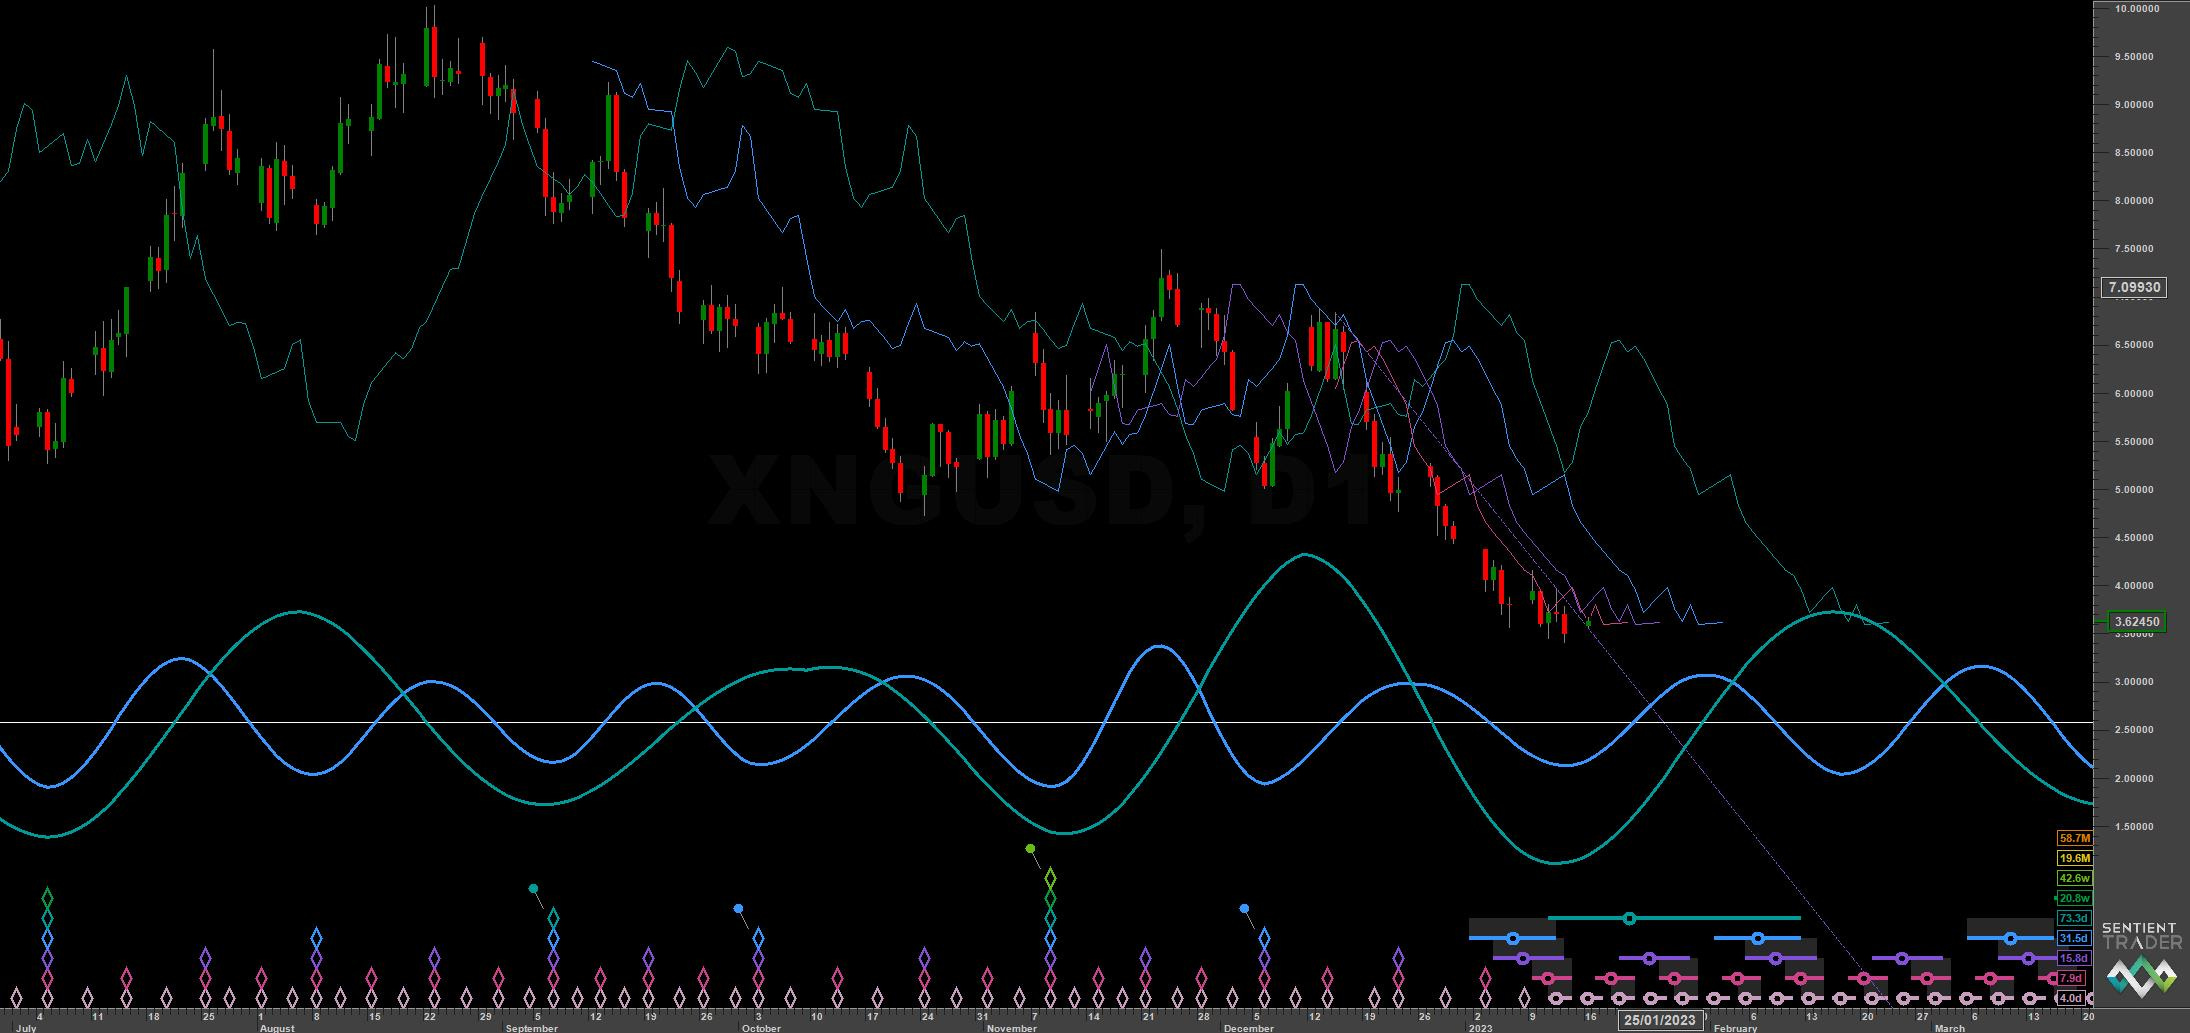
At the shorter term both analysis methods converge on the visually apparent 40 day nominal wave, running at around 25-32 days in wavelength and troughing shortly. A test of the area around the 80 day FLD at 4.75-5 is likely.
Phasing Analysis
Long Term
Components including and longer than the 18 month nominal wave

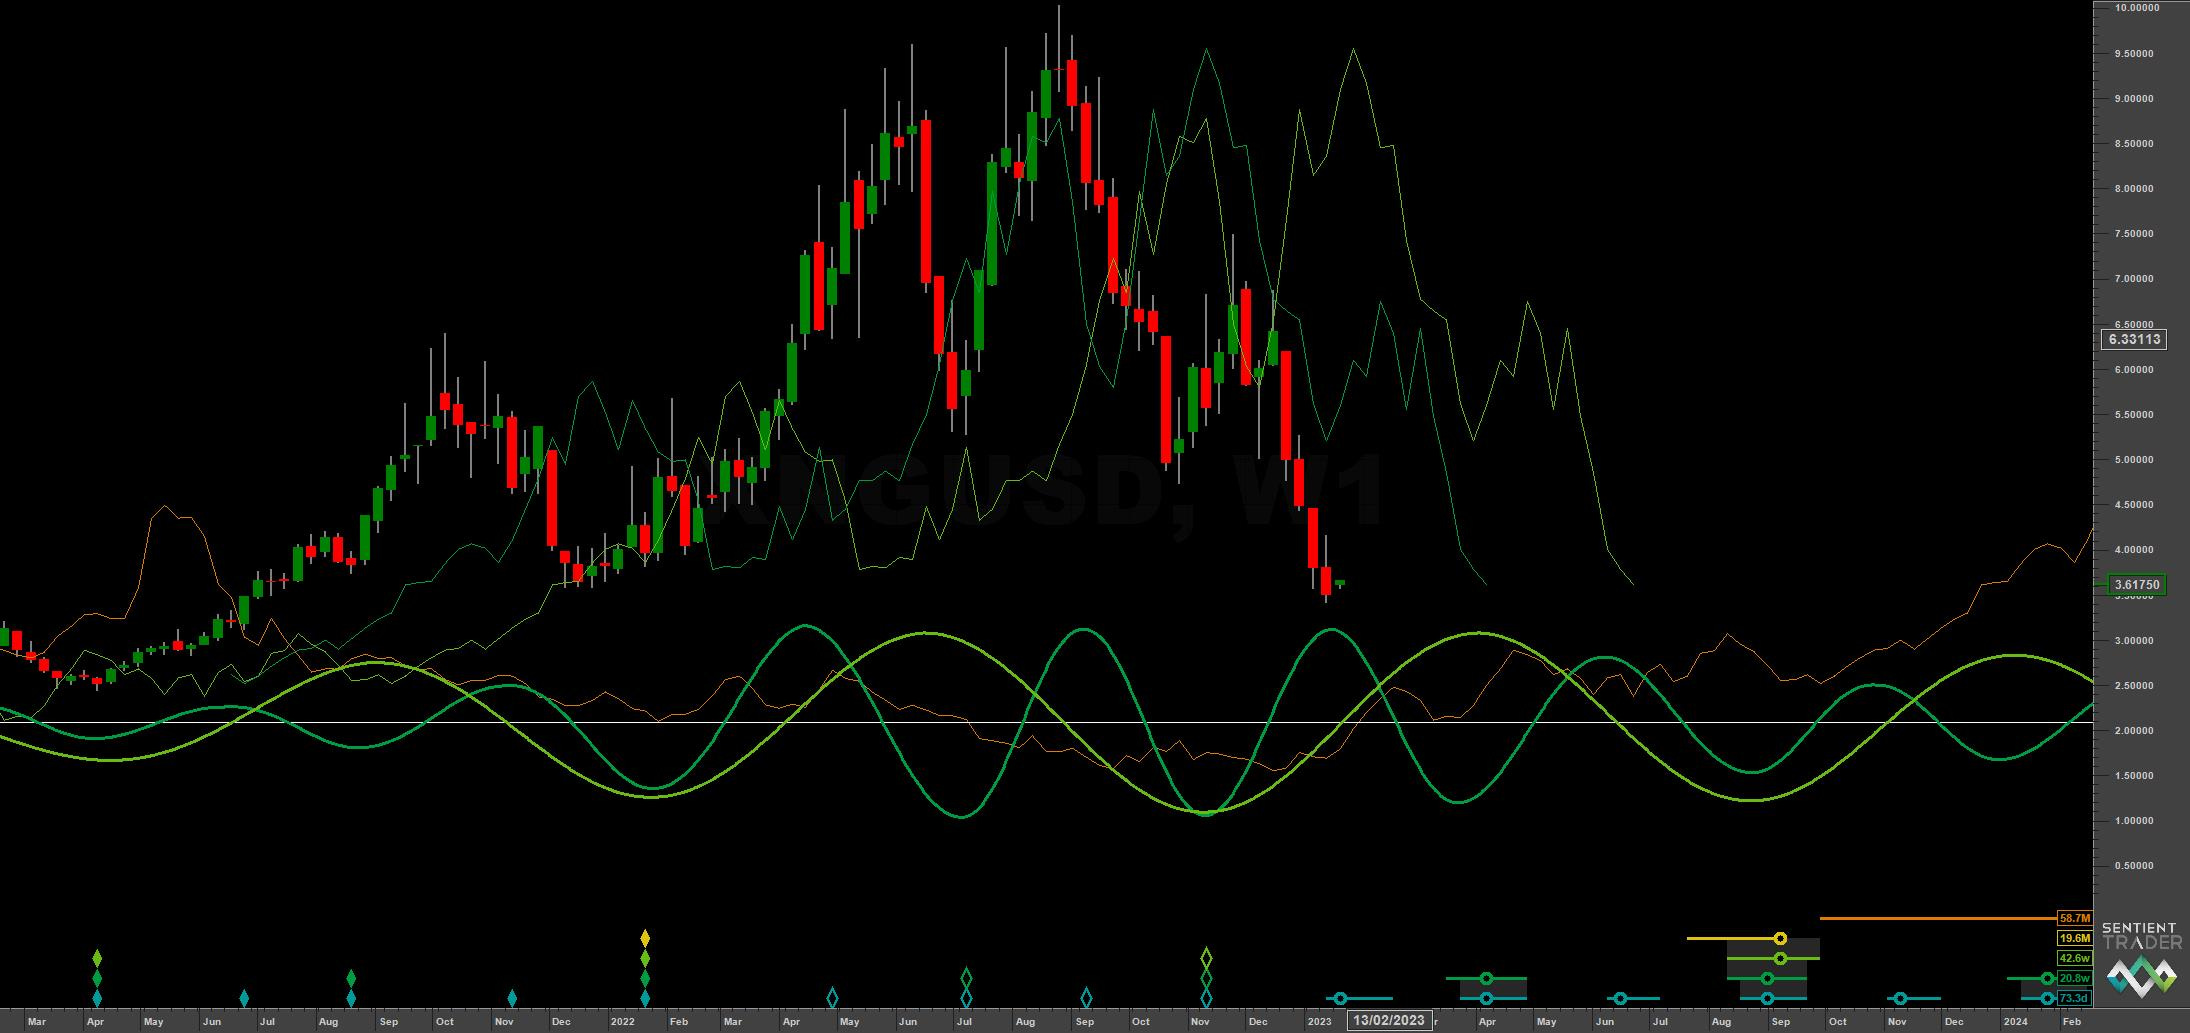
Medium Term
Components between the 20 week to 18 month nominal wave

Short Term
Components shorter than the 20 week nominal wave

Trading Strategy
Interaction Status
Interactions and price in the FLD Trading Strategy (Advanced). This looks at an idealised 40 week cycle and an array of 3 FLD signal cycles. We apply the instrument’s phasing to the model and arrive at an overall summary for the interactions with the 20 day FLD, current and forthcoming.

Sigma-L recommendation: Risk Buy
Entry: 10 Day FLD / 20 Day FLD
Stop: Below forming 80 day component low
Target: 4.75 - 5 (around 80 day FLD resistance)
Reference 20 Day FLD Interaction: A2
Underlying 40 Day FLD Status: E
Underlying 80 Day FLD Status: B-C
The underlying trend in NG is heavily down but the incoming 80 day component low should provide a bear market rally to test the 80 day FLD . Price is currently straddling the 10 day FLD at the time of writing.
It will be interesting to see if the component that is clear around 105 days (see medium term TFA above) is also troughing here. It may well be the case that this is the 20 week ‘nominal’ wave subject to some marked frequency modulation.
FLD Settings
If you do not have the use of Sentient Trader use these settings to plot common FLDs in your trading software (daily scale) to more easily follow trading signals and strategy from Sigma-L.
Make sure to account for non-trading days if your broker omits them in the data feed (weekends, for example). The below offsets are given with no added calculation for non-trading days.
80 day nominal: 73.3 days | 36 day FLD offset
40 day nominal: 31.5 days | 16 day FLD offset
20 day nominal: 15.8 days | 8 day FLD offset
10 day nominal: 7.9 days | 4 day FLD offset
Correlated Exposure
A non exhaustive list of correlated instruments for consideration
United States Natural Gas Fund LP UNG 0.00%↑
ProShares Ultra Bloomberg Natural Gas BOIL 0.00%↑
United States 12 Month Natural Gas Fund LP UNL 0.00%↑
iPath Series B Bloomberg Natural Gas Subindex Total Return ETN GAZ 0.00%↑
ProShares UltraShort Bloomberg Natural Gas KOLD 0.00%↑
Excellent analysis as always.