


ΣL Uranium Composite - 28th April 2023 | @ 147 Days | Snippet
'C' class signal detected in Sigma-L Uranium Composite (NXE/DNN/UEC/CCJ/UUUU). Average wavelength of 147 days over 9 completed sample iterations since October 2019. Currently troughing.

NXE 0.00%↑ DNN 0.00%↑ CCJ 0.00%↑ UEC 0.00%↑ UUUU 0.00%↑
See Also:
Geiger Counter Ltd 160 Day Cycle
Uranium Energy Corp 154 Day Cycle
Sprott Uranium Miners 157 Day Cycle
Signal Class & Attributes
Defining characteristics of the component detected over the sample period.
Detected Signal Class: C - learn more
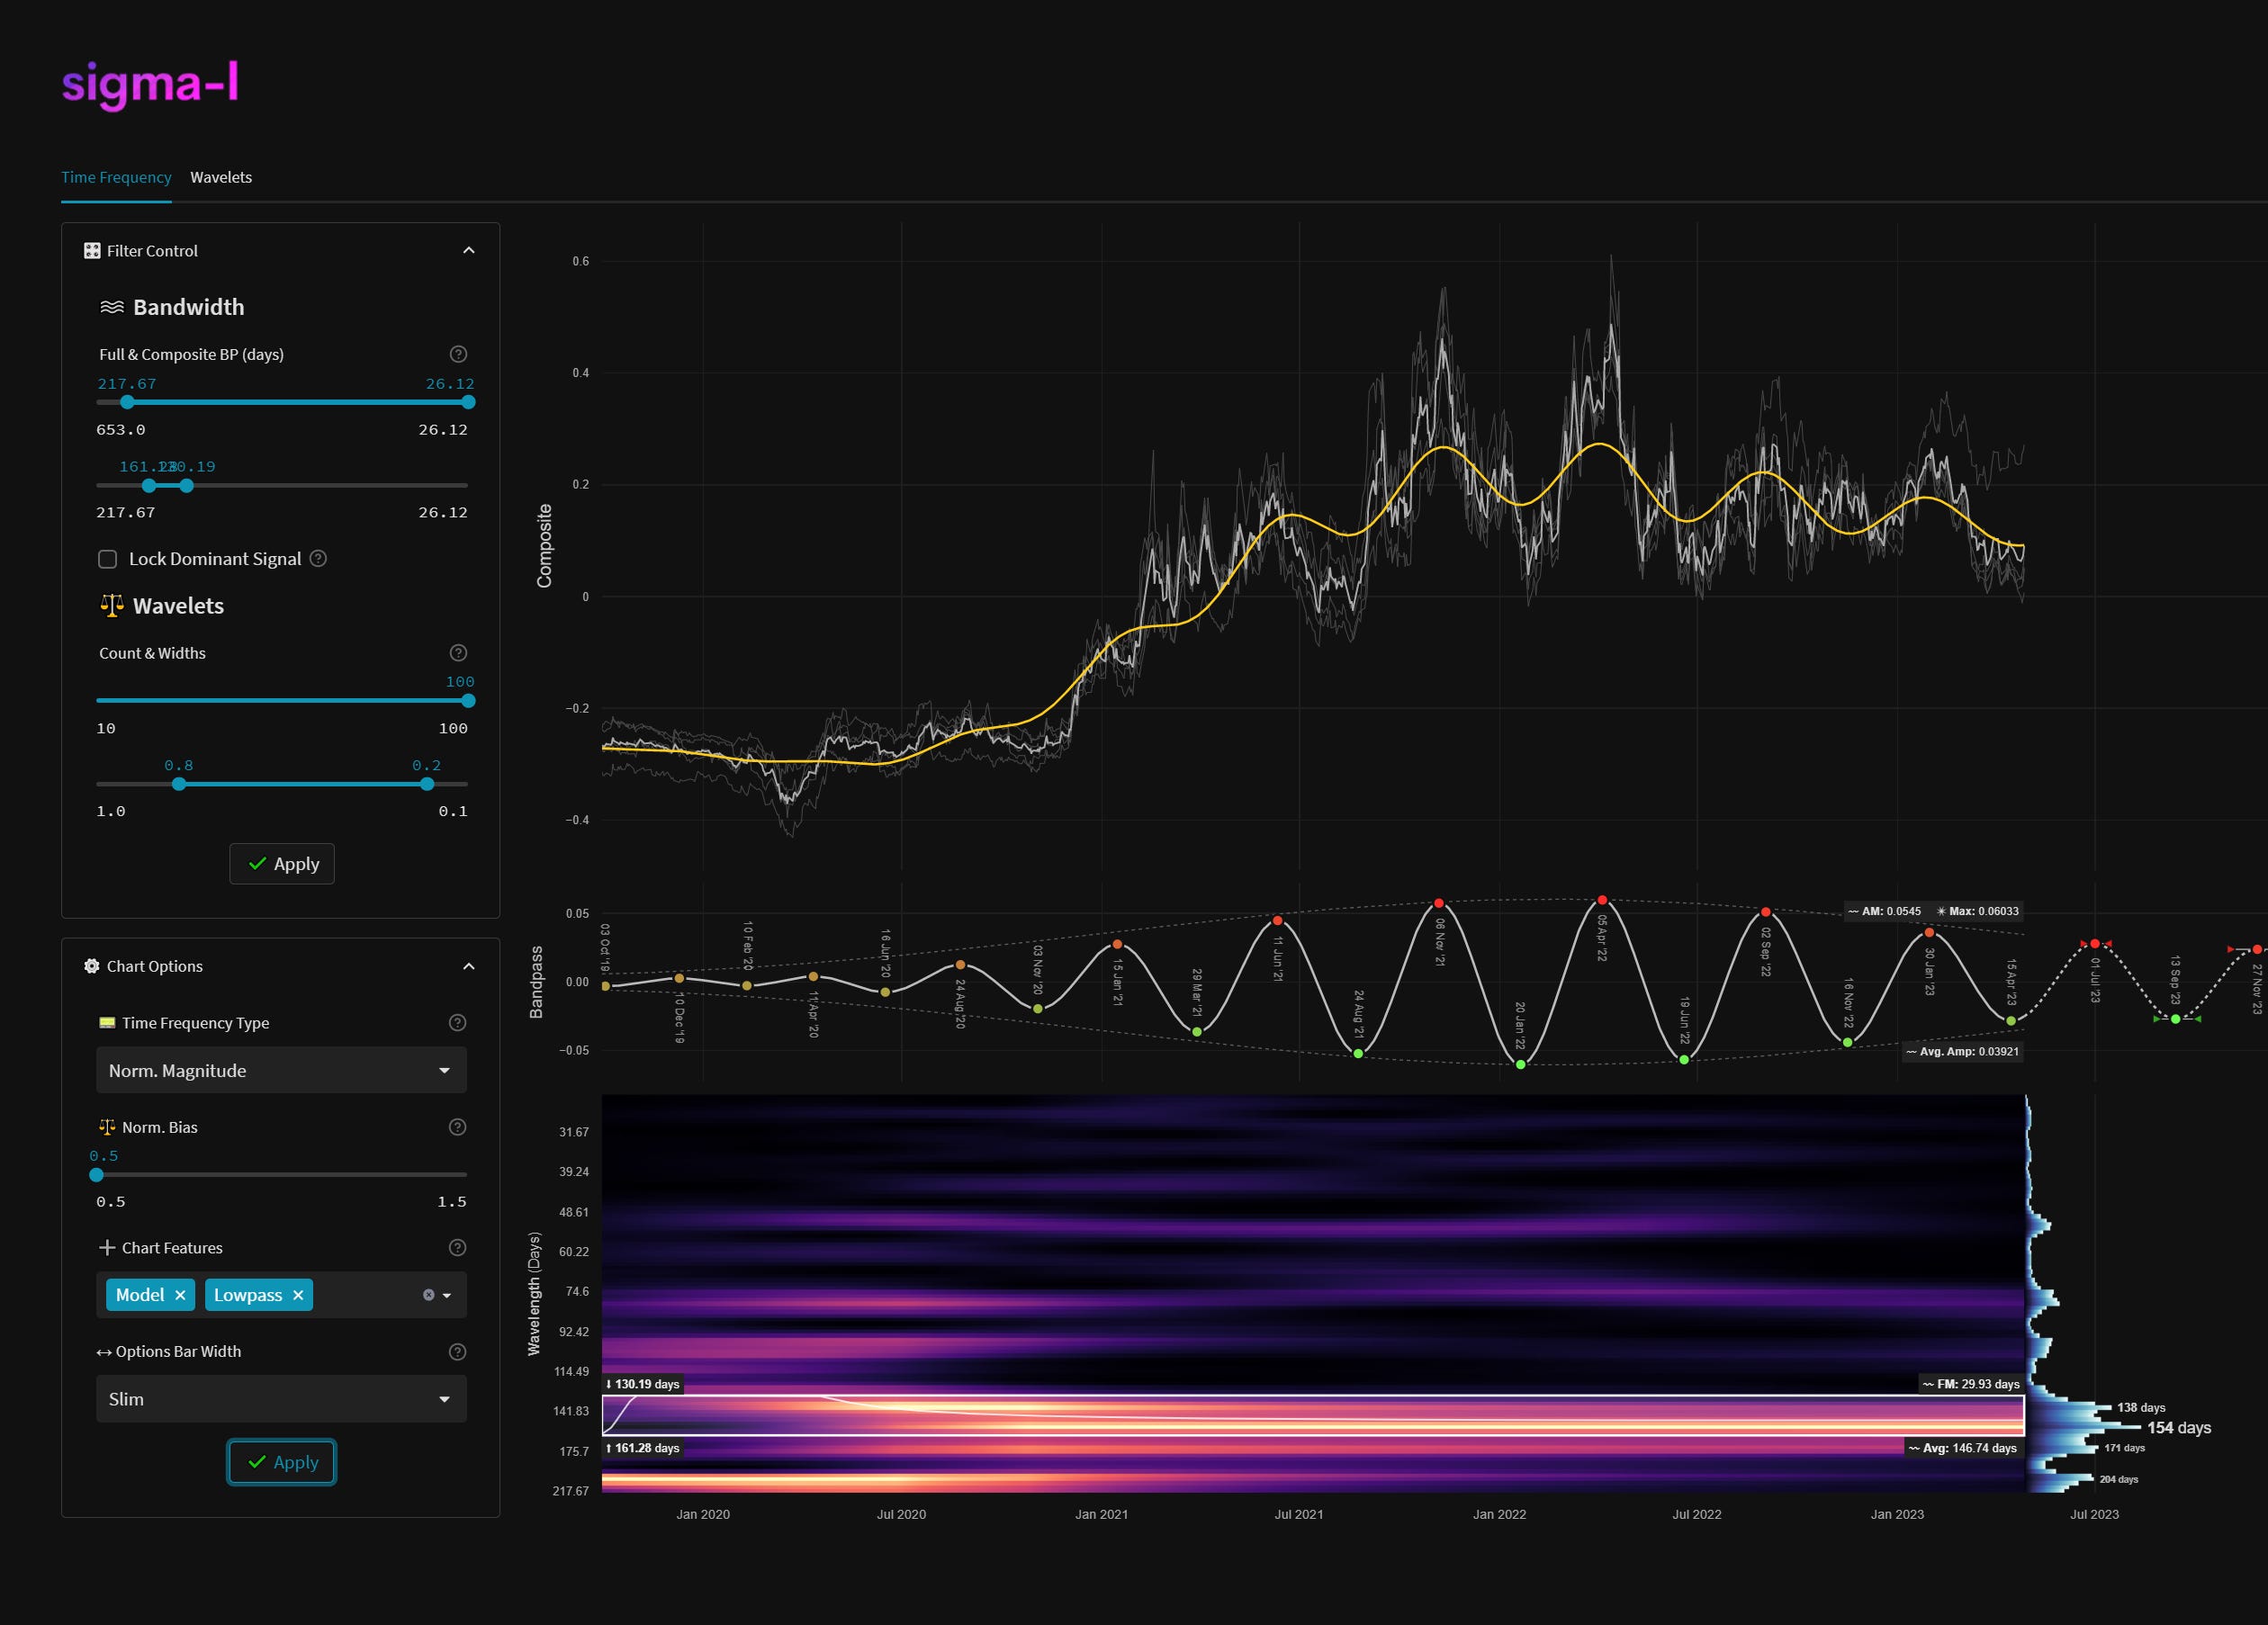
Average Wavelength: 146.74 Days
Completed Iterations: 9
Time Frequency Analysis
Time frequency charts (learn more) below will typically show the cycle of interest against price, the bandpass output alone and the bandwidth of the component in the time frequency heatmap, framed in white. If a second chart is displayed it will usually show highpassed price with the extracted signal overlaid for visual clarity.
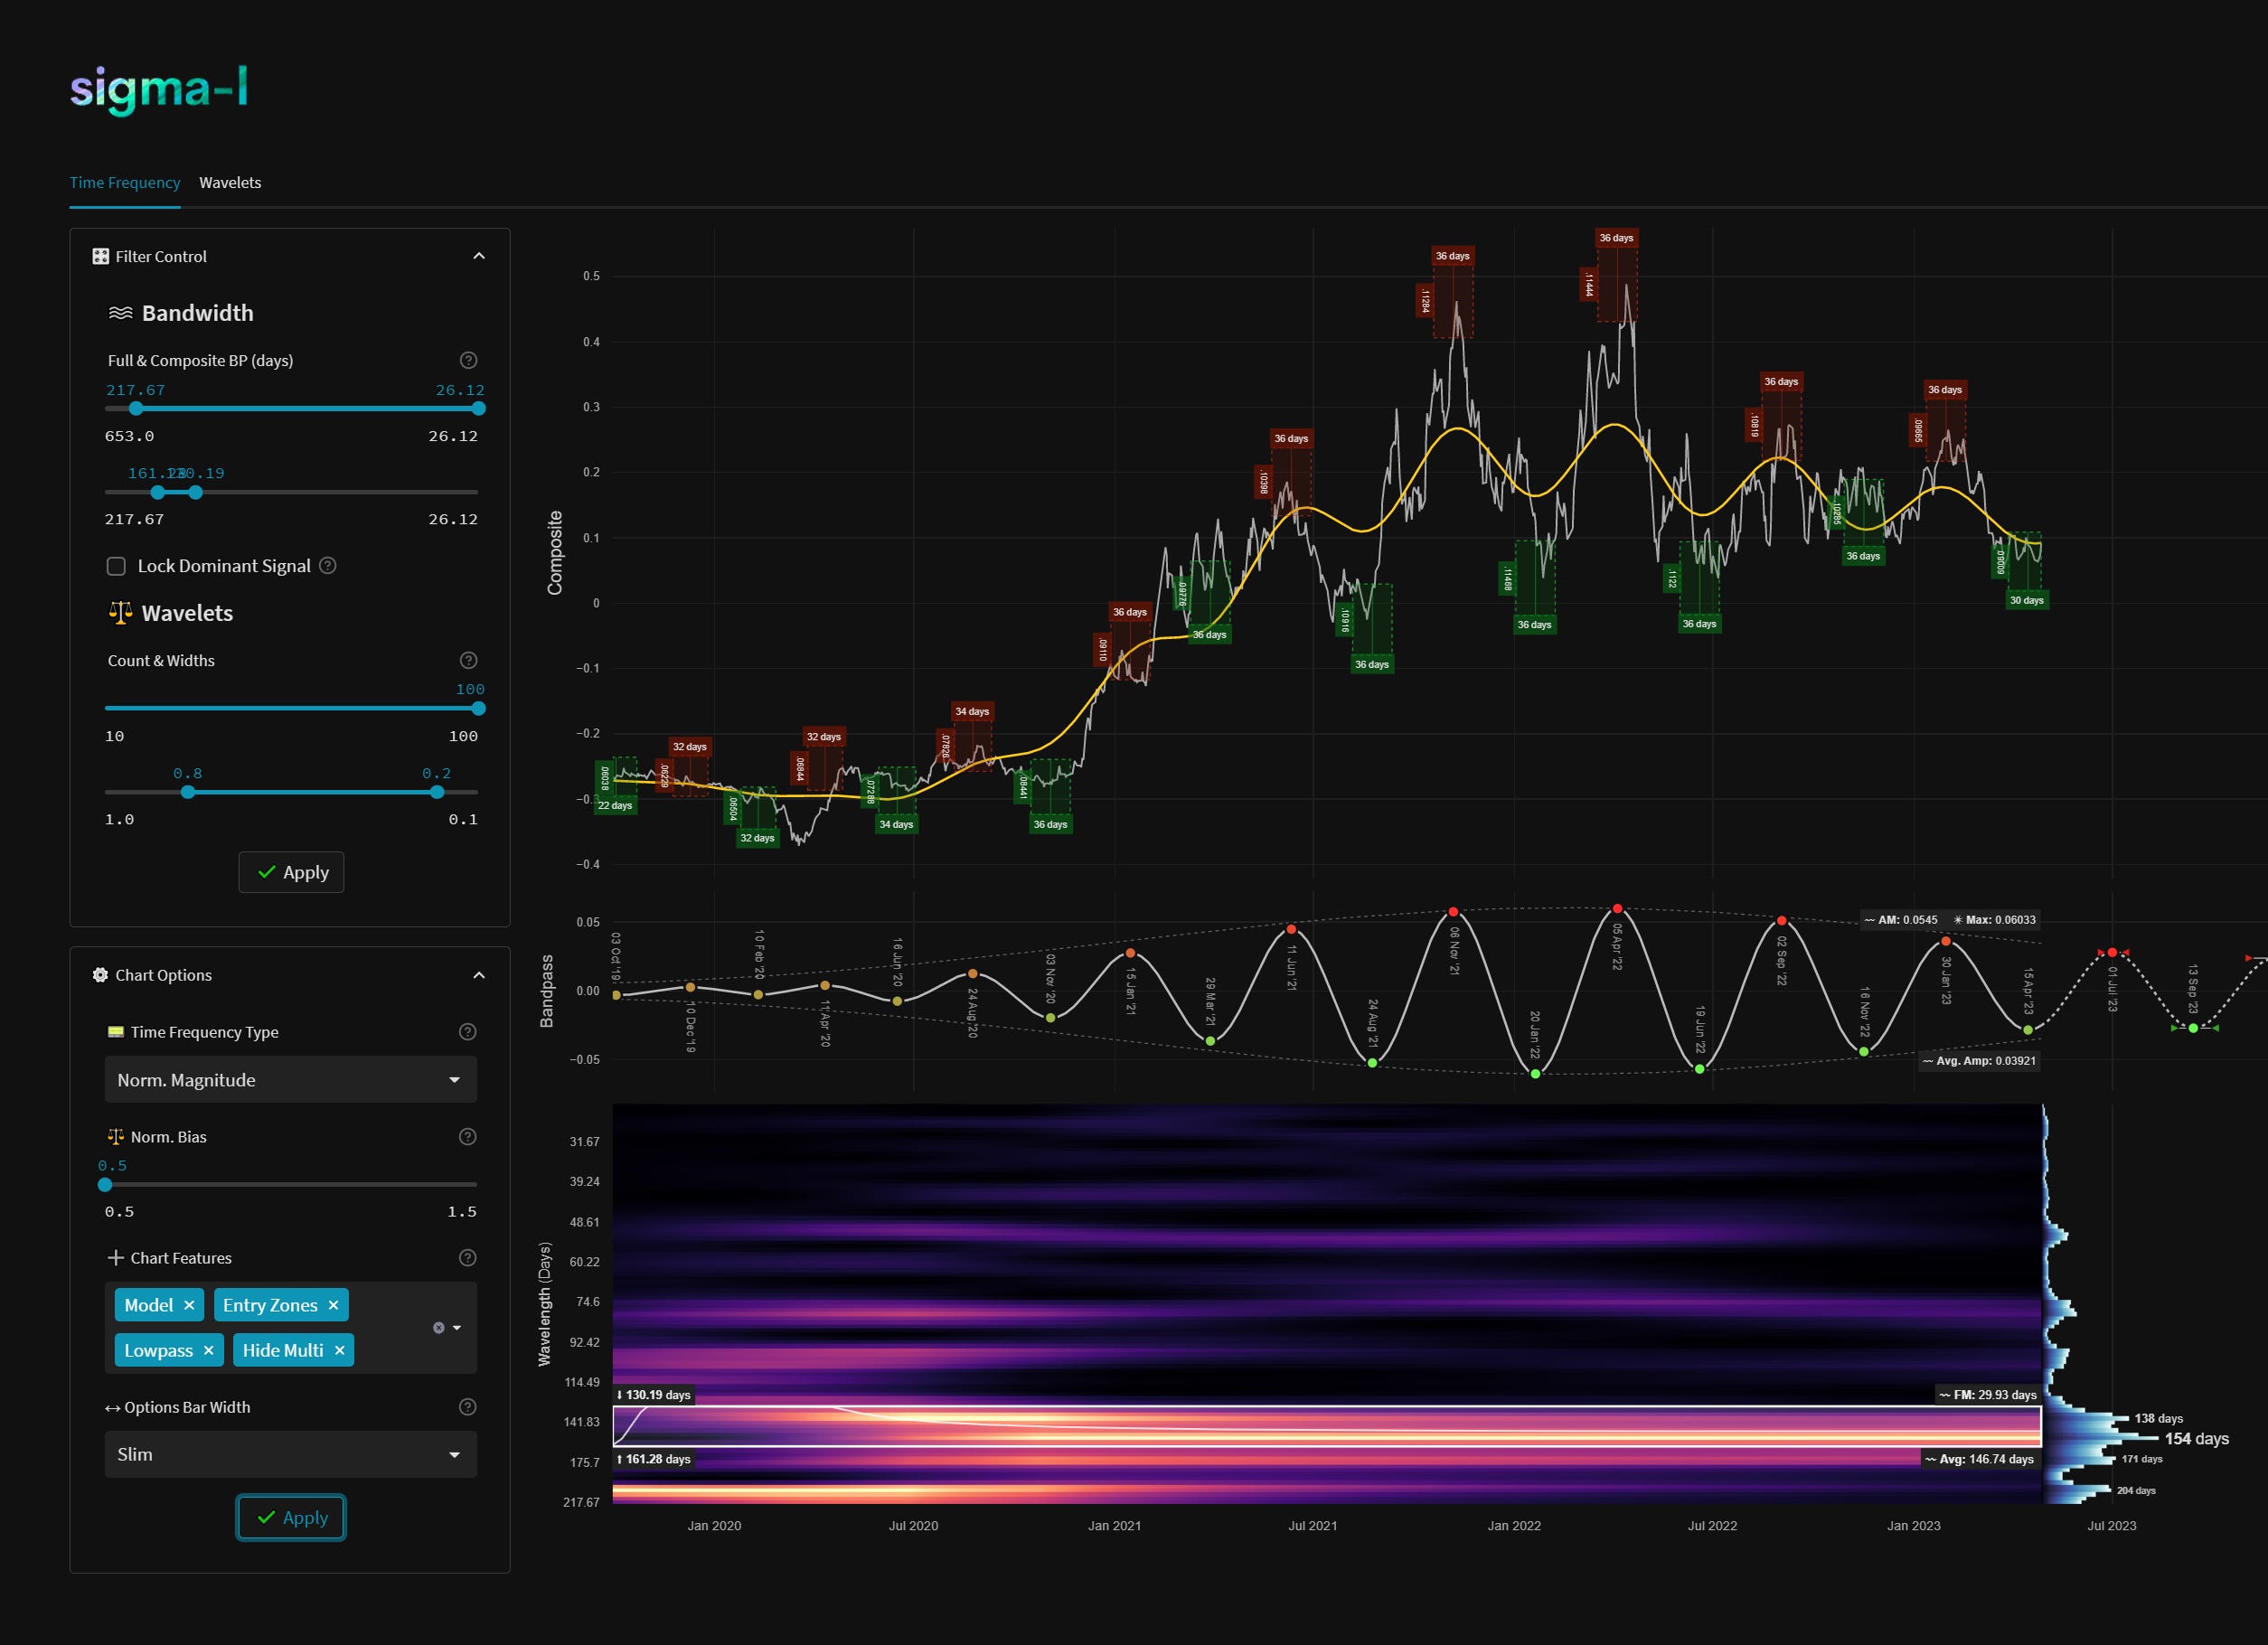
Signal Detail & Targets
Here we give more detail on the signal and our expectations for price, given the detected attributes of the component. In most cases the time target to hold a trade for is more important, given we focus on cycles in financial markets. Forthcoming trough and peak ranges are based upon the frequency modulation in the sample.
Phase: Troughing / Troughed1
FM: +- 30 Days2
AM: N/A (Composite)3
Next Trough Range: August 14th - October 13th 2023
Next Peak Range: June 1st - July 31st 2023
Sigma-L Recommendation: Buy
Time Target: ~ 1st July 2023
Price Target: N/A (Composite)
DISCLAIMER: This website/newsletter and the charts/projections contained within it are intended for educational purposes only. Results and projections are hypothetical. We accept no liability for any losses incurred as a result of assertions made due to the information contained within Sigma-L. This report is not intended to instruct investment or purchase of any financial instrument, derivative or asset connected to the information conveyed in the report. Trade and invest at your own risk.
Signal Phase: This is ‘how far along’ the cycle is in it’s period at nowtime and is related to the predicted price action direction.
Signal Frequency Modulation: This is how much, on average, the signal detected varies in frequency (or wavelength) over the whole sample. A lower variance is better and implies better profitability for the component. Frequency usually modulates relatively slowly and over several iterations.
Signal Amplitude Modulation: This is how much the component gains or loses power (price influence) across the sample, on average. Amplitude modulation can happen quite quickly and certainly is more evident than frequency modulation in financial markets. The more stable the modulation the better.