

Gold: Hurst Cycles - 15th December 2022
Gold has likely established an 18 month nominal low, a higher low at the 20 week component early 2023 confirmation. In this report we look out some new features of our analysis and the latest moves

Tools required: Nominal Model | FLD | FLD Trading Strategy | FLD Trading Strategy (Advanced) | Principle of Nominality | Underlying Trend
Analysis Summary
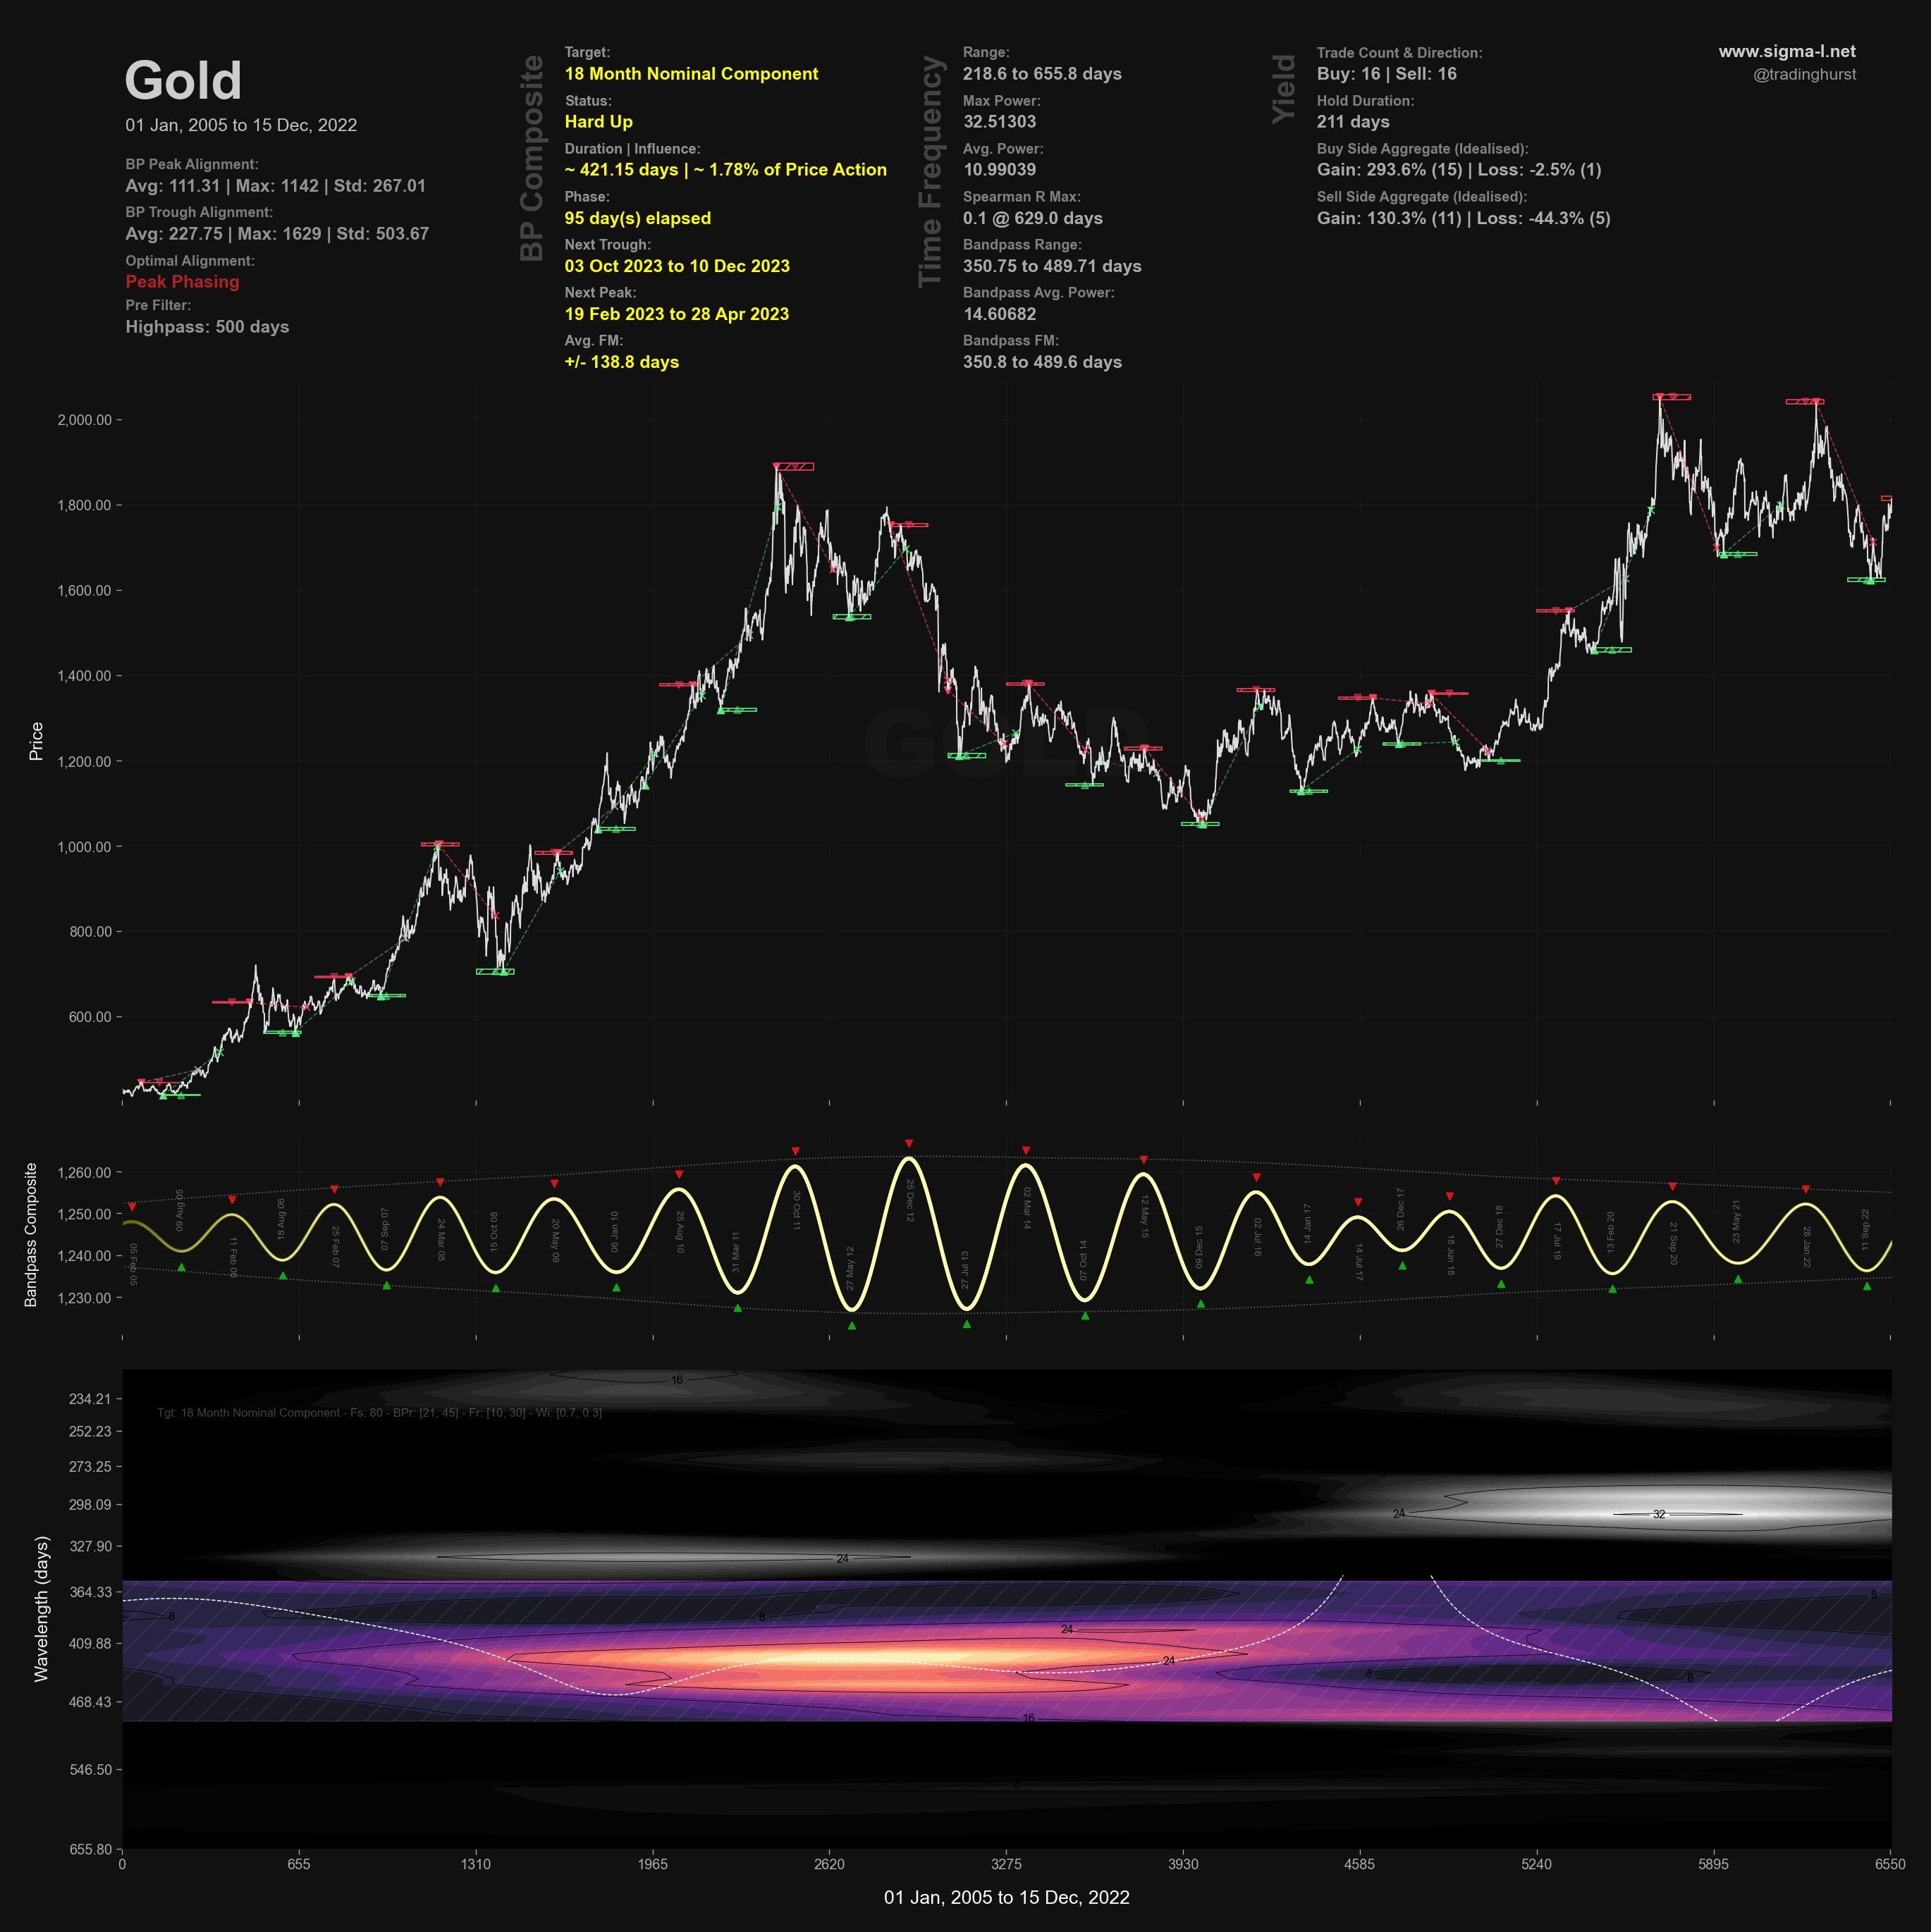
We discussed the possibility of the 18 month nominal low occurring in late September during our last report into Gold and this is now most likely the case. Price has made a significant move from that low and the wavelength of the component is well in line with the average from a time frequency analysis. That average is around 15 months in duration. Accordingly we have adjusted the phasing on Sentient Trader to reflect this. The position of larger components, most notably the 4.5 year component, is uncertain but if we are to have a bias it is to the downside with the next trough of that wave due in early 2024.
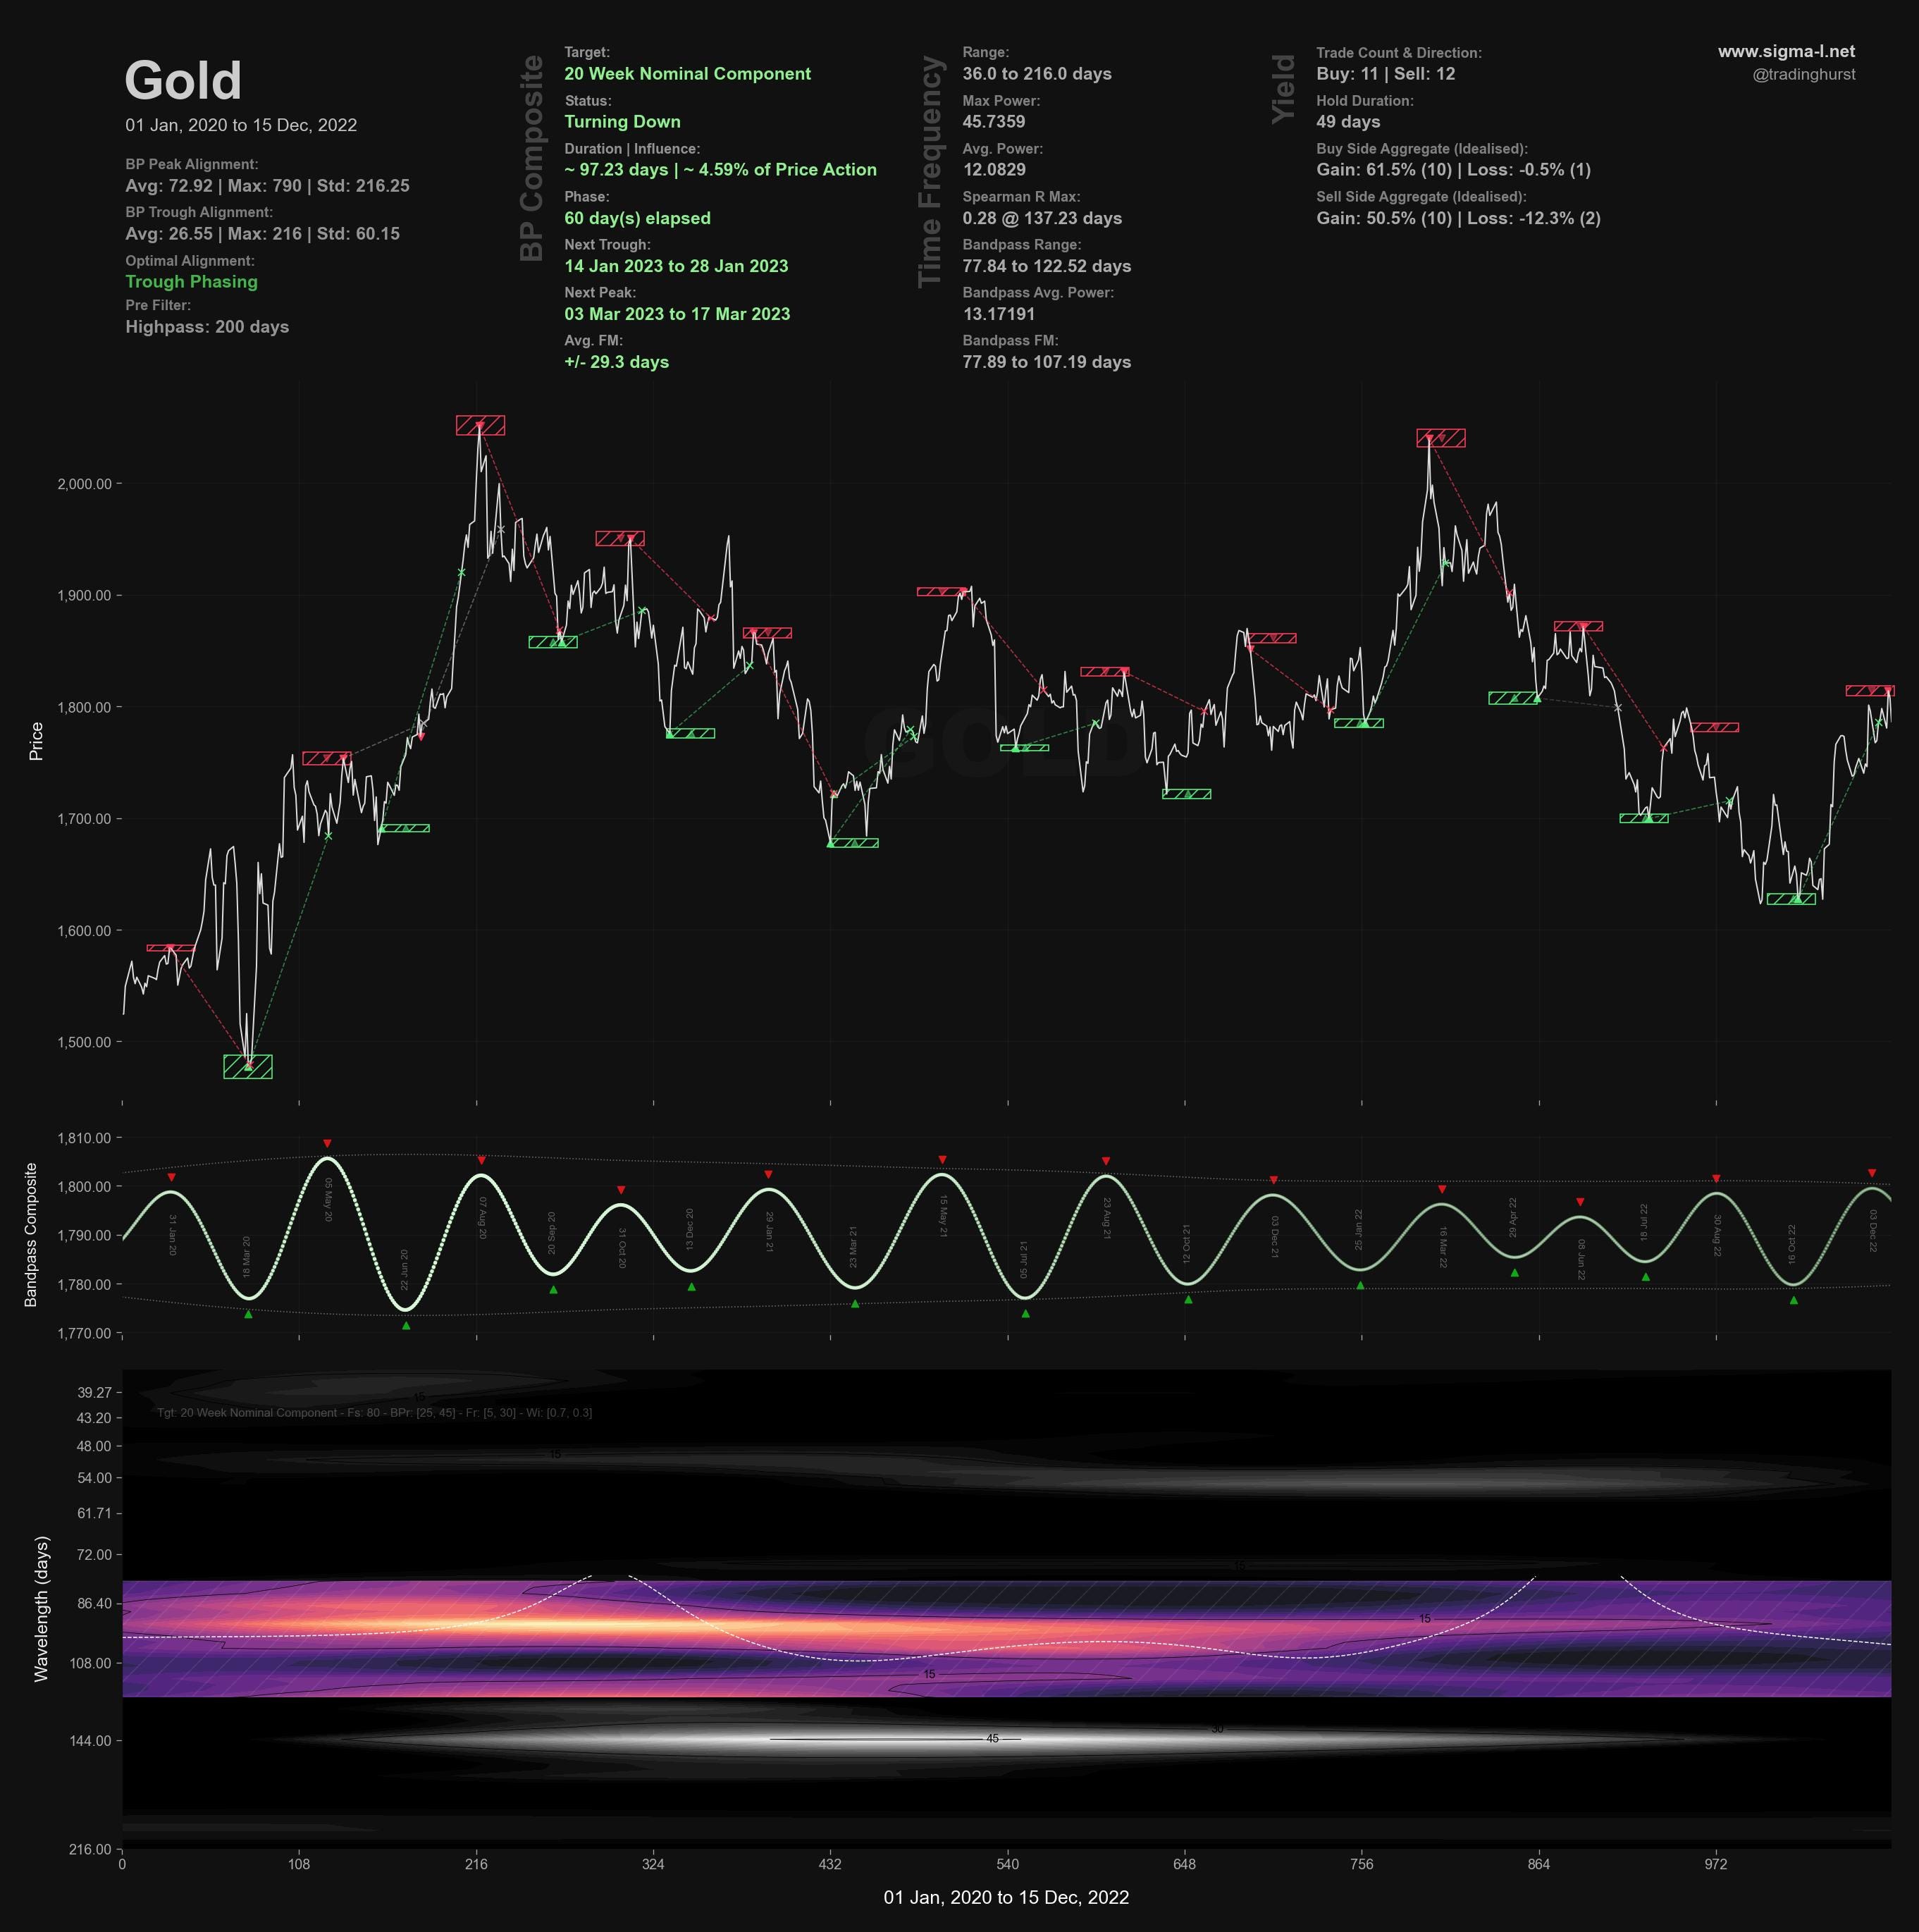
Being relatively early in this current 18 month iteration we must await further evidence prior to confirming the low in September more formally. That will likely come at the 20 week nominal low, due February according to the Sentient Trader phasing in the main. A significantly higher low for the 20 week component, forming a bullish shape, would begin to bias our longer term phasing to placing the 4.5 year nominal low in September. However our current view, as mentioned above, that the larger low is to come in 2024. A price move to the 20 week nominal low that retraces beyond 50% of the recent move up would maintain that bias strongly. The 40 week component low is due mid 2023.
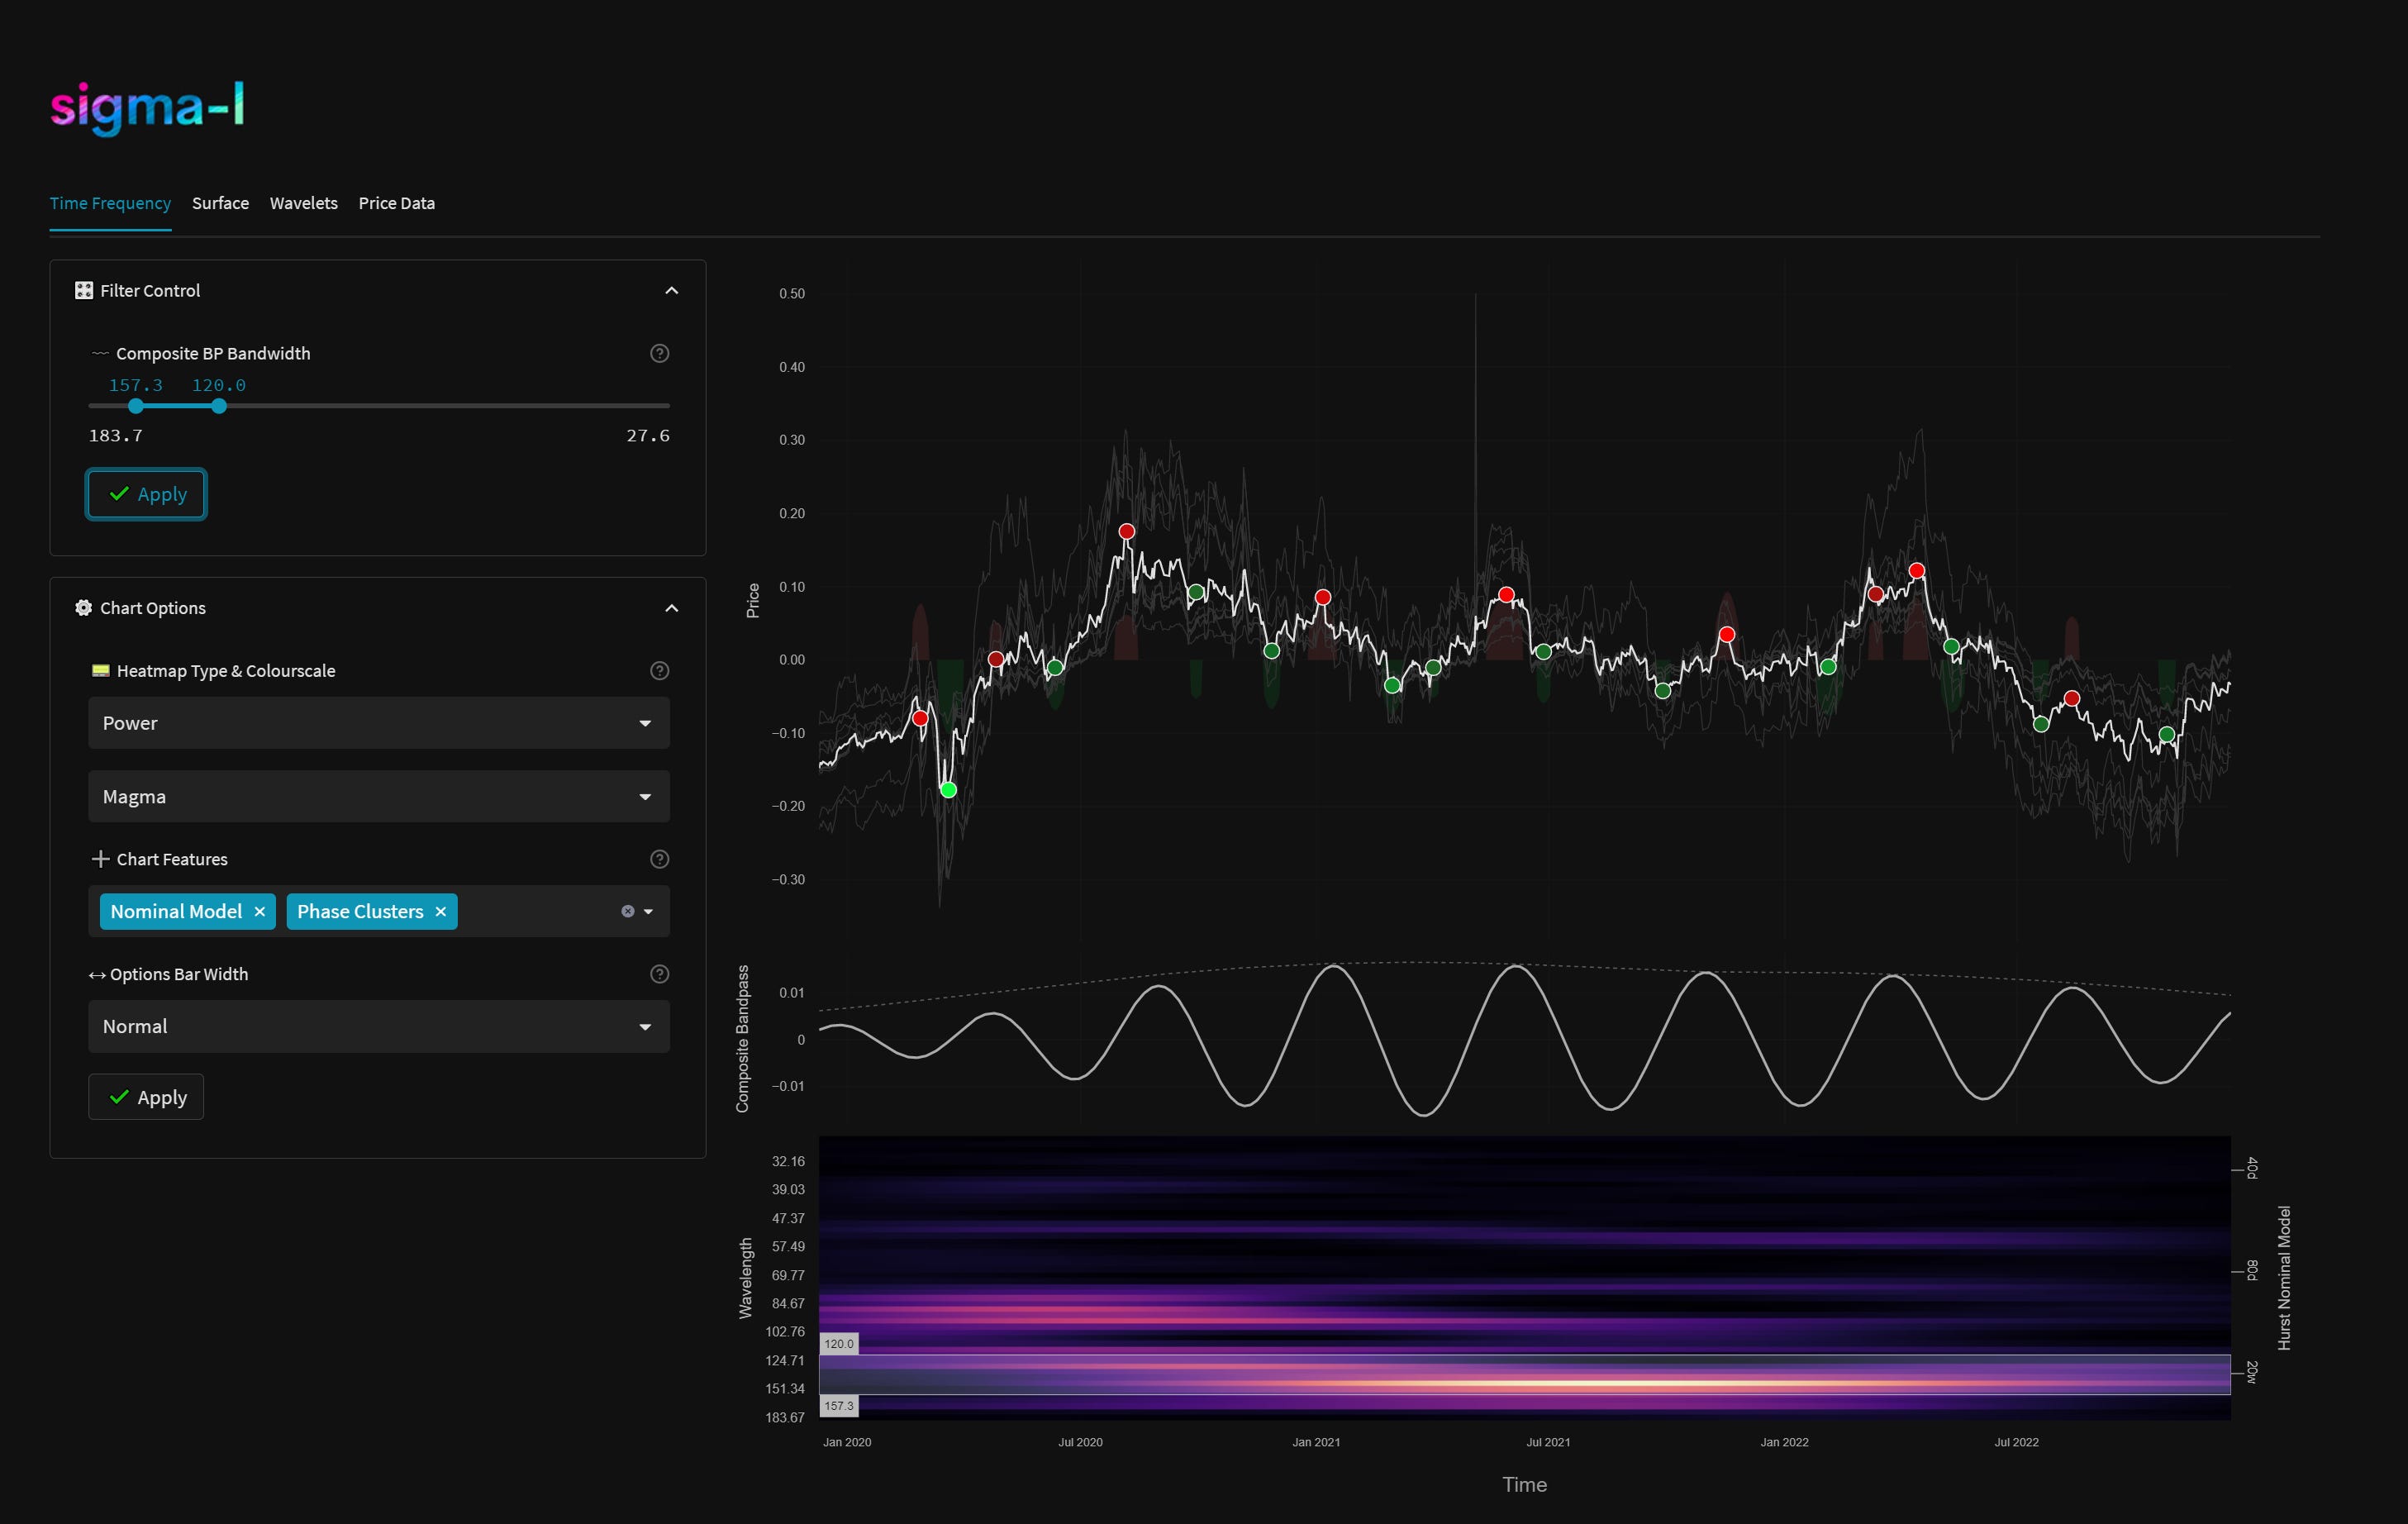
Our new analysis method allows a time frequency analysis of a composite index of related commonality instruments. This is done by firstly taking a time domain average of components in the index and then performing complex Morlet wavelet convolution on that time series. In Gold this includes several mining stocks and related ETFs. Below is the 20 week component extraction. The advantage of this kind of compositing is the signal to noise ratio of any periodic components is increased by the process of simple time domain averaging. Doing this prior to a time frequency analysis is helpful.
In addition, we have the ability to also show phase correlations across the frequency range specified (in the below example from around 27 days to 183 days). We will be explaining more about this in due course but, in short, it allows us to see which components are acting synchronously to produce peaks or troughs. It is a manifestation of Hurst’s ‘principle of synchronicity’. For a quick interpretation we have added coloured circles at periods of high synchronisation, the lighter the shade the more components are synchronised at that point. Phase correlations allow us to ignore the power of each component, defined as they are by the 1/F nature of financial market spectra and instead focus only on timing.

Phasing Analysis
Sentient Trader
Utilising a pattern recognition algorithm and Hurst’s diamond notation


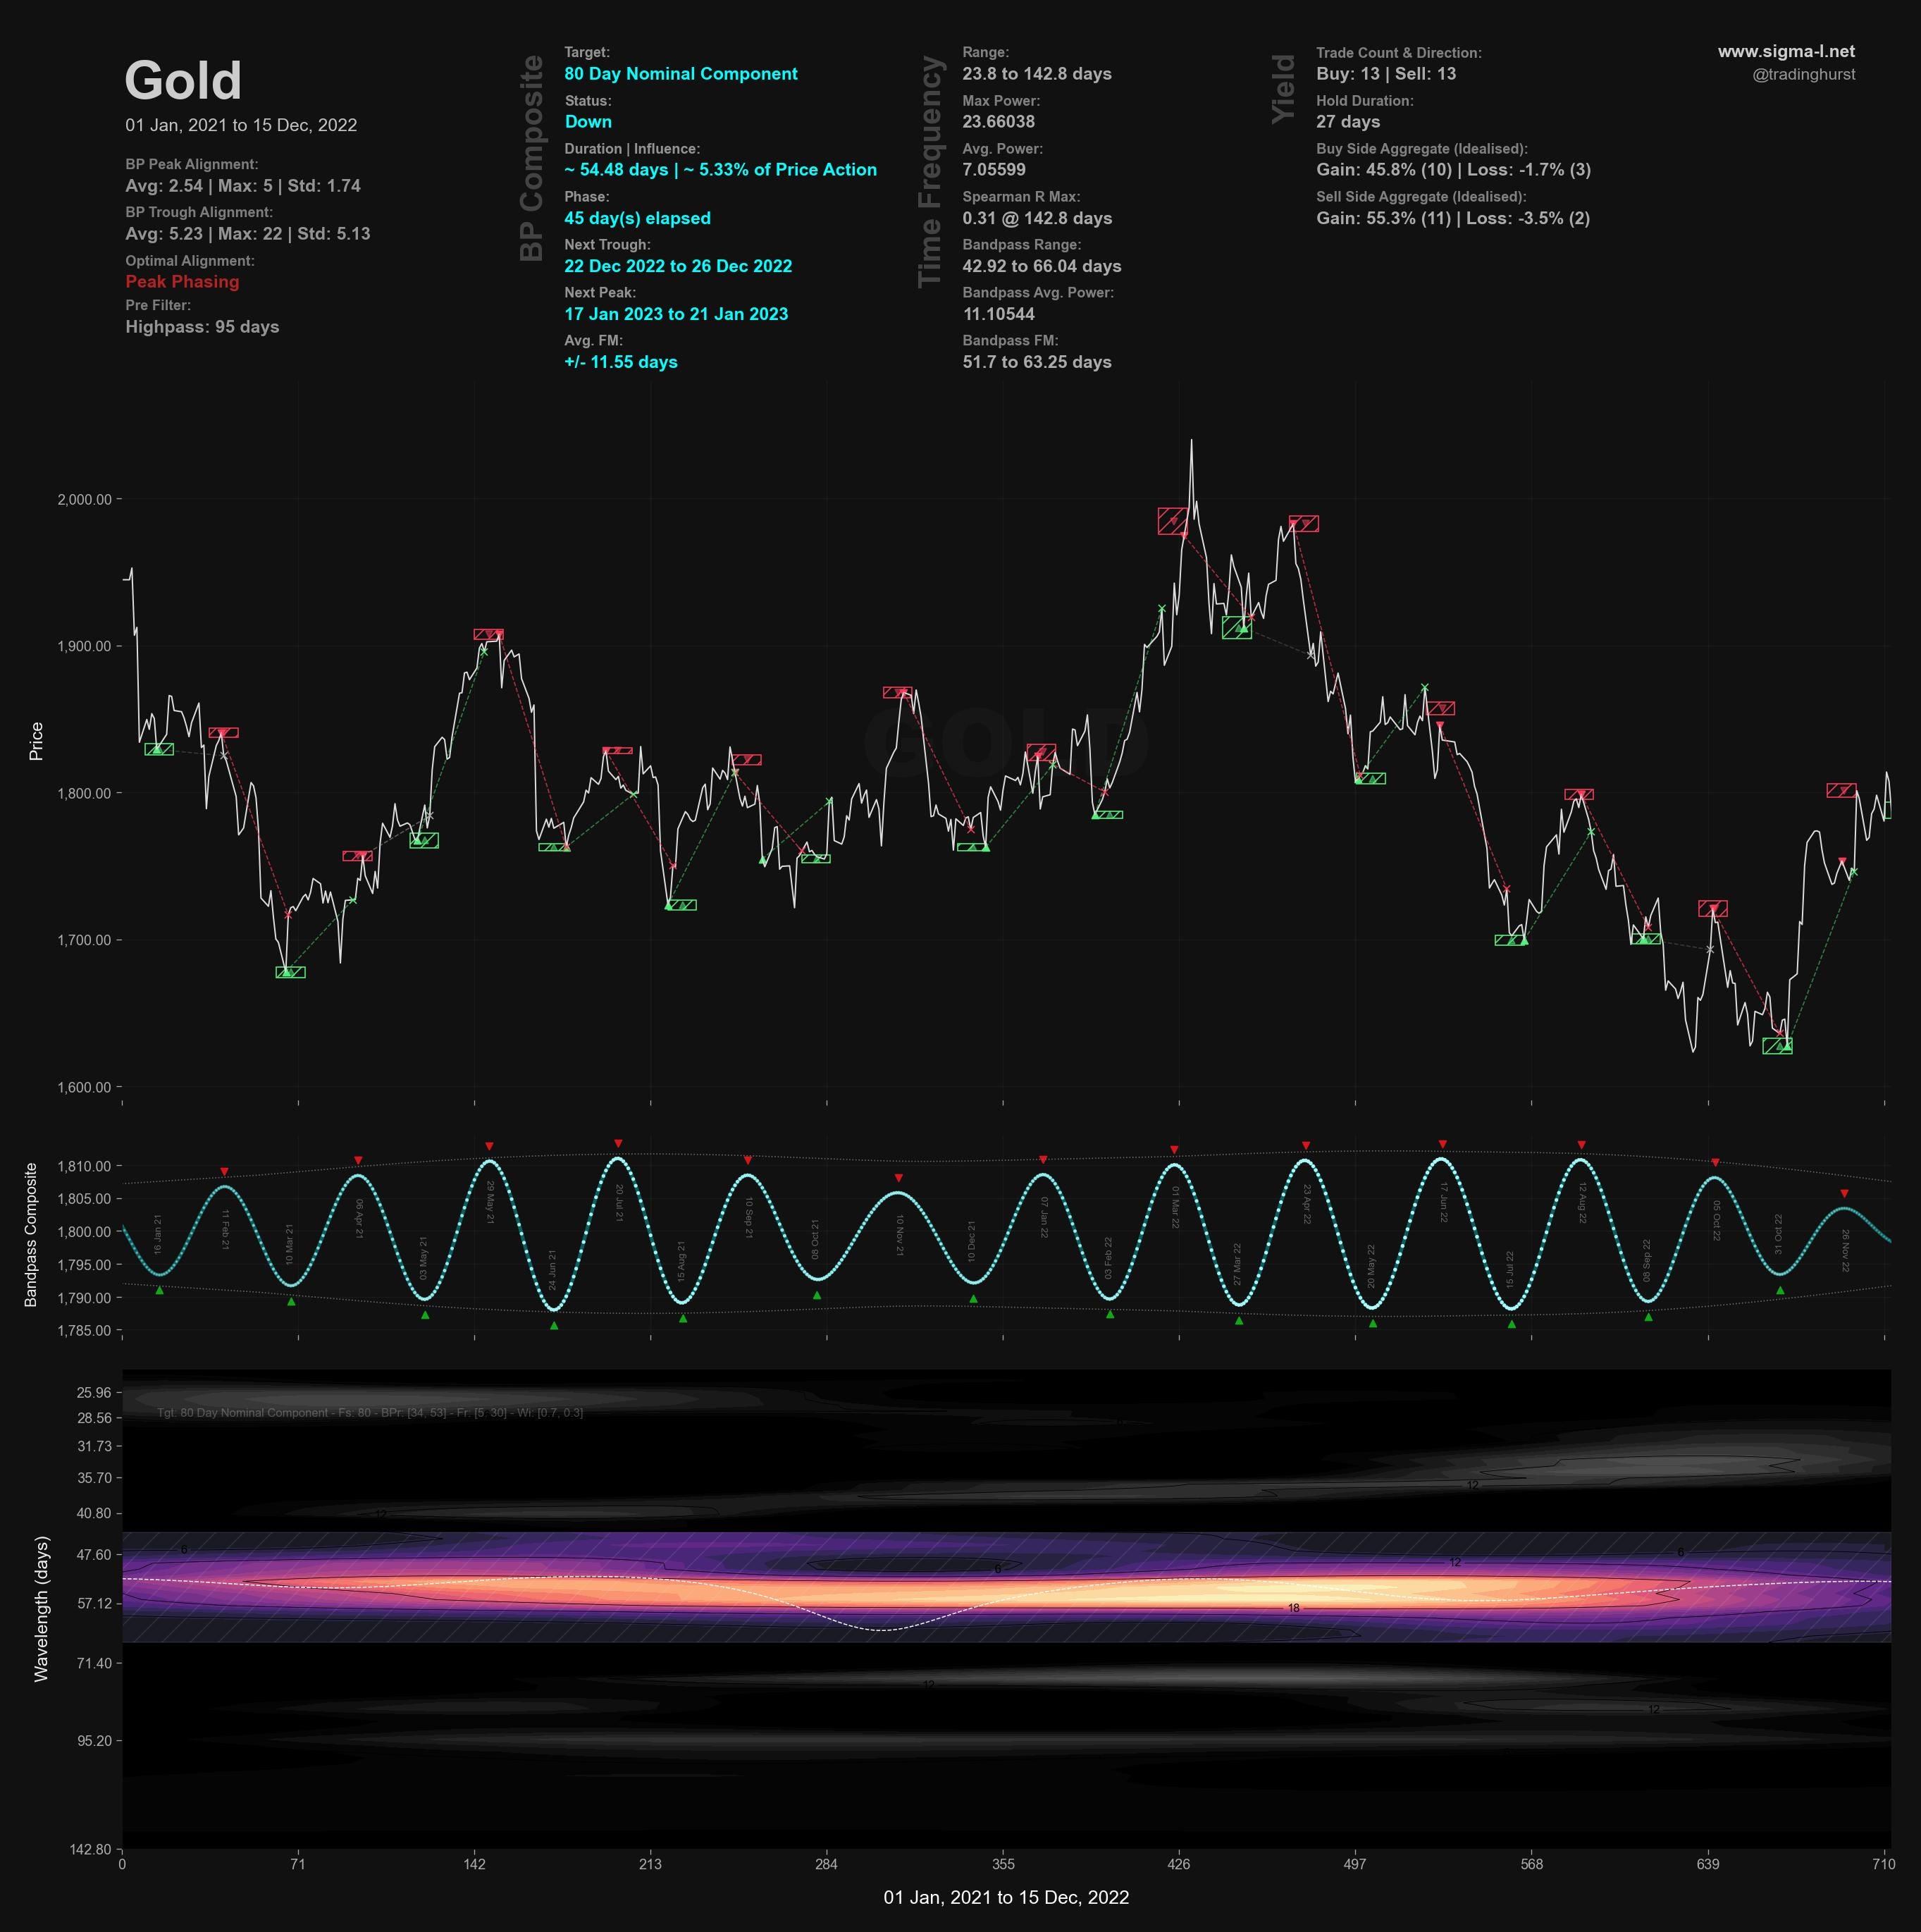
Time Frequency Analysis
Wavelet convolution targeting 18 month, 20 week and 80 day nominal components
Trading Strategy
Interaction Status
Interactions and price in the FLD Trading Strategy (Advanced). This looks at an idealised 40 week cycle and an array of 3 FLD signal cycles. We apply the instrument’s phasing to the model and arrive at an overall summary for the interactions with the 20 day FLD, current and forthcoming.

Sigma-L recommendation: Risk Sell / No Trade
Entry: 20 Day FLD
Stop: Above forming 20 week nominal peak
Target: ~1740 (80 day FLD support)
Reference 20 Day FLD Interaction: D2 / F2
Underlying 40 Day FLD Status: F
Underlying 80 Day FLD Status: D
A risk sell is a fair assessment here in Gold, assuming the 20 week component has peaked. While a better risk:reward entry long may be available at the 20 week nominal low to come it is may be viable to exploit this move in the event that the 18 month component will be bearish.
FLD Settings
If you do not have the use of Sentient Trader use these settings to plot common FLDs in your trading software (daily scale) to more easily follow trading signals and strategy from Sigma-L.
Make sure to account for non-trading days if your broker omits them in the data feed (weekends, for example). The below offsets are given with no added calculation for non-trading days.
80 day nominal: 71 days | 35 day FLD offset
40 day nominal: 33.8 days | 17 day FLD offset
20 day nominal: 17 days | 9 day FLD offset
10 day nominal: 8.6 days | 4 day FLD offset
Correlated Exposure
A non exhaustive list of correlated instruments for consideration
SPDR Gold Shares iShares Gold Trust IAU 0.00%↑
SPDR Gold MiniShares Trust GLDM 0.00%↑
Aberdeen Physical Gold Shares ETF SGOL 0.00%↑
Granite Shares Gold Shares BAR 0.00%↑
VanEck Merk Gold Trust OUNZ 0.00%↑
Goldman Sachs Physical Gold ETF AAAU 0.00%↑
ProShares Ultra Gold UGL 0.00%↑
Invesco DB Precious Metals Fund DBP 0.00%↑
Invesco DB Gold Fund DGL 0.00%↑
wShares Enhanced Gold ETF WGLD 0.00%↑
Barrick Gold Corporation GOLD 0.00%↑
Newmont Goldcorp NEM 0.00%↑
Wheaton Precious Metals WPM 0.00%↑
VanEck Junior Gold Miners ETF GDXJ 0.00%↑
VanEck Gold Miners ETF GDX 0.00%↑
Franklin Responsibly Sourced Gold ETF FGLD 0.00%↑
Amplify Pure Junior Gold Miners ETF JGLD 0.00%↑
Pleased with myself David, as I'd picked this one already although I've already phased the 54M low in September (can adjust later if necessary).
I'll be waiting for a long from the 20W NOLs at the 20W FLD support if the bullish scenario plays out.