

DJIA: Hurst Cycles - 20th December 2022
After the formation of the 18 month nominal low an excellent signal at the 20 week component is guiding us. Has the peak formed of this wave? We look at the FLD evidence and time frequency analysis.

Essentials: Nominal Model | FLD | FLD Trading Strategy | FLD Trading Strategy (Advanced) | Principle of Nominality | Underlying Trend | Time Frequency Analysis
Analysis Summary
Whilst the S&P 500 and Nasdaq have responded meekly to what is highly likely to be the 18 month nominal low, formed in October, the DJIA has rocketed. No doubt this is due to the constituents but it once again highlights the need to use commonality in our analysis to increase the signal to noise ratio for periodic components.
At our last report we mentioned how the shape of this next 20 week component will give clues as to the underlying trend present:
From 1st November Report:
What is interesting now is how this next 20 week component unfolds in cyclical terms via price action. The initial move has been exuberant, in fact the DJIA has had one of the most bullish reactions of all global equity indices, due to it’s composition. If price forms a fairly neutral 20 week component (perhaps a slightly higher low) then the longer term bearish outlook via the current long term phasing is likely correct.
It is likely, in our view, that price will form the 20 week nominal low once again at the 54 month FLD (long term chart below), following / tracking resistance at the 18 month FLD, which price is now sitting under. This low is due early February, according to the current phasing, around 31000. At that point price may well bounce once more before the start of a wider bearish move to the 40 week nominal low, expected May / June 2023. Clearly if the underlying trend is bearish and the low in 2020 was indeed of 4.5 year magnitude, the final 18 month component of that wave will likely be more bearish than the last. Strap in.
The 20 week FLD cross target for the DJIA is up at around 36000 (from Sentient Trader) so has been heavily missed thus far. A 20 week component that forms a neutral to slightly bullish cycle shape in February 2023 and has missed it’s FLD cross target (at that point) is further evidence of underlying bearish influence. The trough of the 20 week FLD formed on the 29th of November, almost directly below the recent price peak, proposed to be of 20 week magnitude.
An FLD trough that forms directly below a price peak indicates a net neutral underlying trend for that component. This is the first of four 20 week components which, together, comprise the 18 month nominal component.
At the shorter term the 80 day component has been heavily attenuated in the linear move upwards. It is possibly occurring now or occurred in a very bearish manner at the previous 20 day component low, around the 6th December. An occurrence now is entirely within the margin of error (or frequency modulation!) of the 80 day nominal component over the sample period. Indeed in our time frequency analysis at the shorter term scale we found the 40 day component (at around 36 days average wavelength) is a compelling signal. A trough of that component is expected to occur imminently. Should the 80 day component low move up from here, a test of the peaks and the 18 month FLD around 34000 - 34500 is likely, prior to an excellent shorting opportunity early 2023 for the move to the 20 week nominal low.
Phasing Analysis
Sentient Trader
Utilising a pattern recognition algorithm and Hurst’s diamond notation


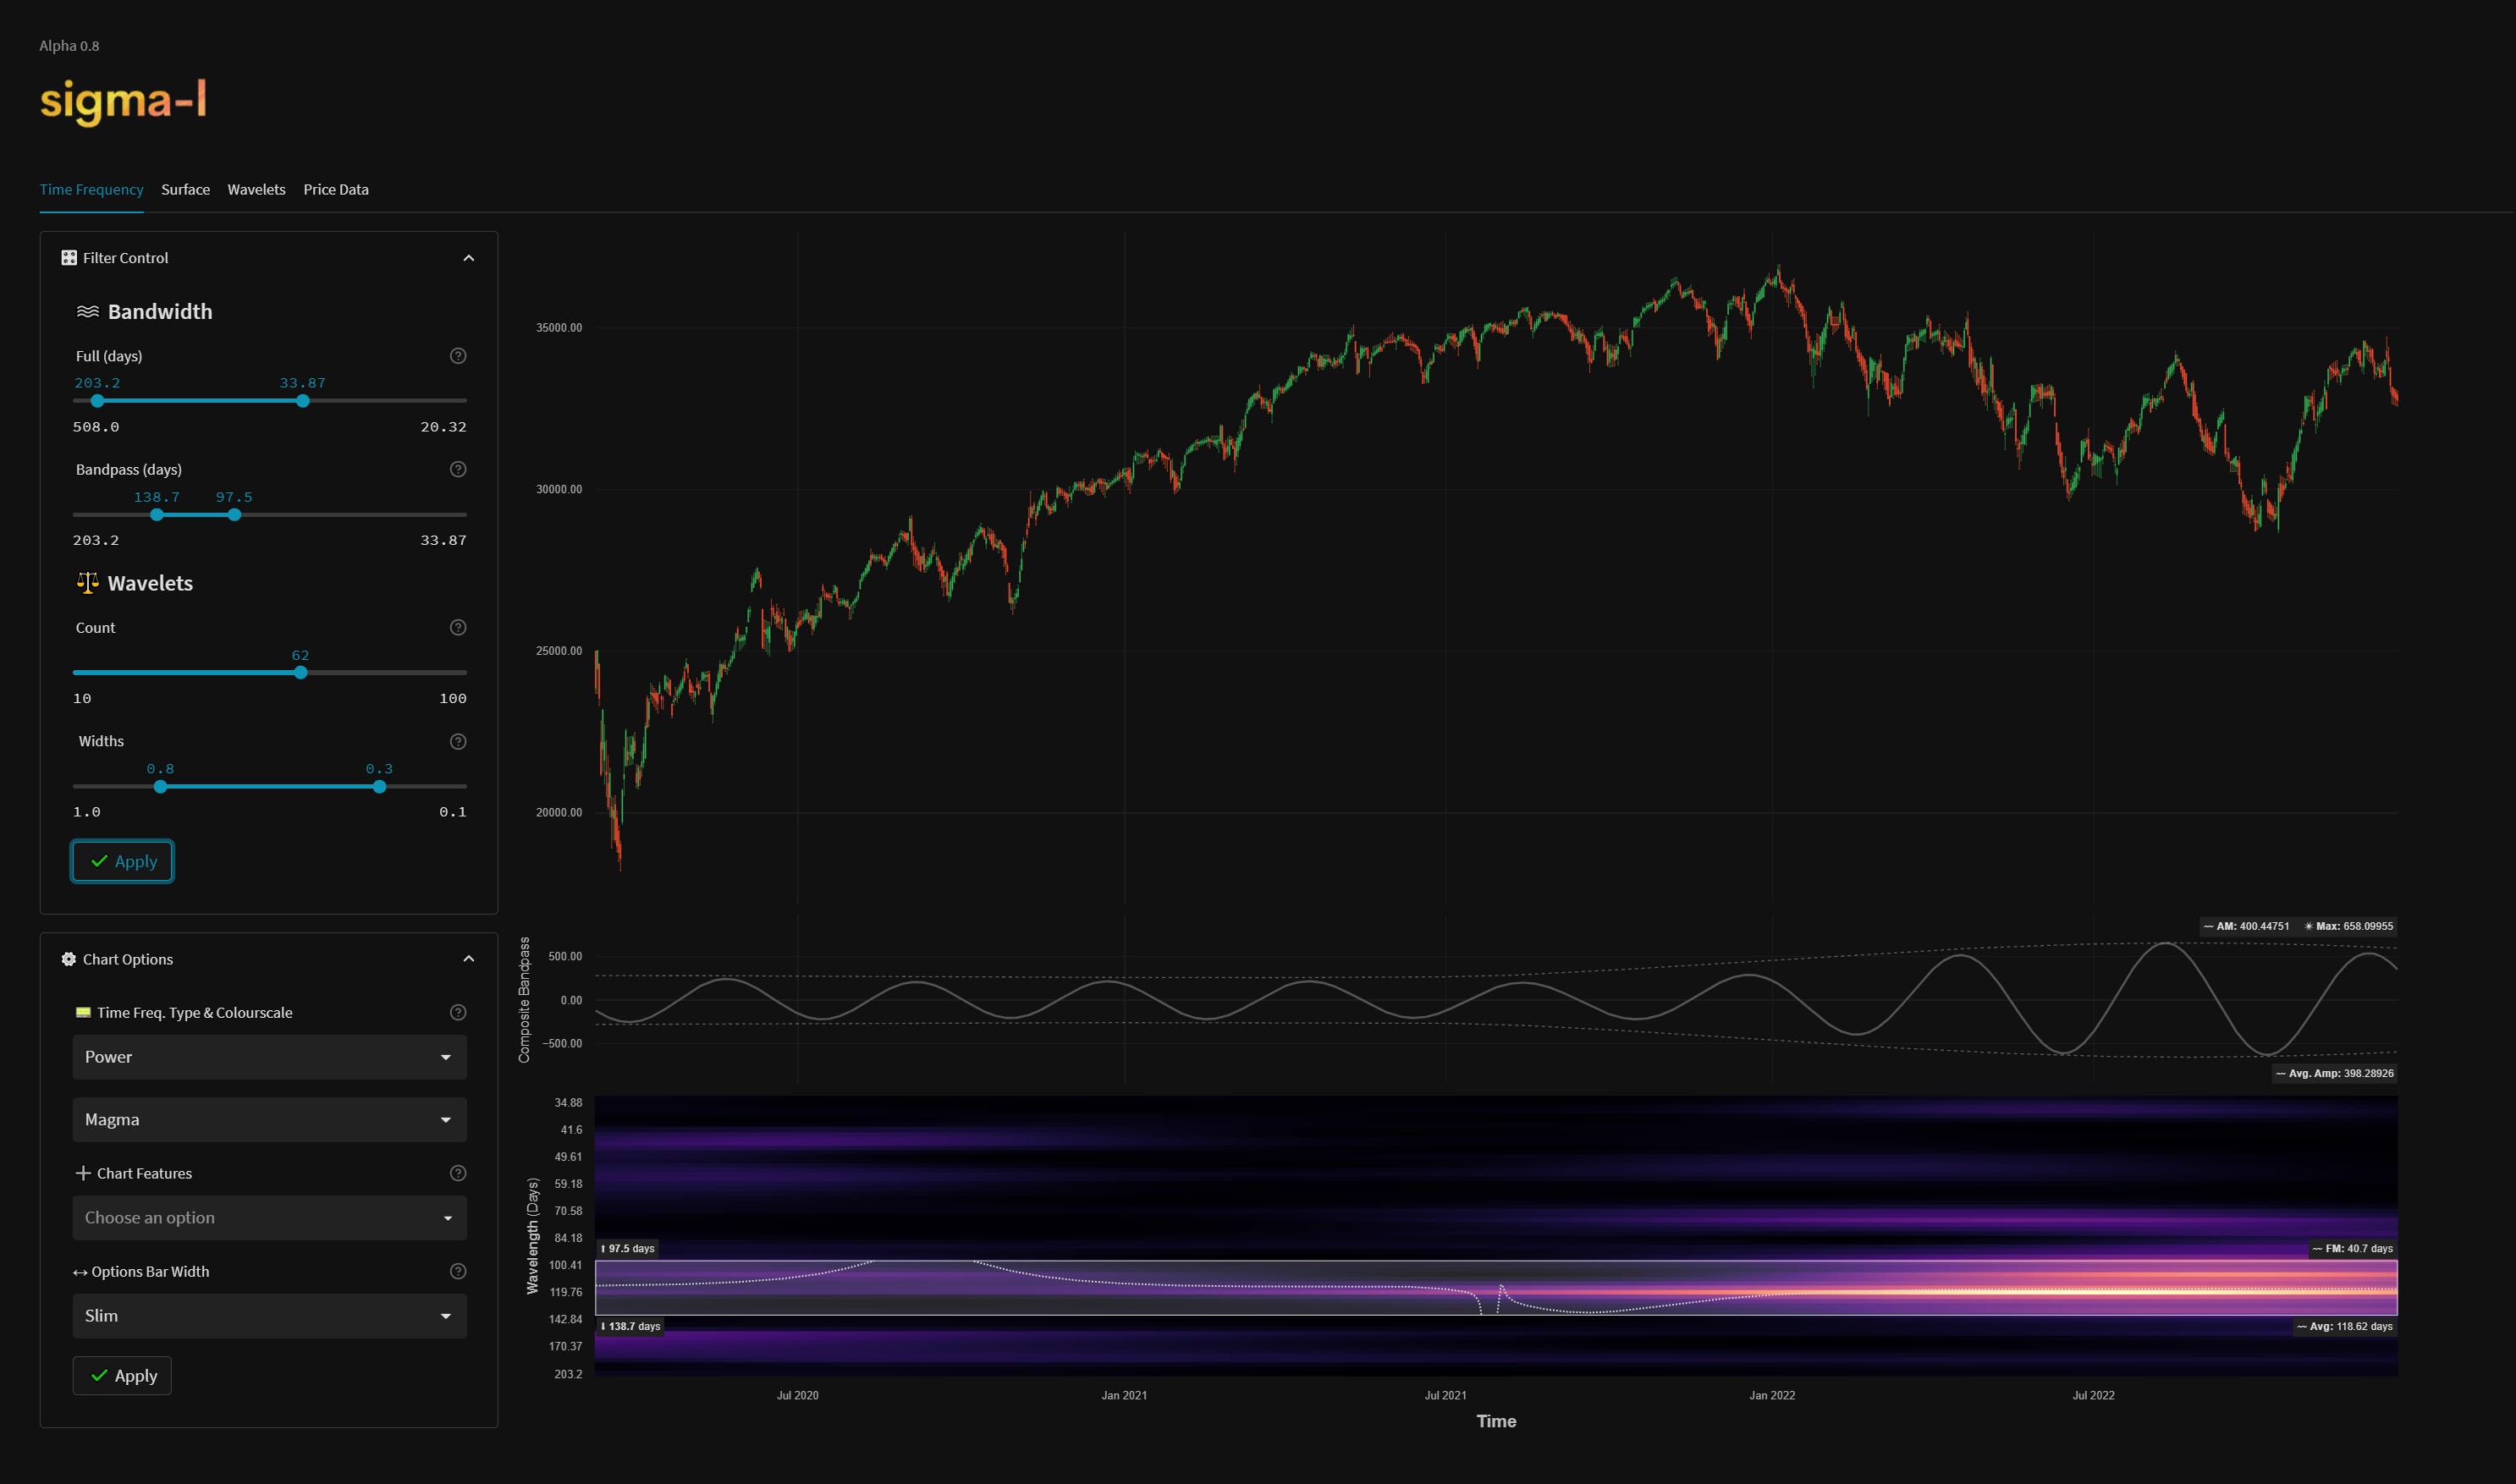
Time Frequency Analysis
Wavelet convolution targeting the 20 week nominal component

Trading Strategy
Interaction Status
Interactions and price in the FLD Trading Strategy (Advanced). This looks at an idealised 40 week cycle and an array of 3 FLD signal cycles. We apply the instrument’s phasing to the model and arrive at an overall summary for the interactions with the 20 day FLD, current and forthcoming.

Sigma-L recommendation: Risk Buy
Entry: 10 Day FLD / 20 Day FLD
Stop: Below forming 40 day nominal low
Target: 34000, 18 month FLD resistance
Reference 20 Day FLD Interaction: A3
Underlying 40 Day FLD Status: A2
Underlying 80 Day FLD Status: E
Assuming the 40 day and possibly 80 day components are about to trough a ‘risk buy’ is on offer. As mentioned above a test of the peaks around 34000 is likely but if the 20 week component crest has formed, price will not materially breach those. Watch for sideways and choppy action around the peak as a signal for the move to the 20 week nominal low early next year.
FLD Settings
If you do not have the use of Sentient Trader use these settings to plot common FLDs in your trading software (daily scale) to more easily follow trading signals and strategy from Sigma-L.
Make sure to account for non-trading days if your broker omits them in the data feed (weekends, for example). The below offsets are given with no added calculation for non-trading days.
80 day nominal: 52.3 days | 26 day FLD offset
40 day nominal: 26.4 days | 14 day FLD offset
20 day nominal: 14.5 days | 8 day FLD offset
10 day nominal: 8 days | 4 day FLD offset
Correlated Exposure
A non exhaustive list of correlated instruments for consideration
SPDR Dow Jones Industrial Average ETF Trust DIA 0.00%↑
Global X Dow 30 Covered Call ETF $DJIA
iShares Dow Jones U.S. ETF IYY 0.00%↑
Very interesting analysis David. Thank you. It would be very interesting to know how you would actually take advantage for the purposes of this signal, of the 56 minutes dominant component you found by means of wavelet transform.