

Bitcoin Market Cycles - 30th January 2023
Bitcoin forms the 18 month nominal low as anticipated in early November. As amplitude returns to the 80 day component, clarity also returns to the phasing. We take a look at the current status

Essentials: Nominal Model | FLD | FLD Trading Strategy | FLD Trading Strategy (Advanced) | Principle of Nominality | Underlying Trend | Time Frequency Analysis
Analysis Summary
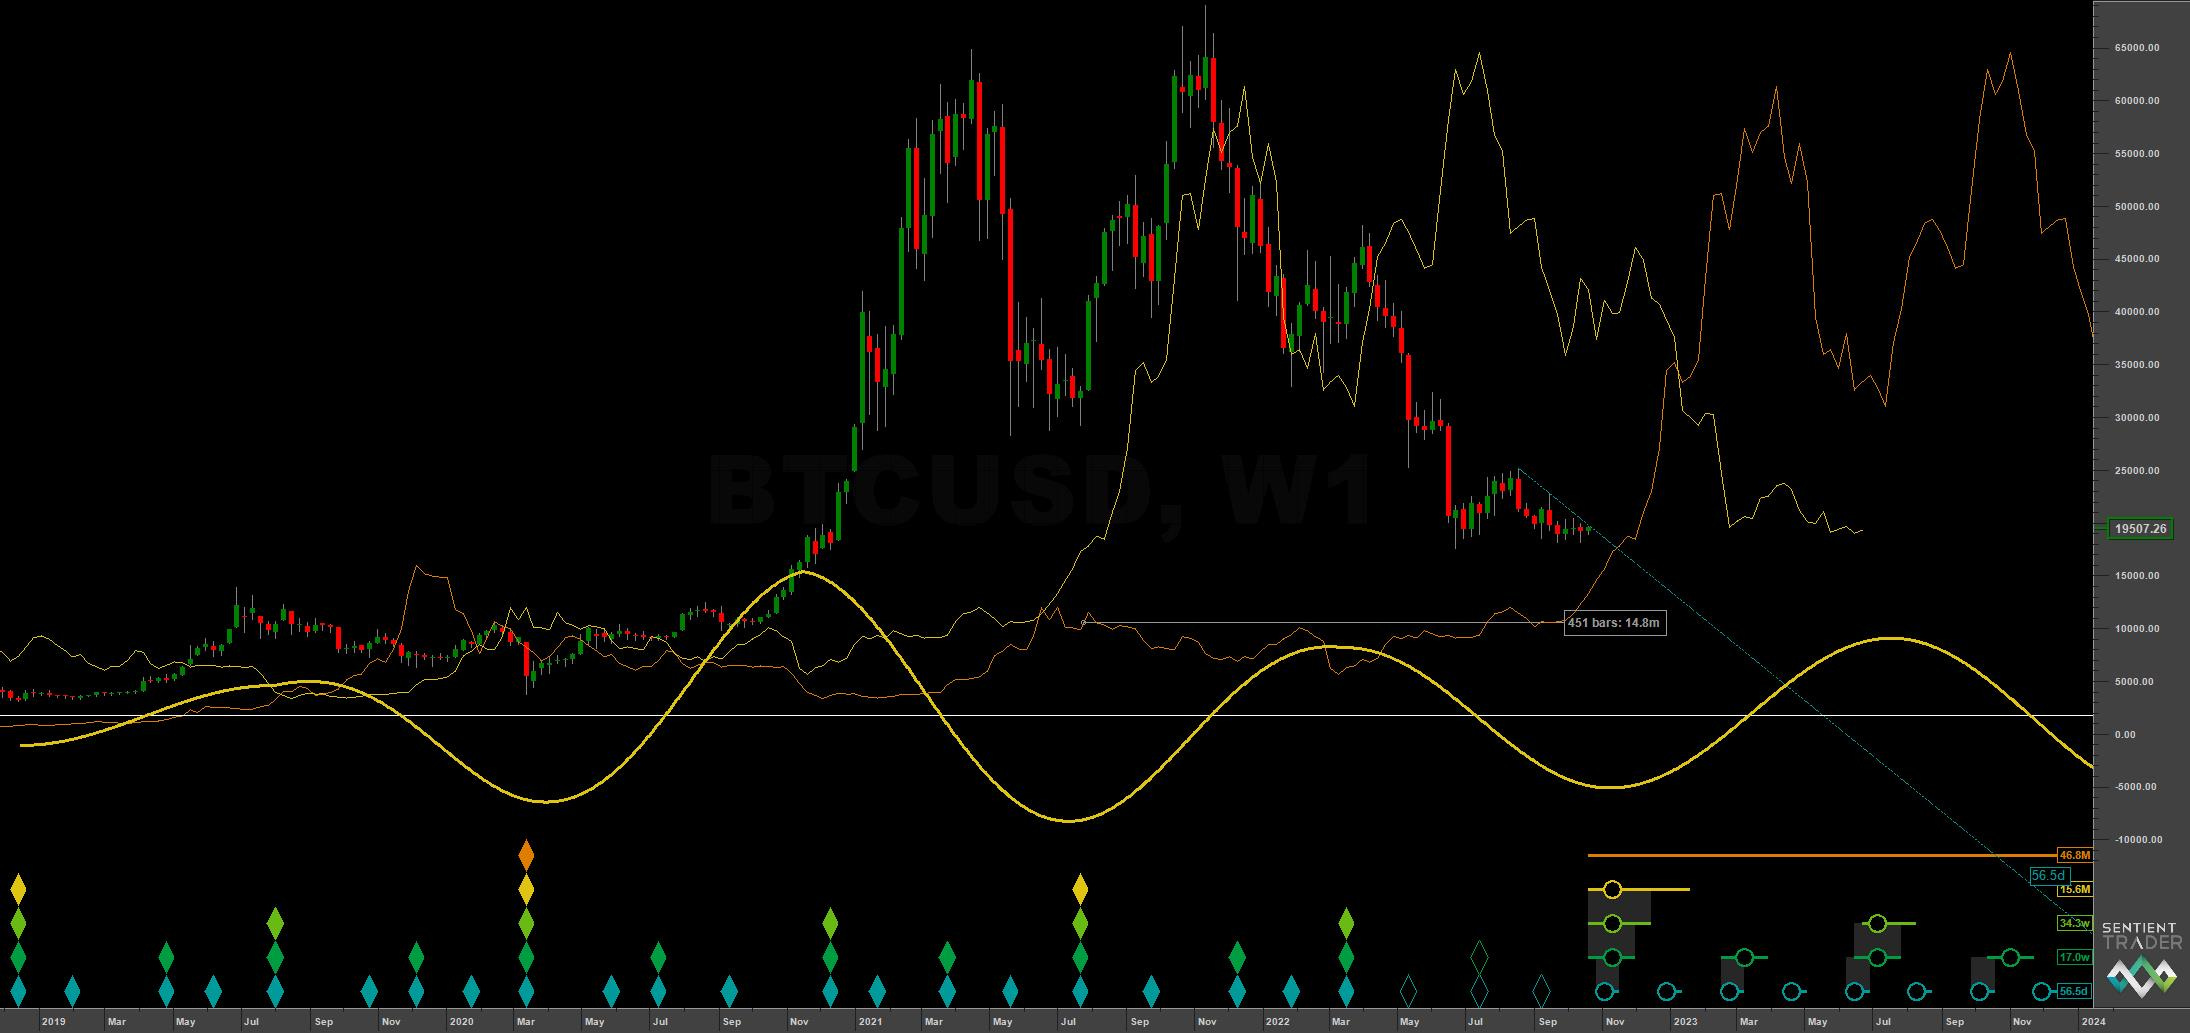
After the capitulation move down in early November 2022, typical of the late stages of a bear market and alluded to in our last report, Bitcoin has accumulated slowly then regained bullish momentum, courtesy of the 18 month nominal low. Anticipated for several months, this 18 month component low is now a fascinating element for us to study and trade as we examine the status of the underlying trend. The first move up doesn’t tell us too much, aside from the fact the 18 month low has most probably occurred and amplitude has returned to the shorter components. What will be more telling is the move from the next 20 week nominal low (due late Feb / early March) and the peak of the 40 week component, due in April.
Price is near our interim target of 25000, specified in the last report and close to the 18 month FLD (shown on long term Sentient Trader chart below) in terms of time. Time frequency analysis and Sentient Trader point to a peak of the 80 day component and perhaps the 20 week component over the next week or two. During this peaking process, which should be relatively sideways given the underlying trend from the recently troughed 18 month component, price will likely cross the 18 month FLD and establish a target to the upside. That target is likely to be around the 30-35k mark at this stage. The 18 month component wave is due to peak in June 2023, at the current wavelength. The peak of price may well be earlier. The discrepancy between the notional peak of the detected periodic component wave and the actual price peak gives us information about the underlying trend.
We explored more into the underlying trend of Bitcoin in our 18th October Report, which is well worth a read:

A peak in price that is early relative to the wave peak indicates a bearish underlying trend is present.
A much stronger move up from the 20 week nominal component trough, due late February / early March, will indicate the recent low was possibly of larger magnitude. This is the outlier scenario.
There is a FLD target projection for the 40 week wave at 26684 which has not yet been met. Both 80 day and 20 week FLD cross projection targets have been easily met and exceeded.
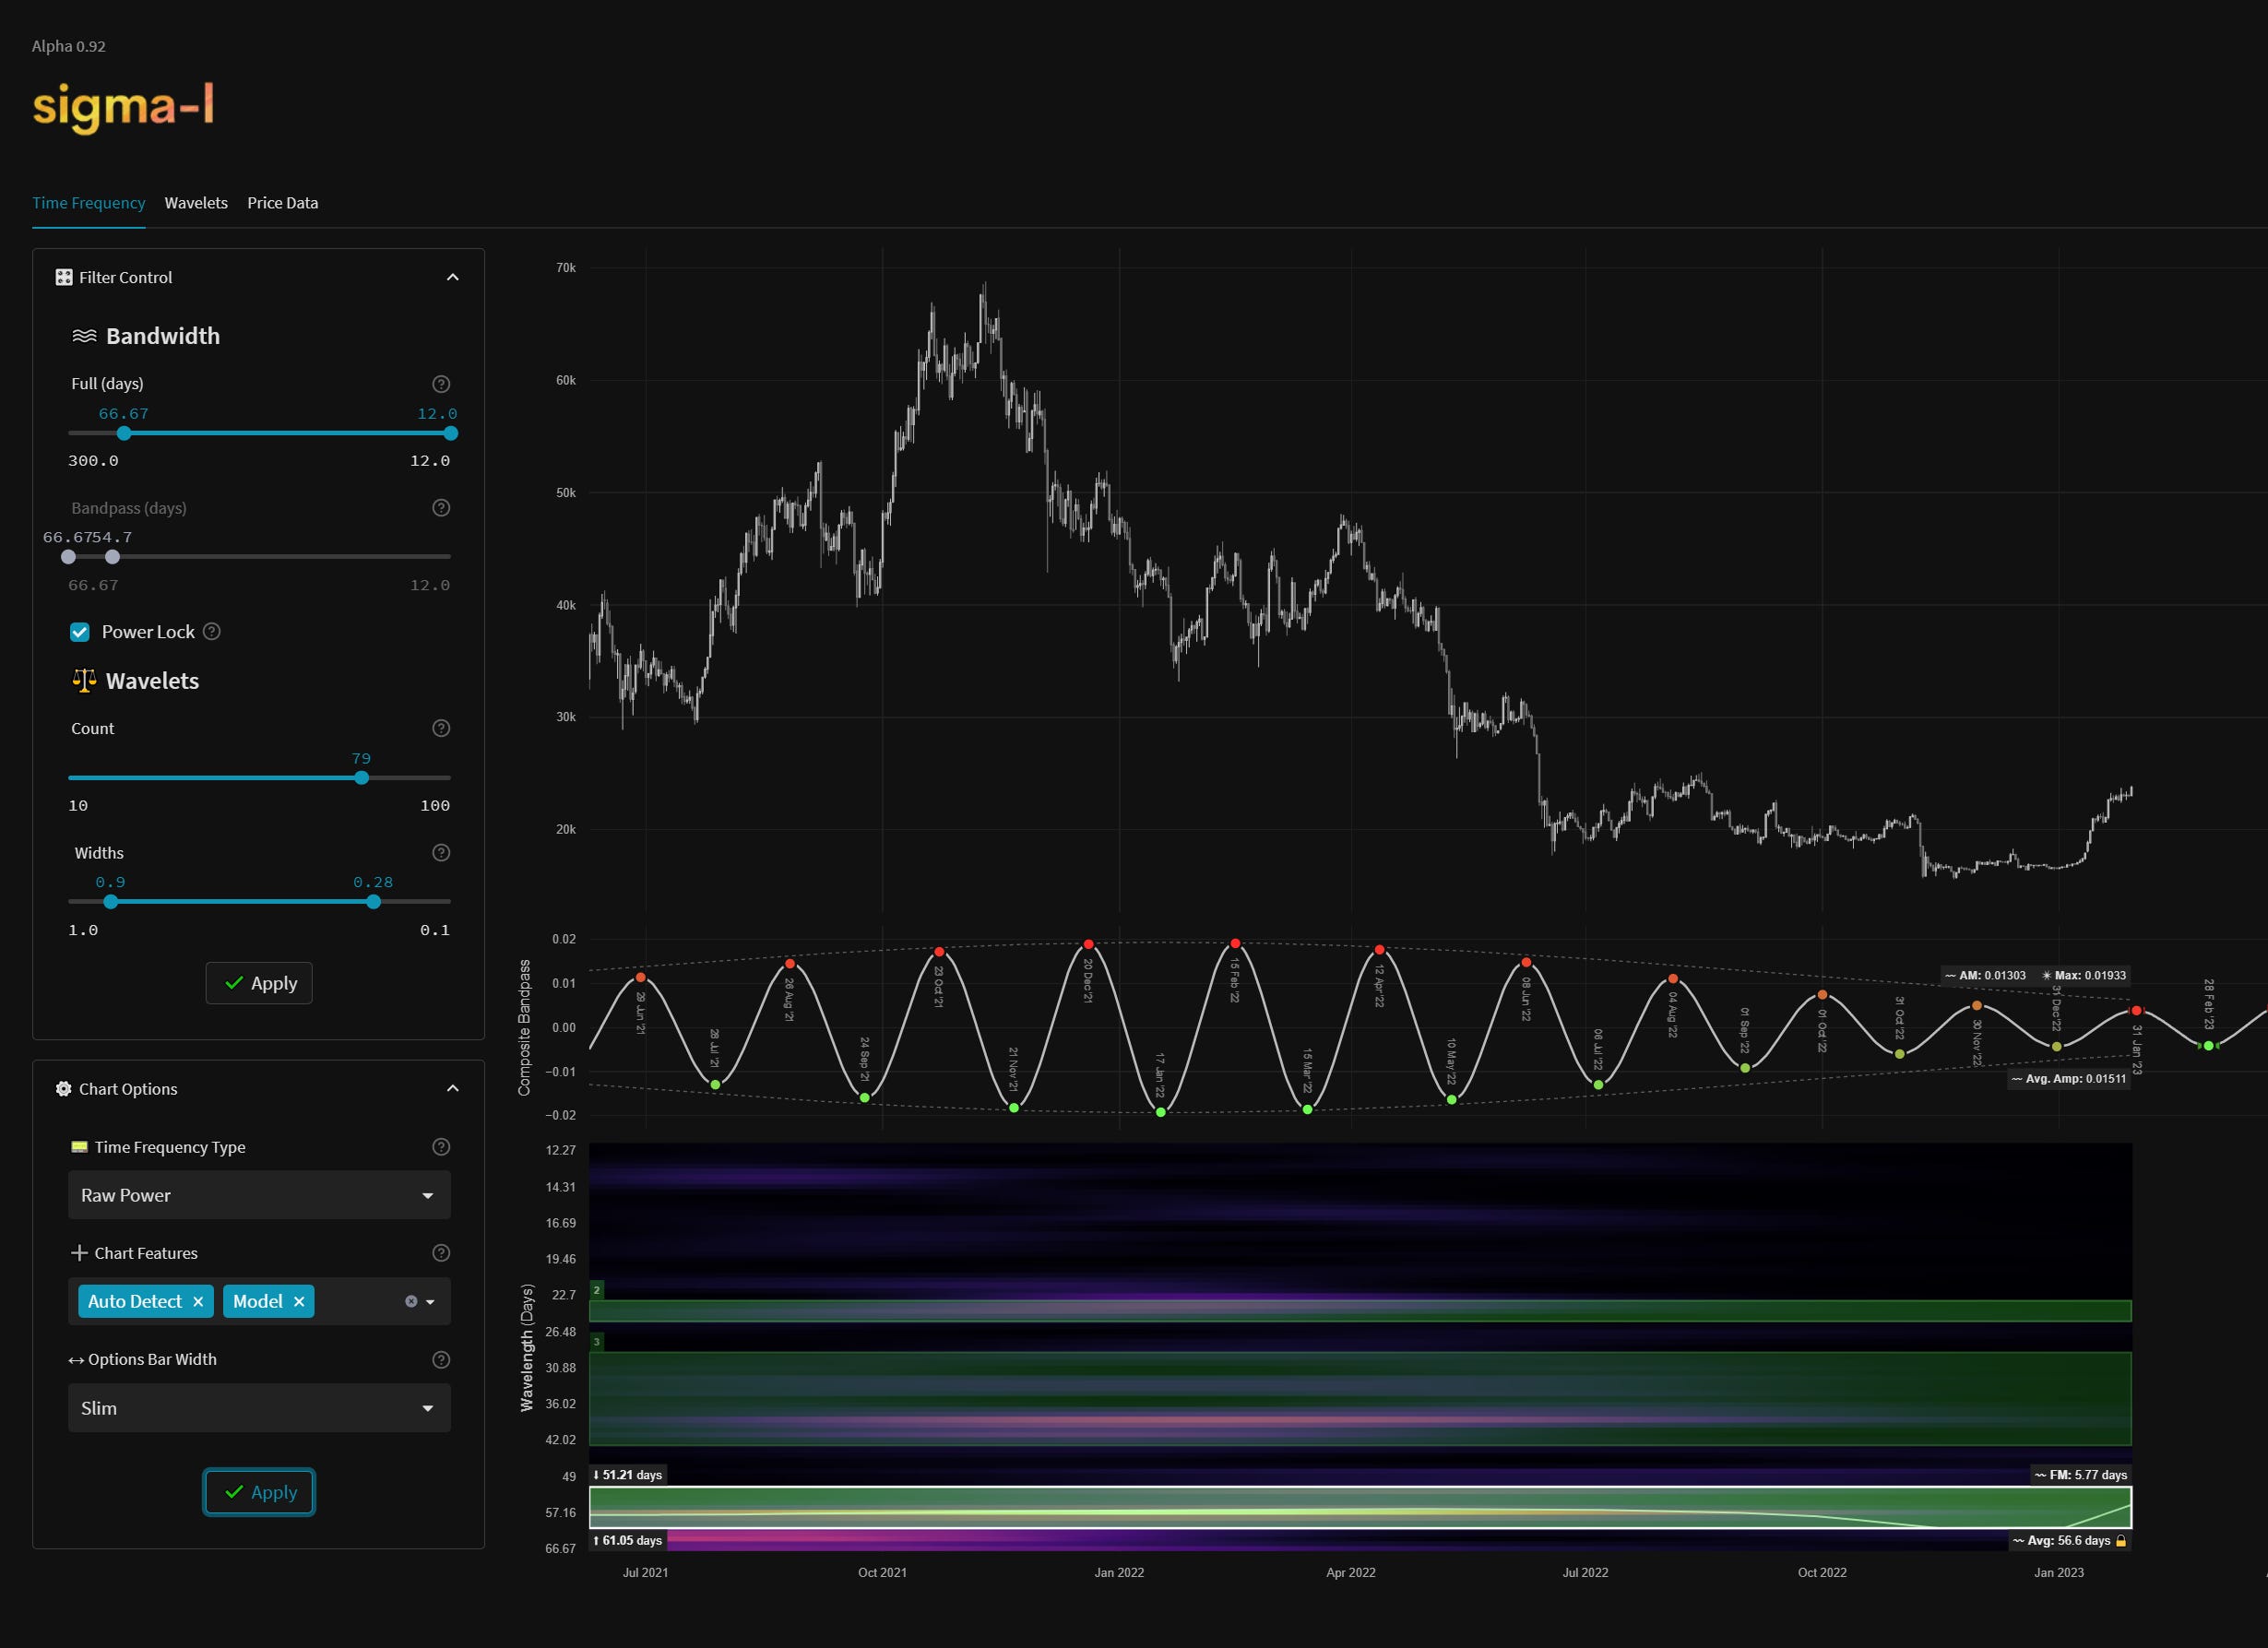
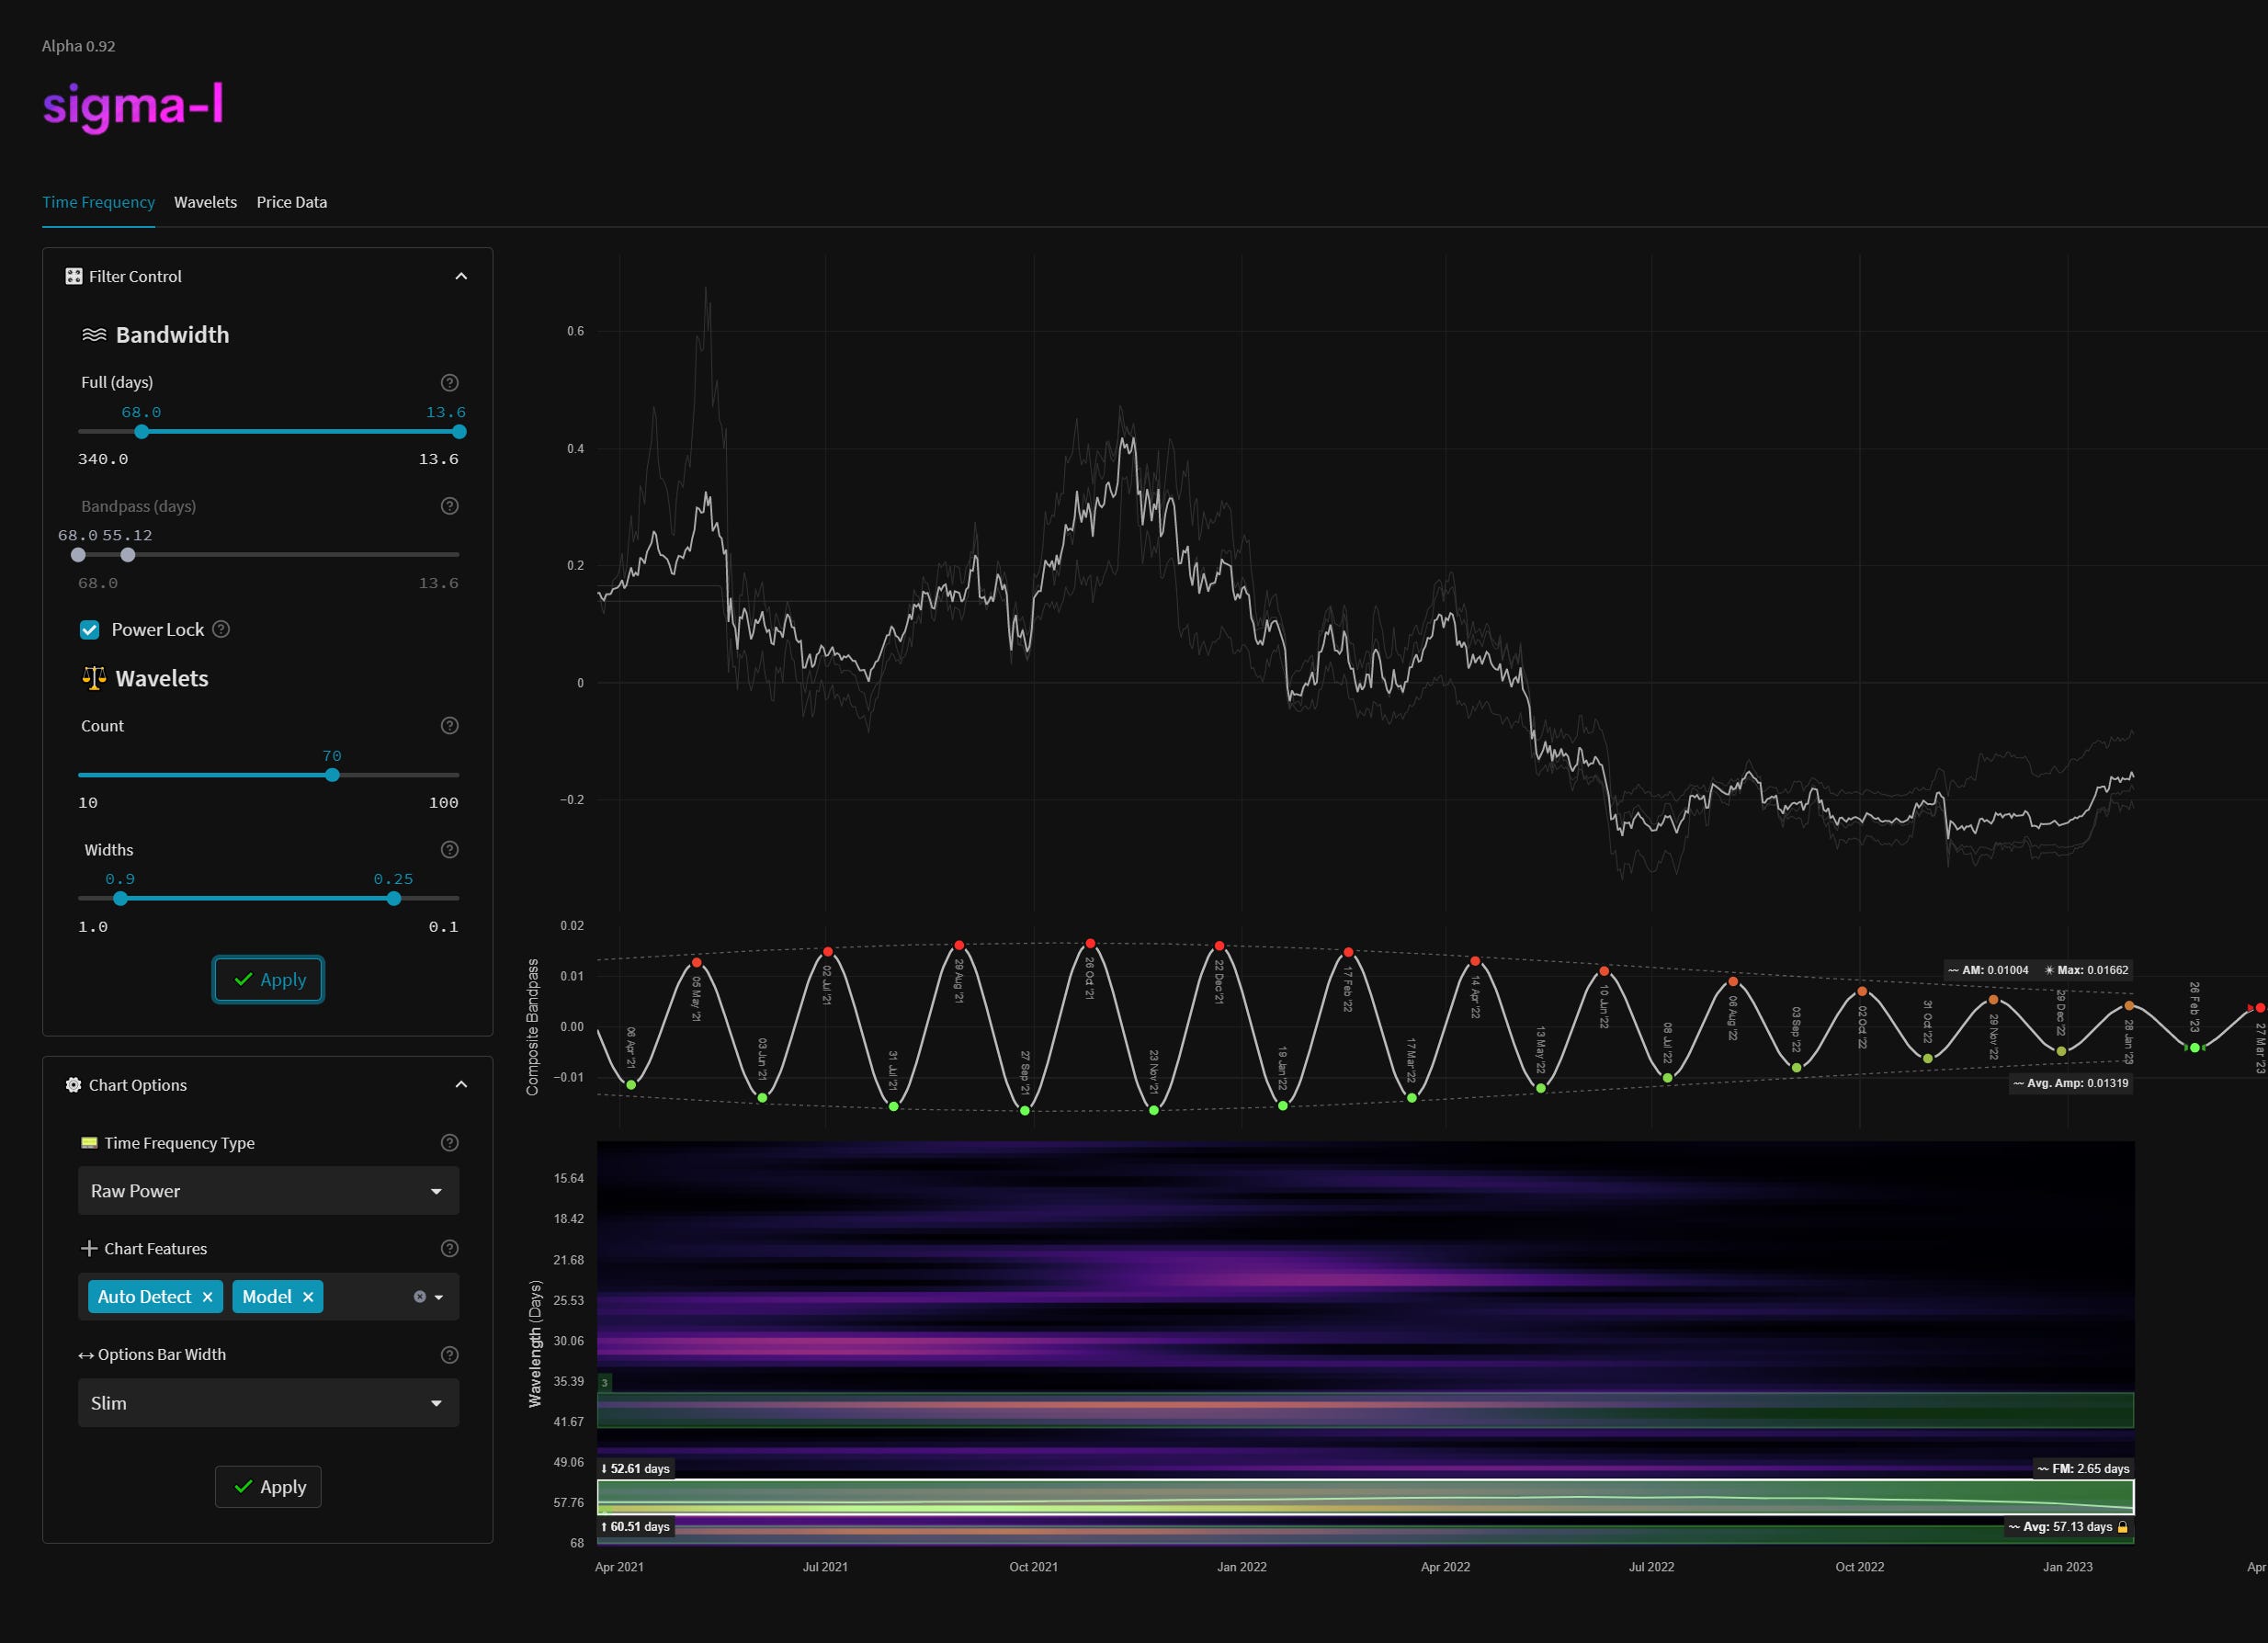
At the shorter term amplitude has made a welcome return to the component around 60 days in wavelength, notionally the 80 day ‘nominal’ wave. This modulation should be maintained as we progress into the peak of the 40 week component and will help us time decisions more precisely.
Phasing Analysis
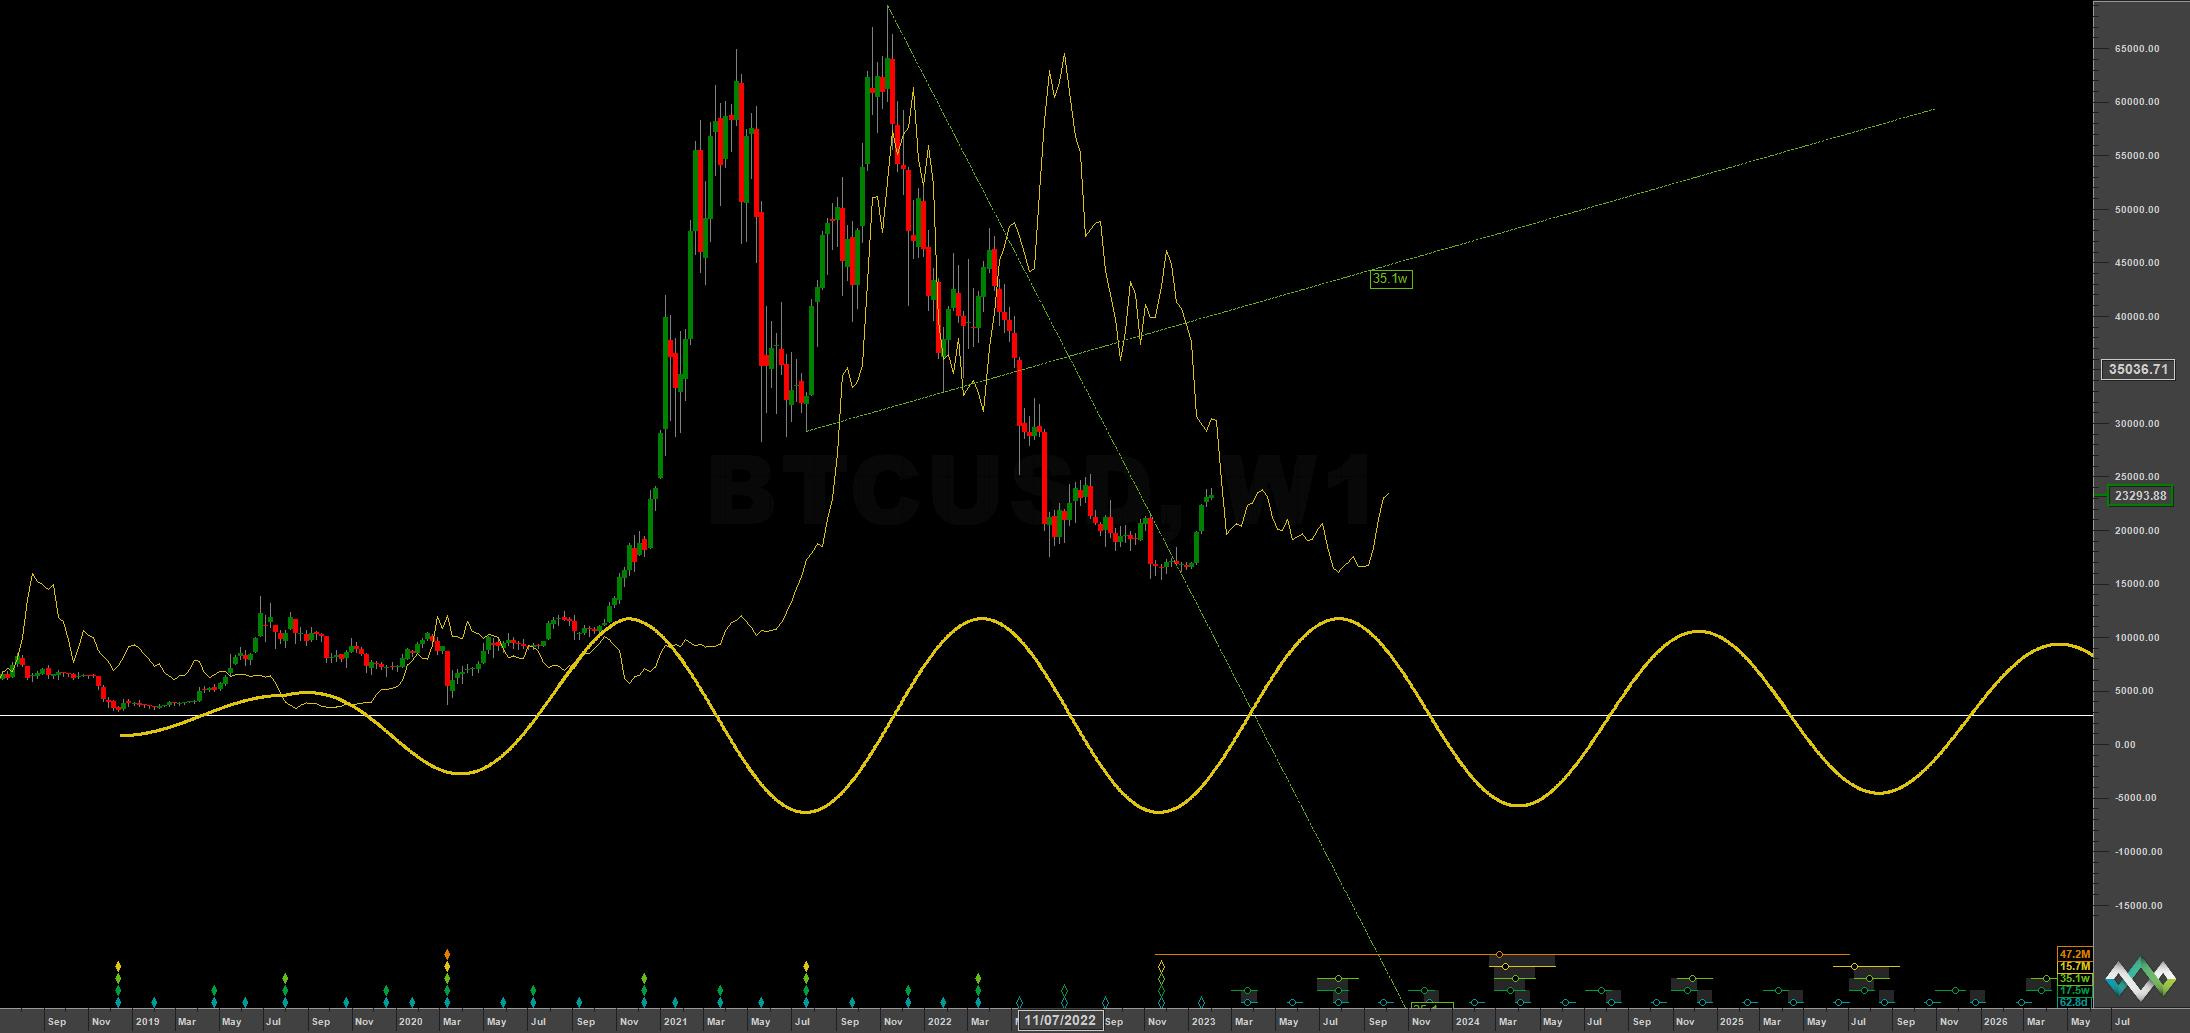
Long Term
Components including and longer than the 18 month nominal wave
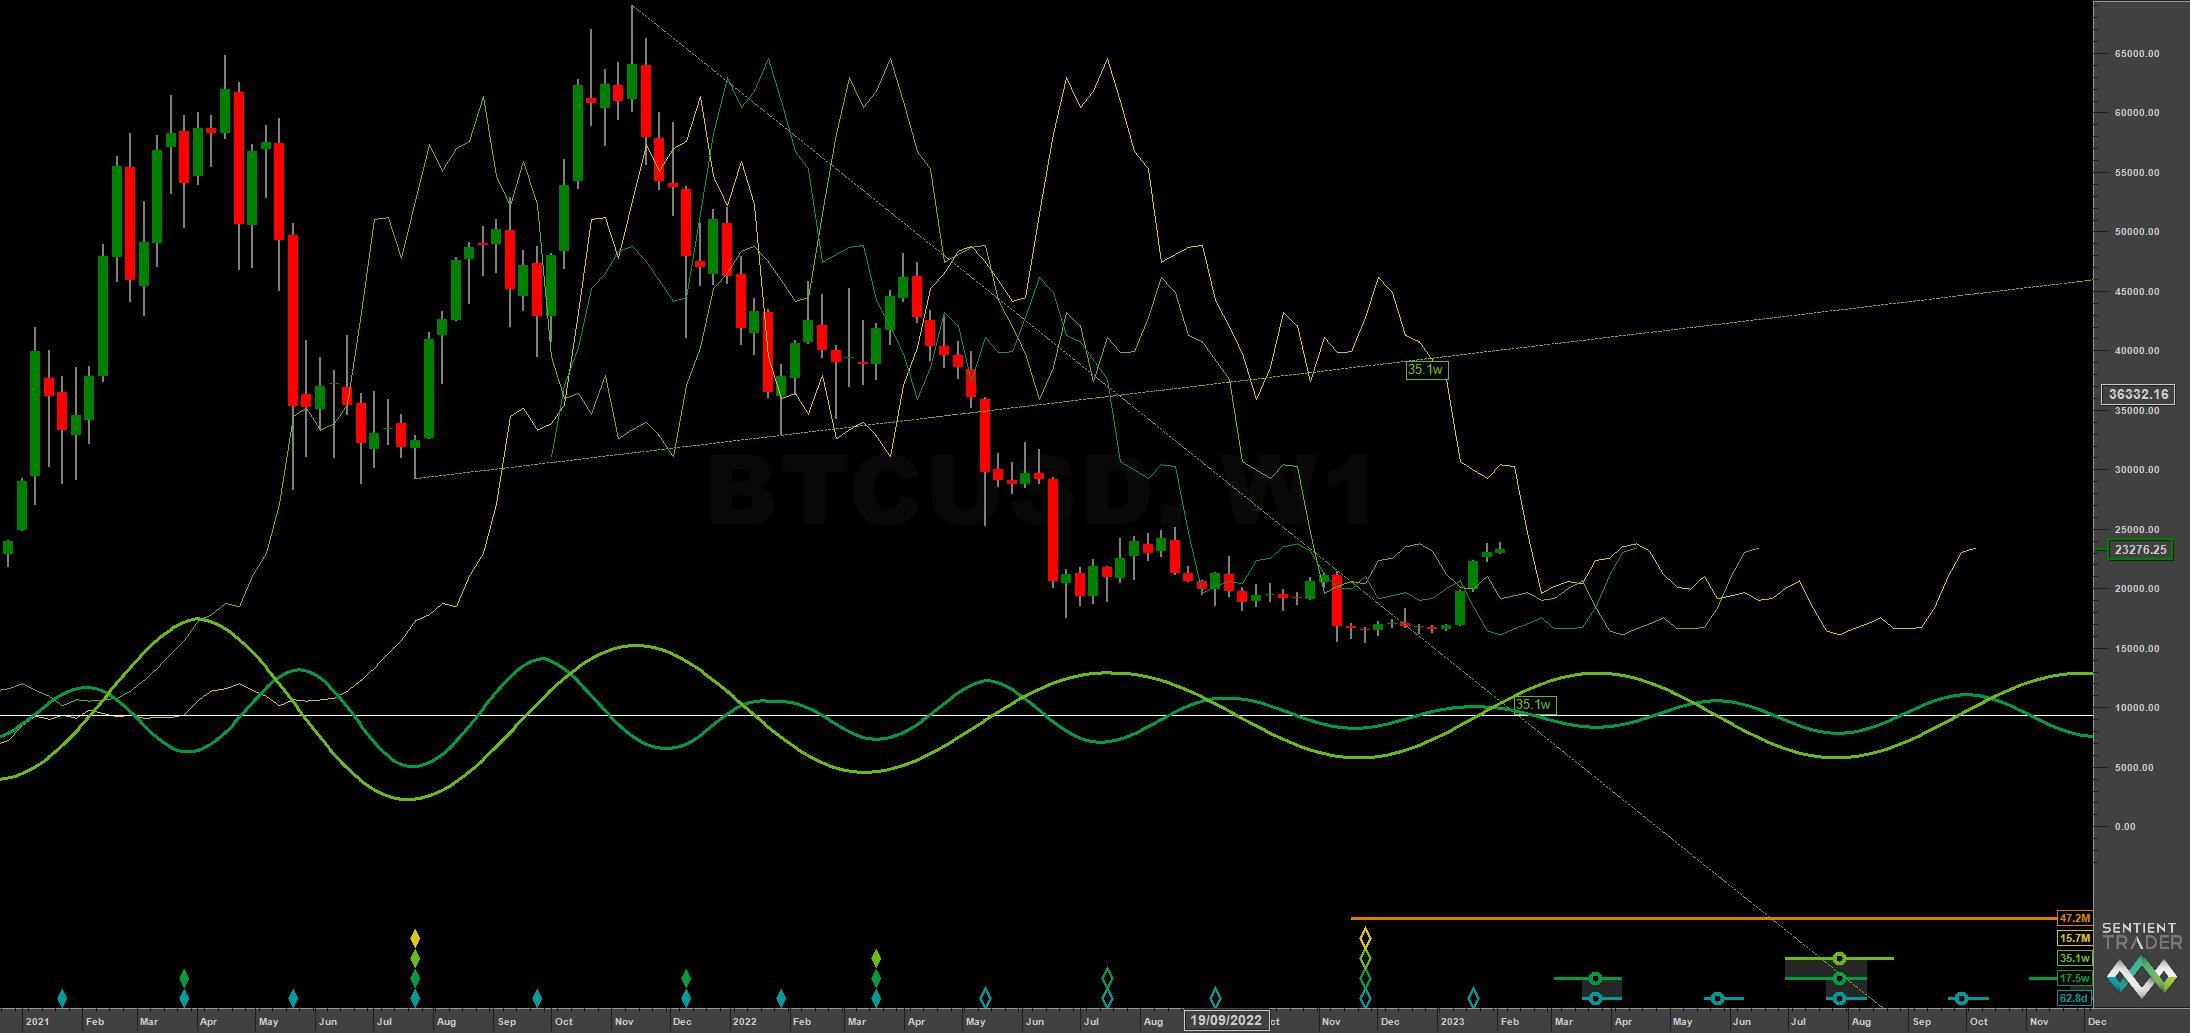
Medium Term
Components between the 20 week to 18 month nominal wave
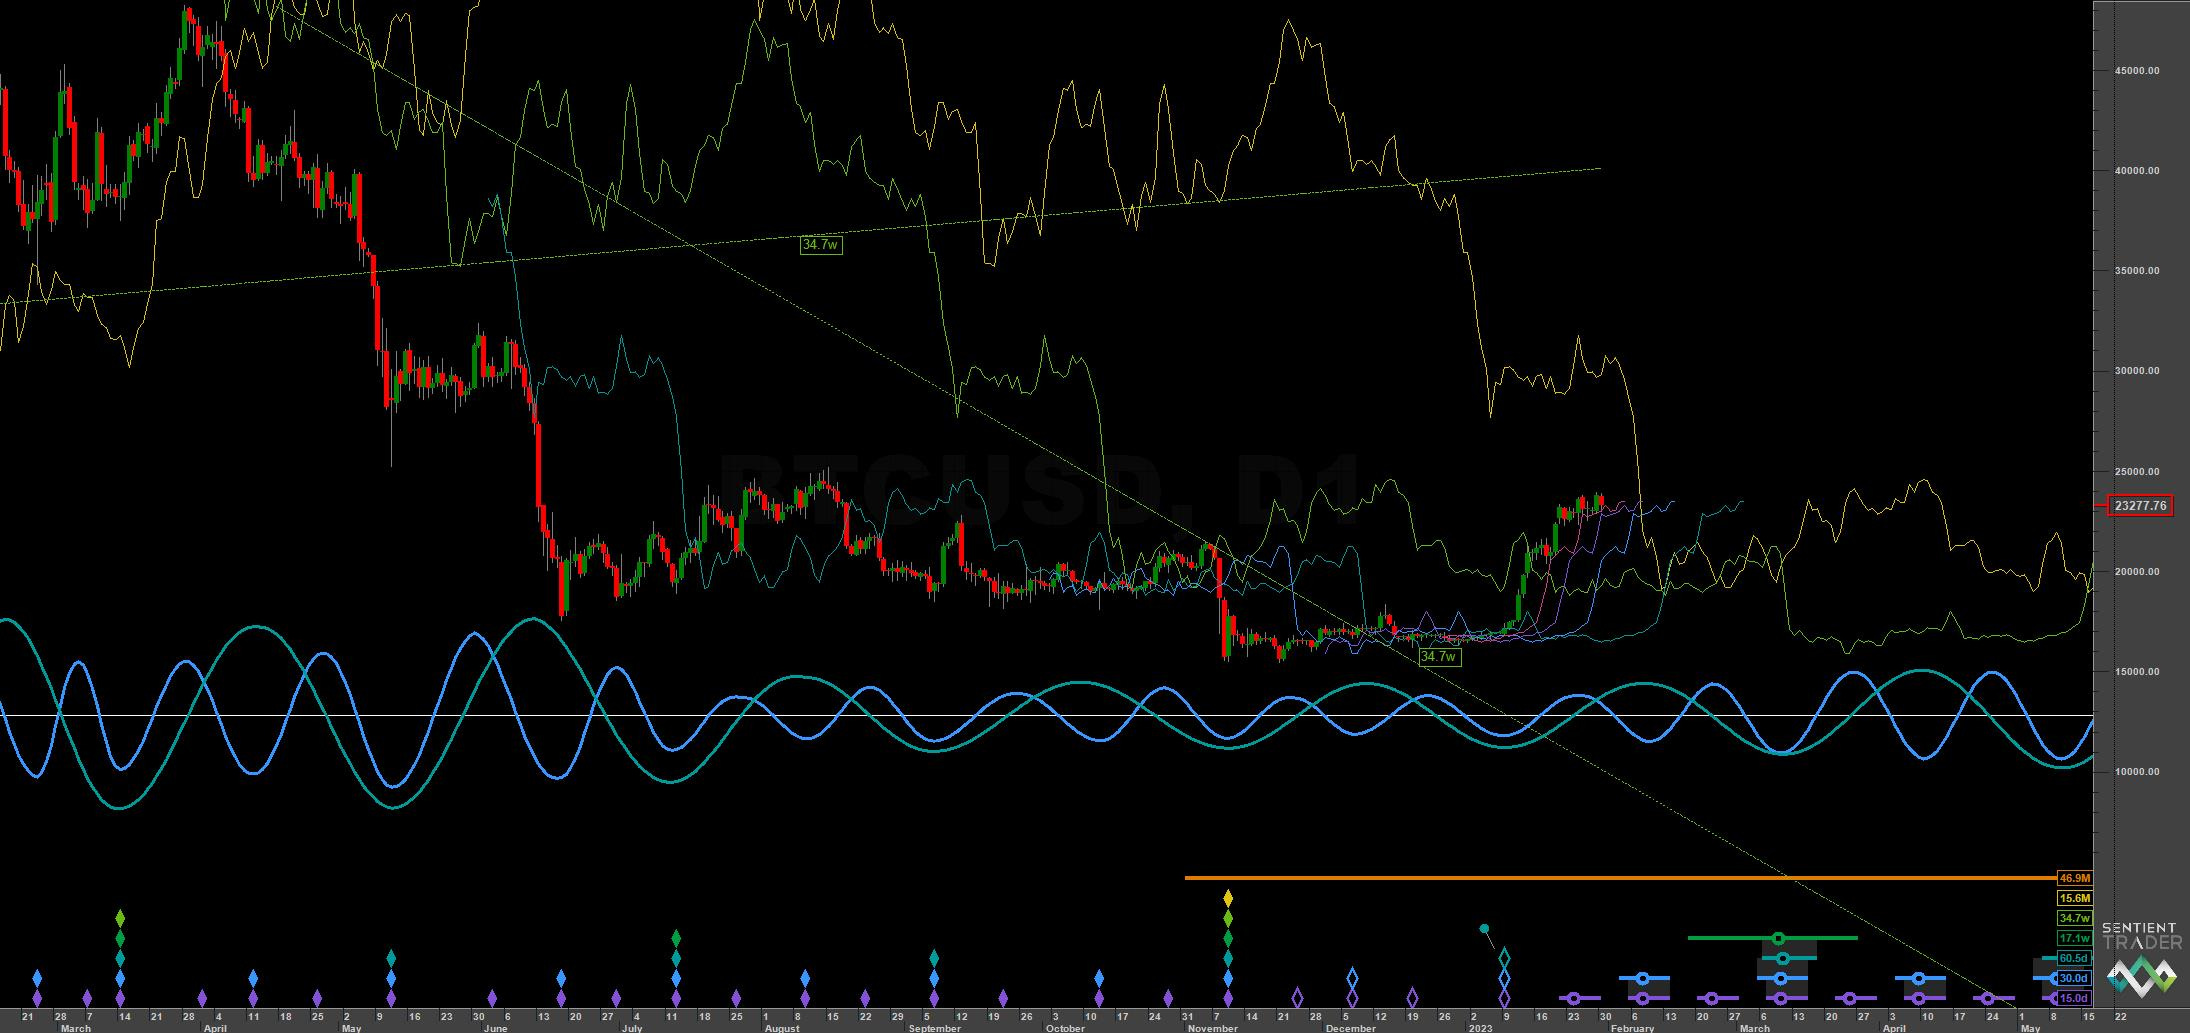
Short Term
Components shorter than the 20 week nominal wave
Trading Strategy
Interaction Status
Interactions and price in the FLD Trading Strategy (Advanced). This looks at an idealised 40 week cycle and an array of 3 FLD signal cycles. We apply the instrument’s phasing to the model and arrive at an overall summary for the interactions with the 20 day FLD, current and forthcoming.

Sigma-L recommendation: No Trade
Entry: n/a
Stop: n/a
Target: n/a
Reference 20 Day FLD Interaction: n/a
Underlying 40 Day FLD Status: n/a
Underlying 80 Day FLD Status: n/a
Traders that held long from the 18 month FLD entry may wish to take some profits here given a peak of the 20 week component may be near. The interim price target of 25000 has been approached to a good degree and time targets are indicating a top of at least 40 day magnitude.
The next low in late February/early March, phased to be a 20 week nominal low, may well be quite bullish and approach the 30k-35k mark to finish off the first stage of the current 18 month component. The 40 week component is due to peak in April, assuming a neutral underlying trend.
FLD Settings
If you do not have the use of Sentient Trader use these settings to plot common FLDs in your trading software (daily scale) to more easily follow trading signals and strategy from Sigma-L.
Make sure to account for non-trading days if your broker omits them in the data feed (weekends, for example). The below offsets are given with no added calculation for non-trading days.
80 day nominal: 60.5 days | 30 day FLD offset
40 day nominal: 30 days | 15 day FLD offset
20 day nominal: 15 days | 8 day FLD offset
10 day nominal: 7.5 days | 4 day FLD offset
Correlated Exposure
A non exhaustive list of correlated instruments for consideration
ProShares Bitcoin Strategy ETF BITO 0.00%↑
Valkyrie Bitcoin Strategy ETF BTF 0.00%↑
VanEck Bitcoin Strategy ETF XBTF 0.00%↑
Global X Blockchain & Bitcoin Strategy ETF BITS 0.00%↑
Global X Blockchain ETF BKCH 0.00%↑
Siren Nasdaq NexGen Economy ETF BLCN 0.00%↑
Bitwise Crypto Industry Innovators ETF BITF 0.00%↑
First Trust SkyBridge Crypto Industry and Digital Economy ETF CRPT 0.00%↑