

Bitcoin Market Cycles - 17th April 2023
Bitcoin approaches a 20 week nominal peak, a crucial point for the longer term phasing as it enters a fascinating 6 months ahead. We look at the long, medium and short term price action in this report

Essentials: Nominal Model | FLD | FLD Trading Strategy | FLD Trading Strategy (Advanced) | Underlying Trend | Time Frequency Analysis
Analysis Summary
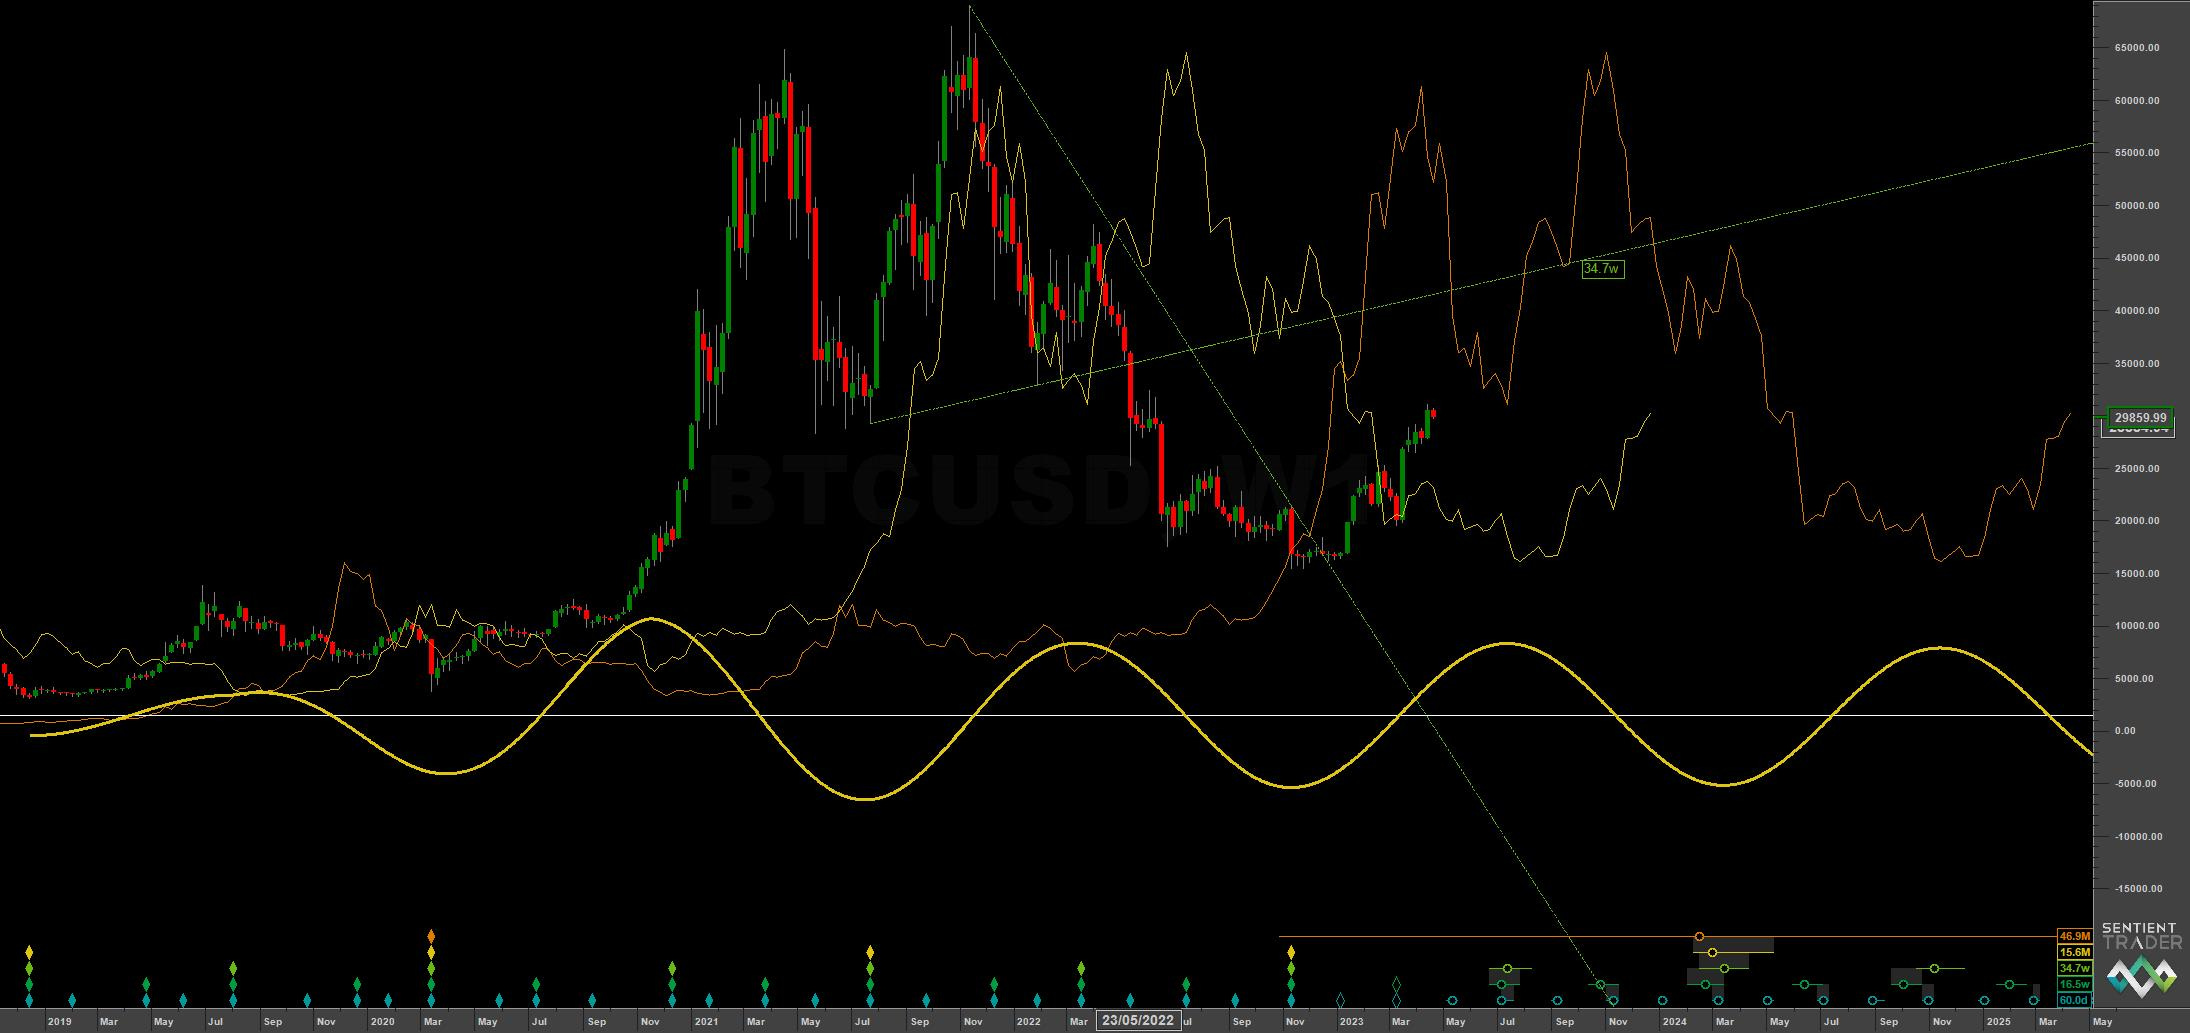
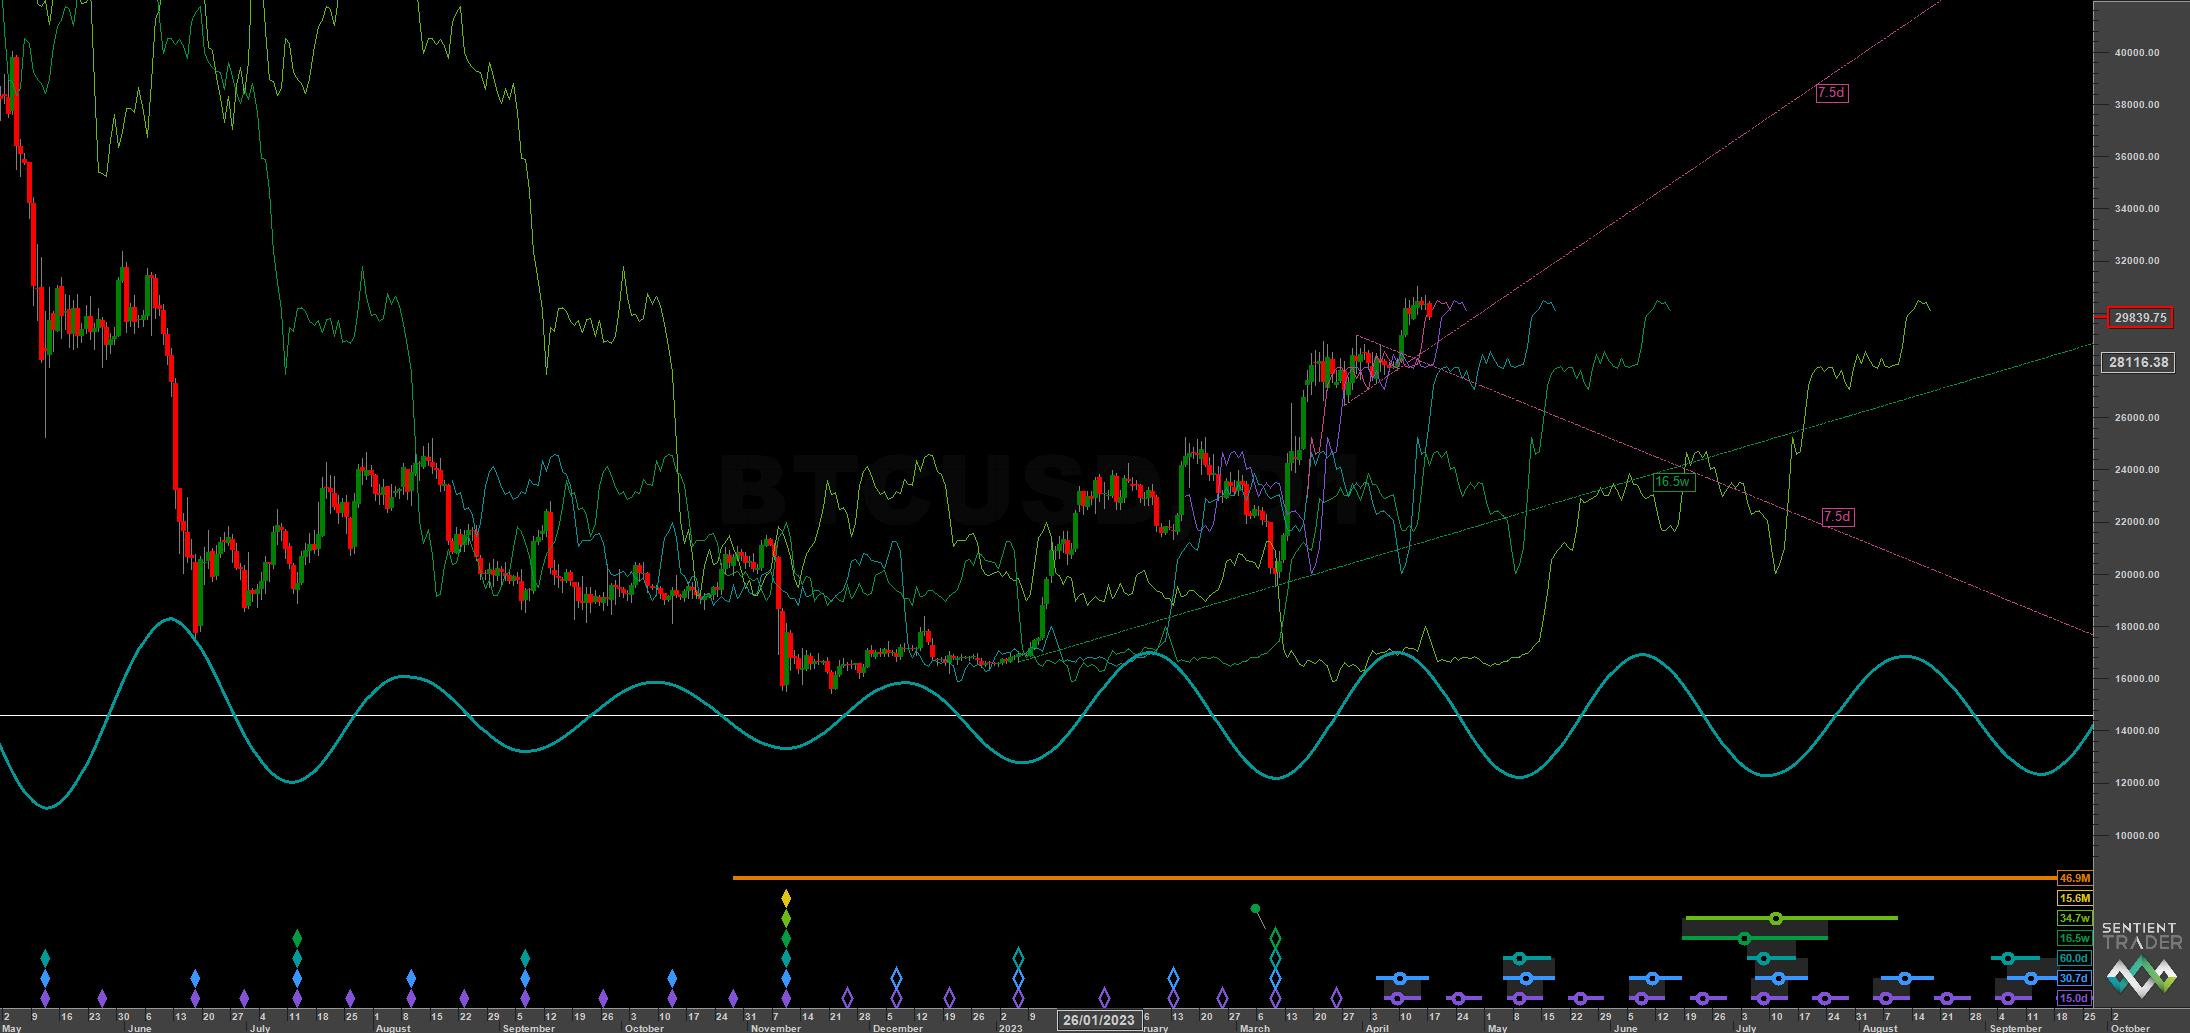
The 18 month ‘nominal’ component low in cryptocurrency and, more specifically, Bitcoin was established in November 2022, amongst some grinding and sideways price action. With the somewhat reinvigorated 80 day component (~ 65-75 days) now regaining clarity we can start to assess the phasing of the crypto king with more confidence at the short and medium term. Price has reached and slightly exceeded the 18 month FLD cross at 29310, as shown on the long term Sentient Trader phasing analysis below. Price is now due a nominal 20 week component peak.
What is interesting about the coming 6 month period is the fact we will be able to establish the magnitude of the low in March 2020. With continued bearish or sideways to down price action the longer term phasing is likely accurate and we can expect the 4 year low to come in late 2023 - early 2024. However, if after the 40 week nominal low (due in July this year) we get a bullish higher low and price accelerates back up to the peaks being established now, we can likely assume the 18 month low in November 2018 was the 4 year nominal low. Implying the recent 18 month nominal low in November 2022 was also a 4 year component trough. This then implies a new bull market for a couple of years in cryptocurrency. Our preferred phasing is the former, a continuation of the bear market into the 40 week low in July, forming a neutral (sideways) cycle shape or slightly bullish. This would precede the 4 year nominal low in late 2023 / early 2024 as shown on the long term phasing analysis in ST.
It is interesting to note we have not seen any kind of really bullish price action, something we speculated on in our Bitcoin report of the 18th of October , which would favour the position of the 4 year component low having occurred November 2022.
From 18th October Report:
The compelling evidence (for the 4 year nominal low) would be for price to track the 54 month FLD back up to the previous highs of around 65000 within the timespan of the next 40 week component (half the 18 month component), peaking end of the first quarter 2023. This would be quite the bullish rally and would in turn imply the previous 54 month nominal low occurred late 2019, rather than early 2020 in our current phasing.
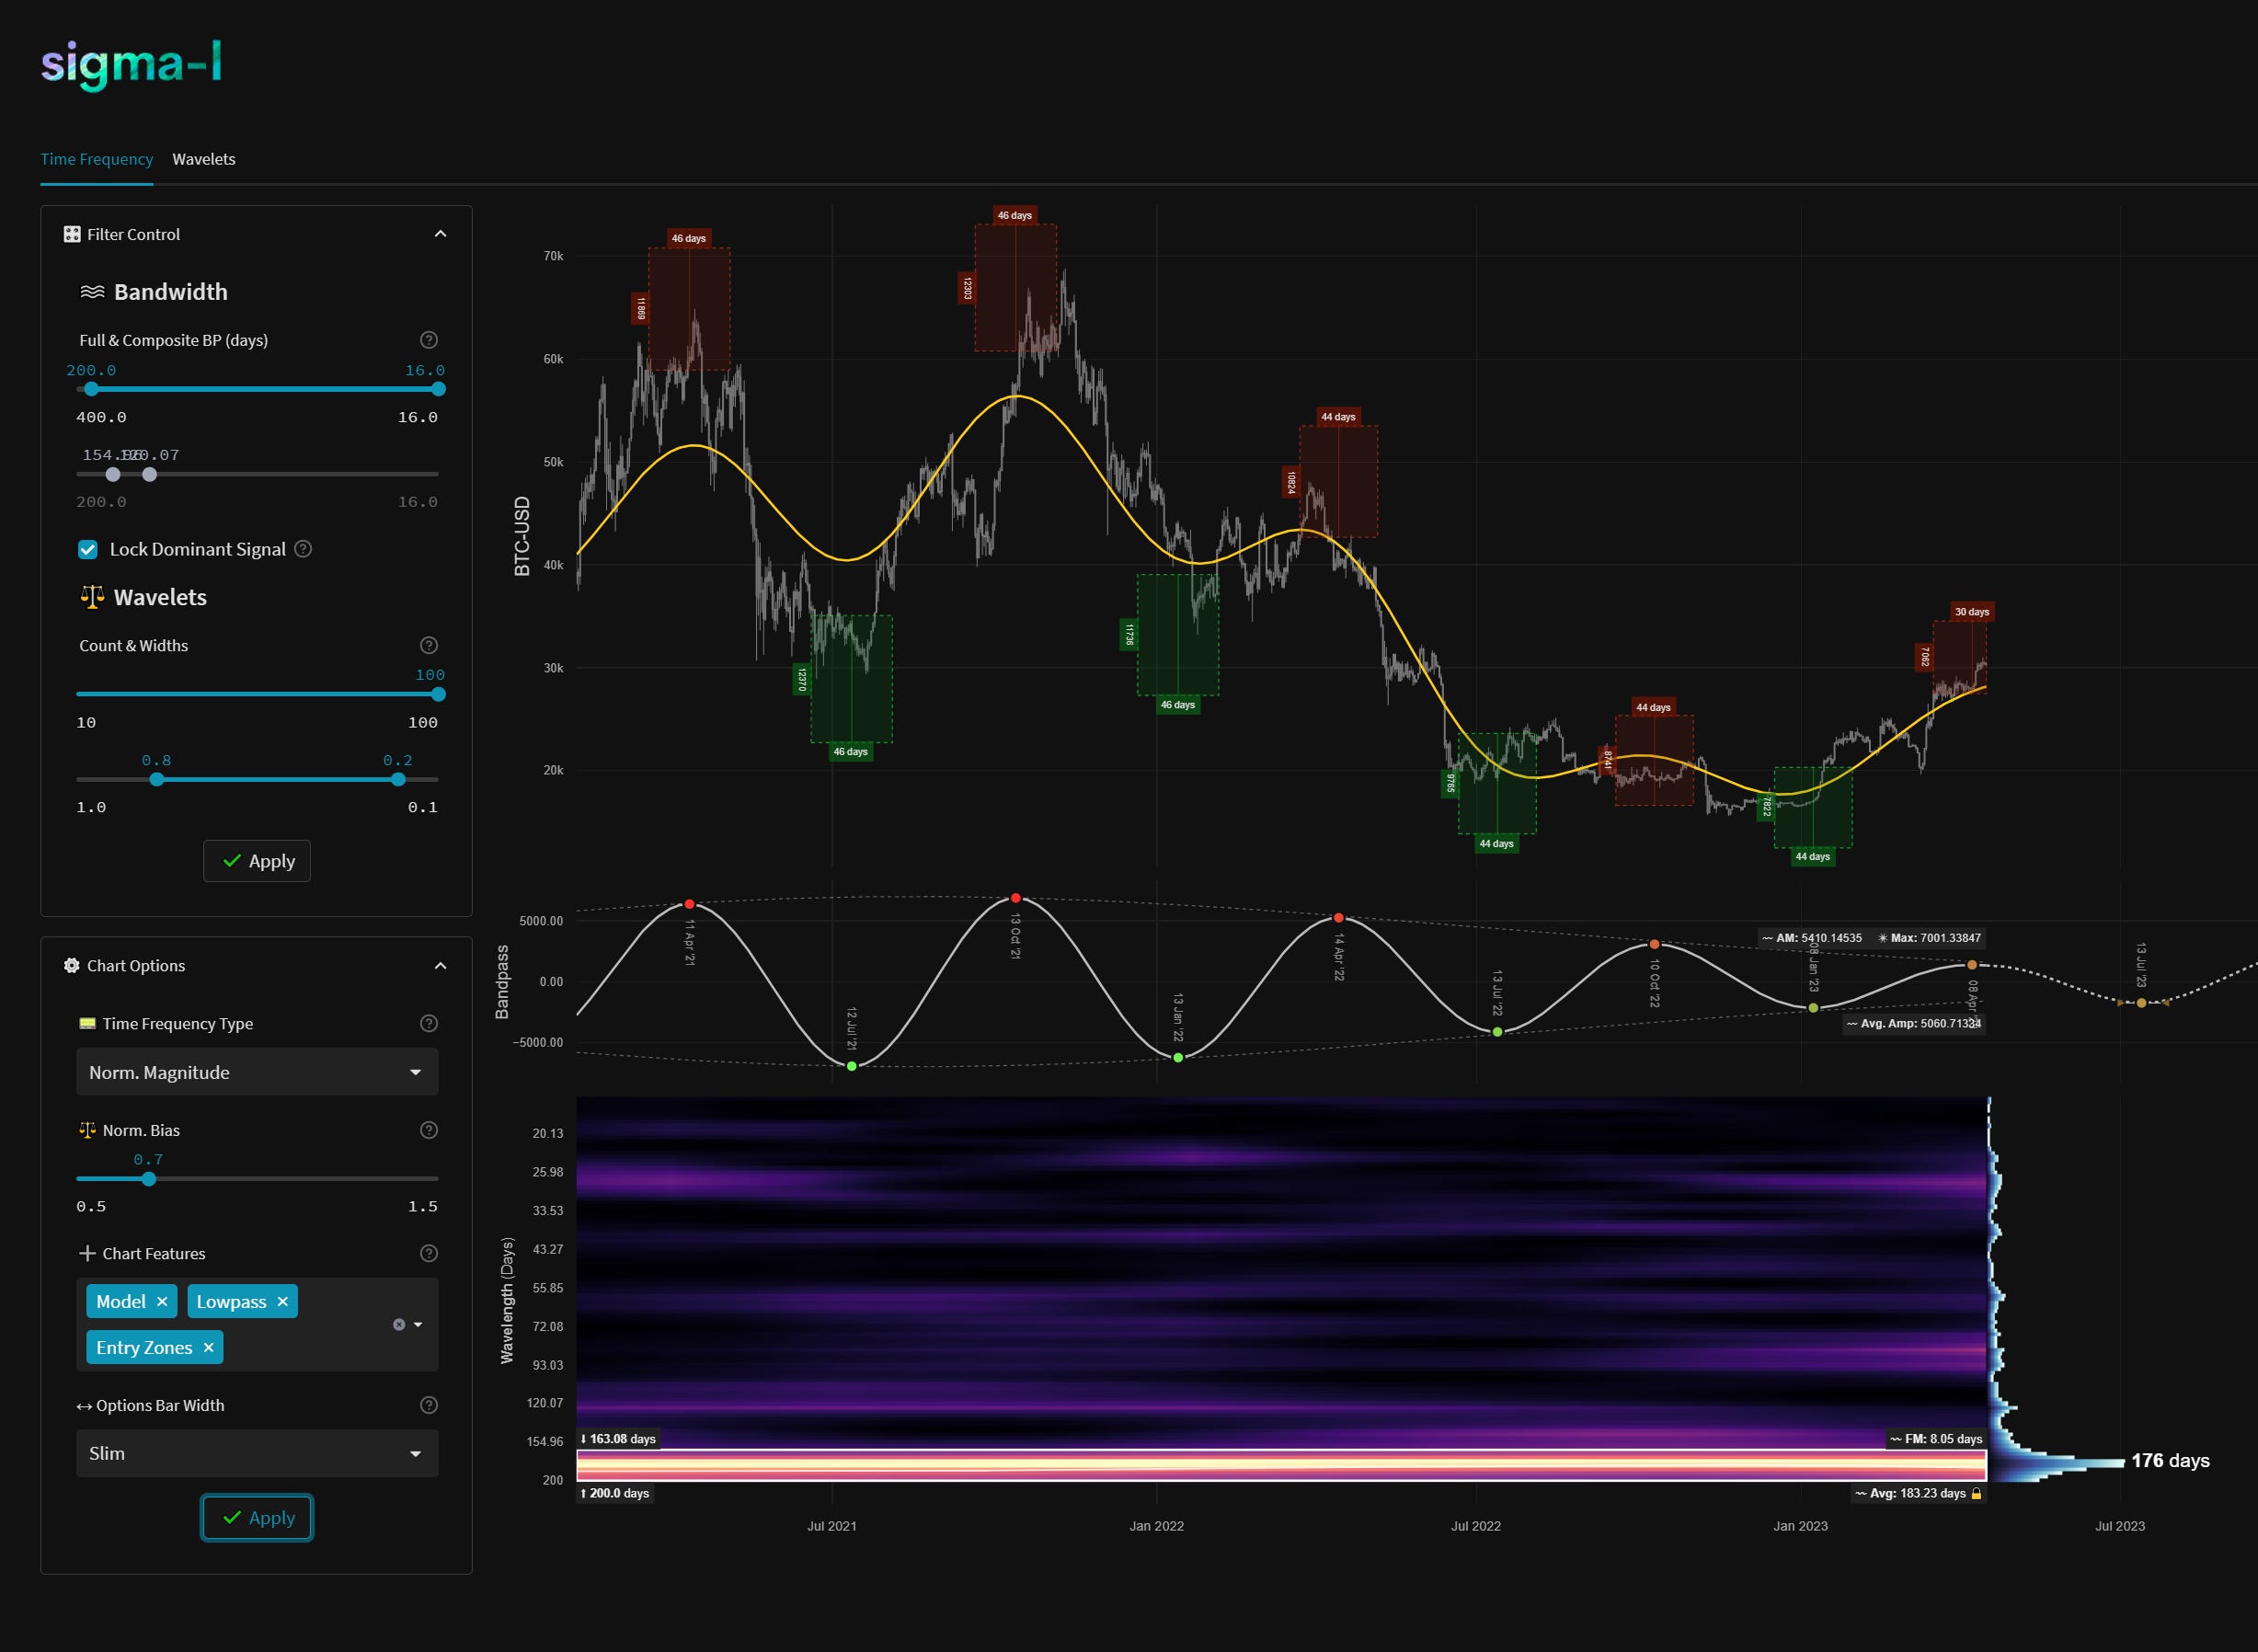
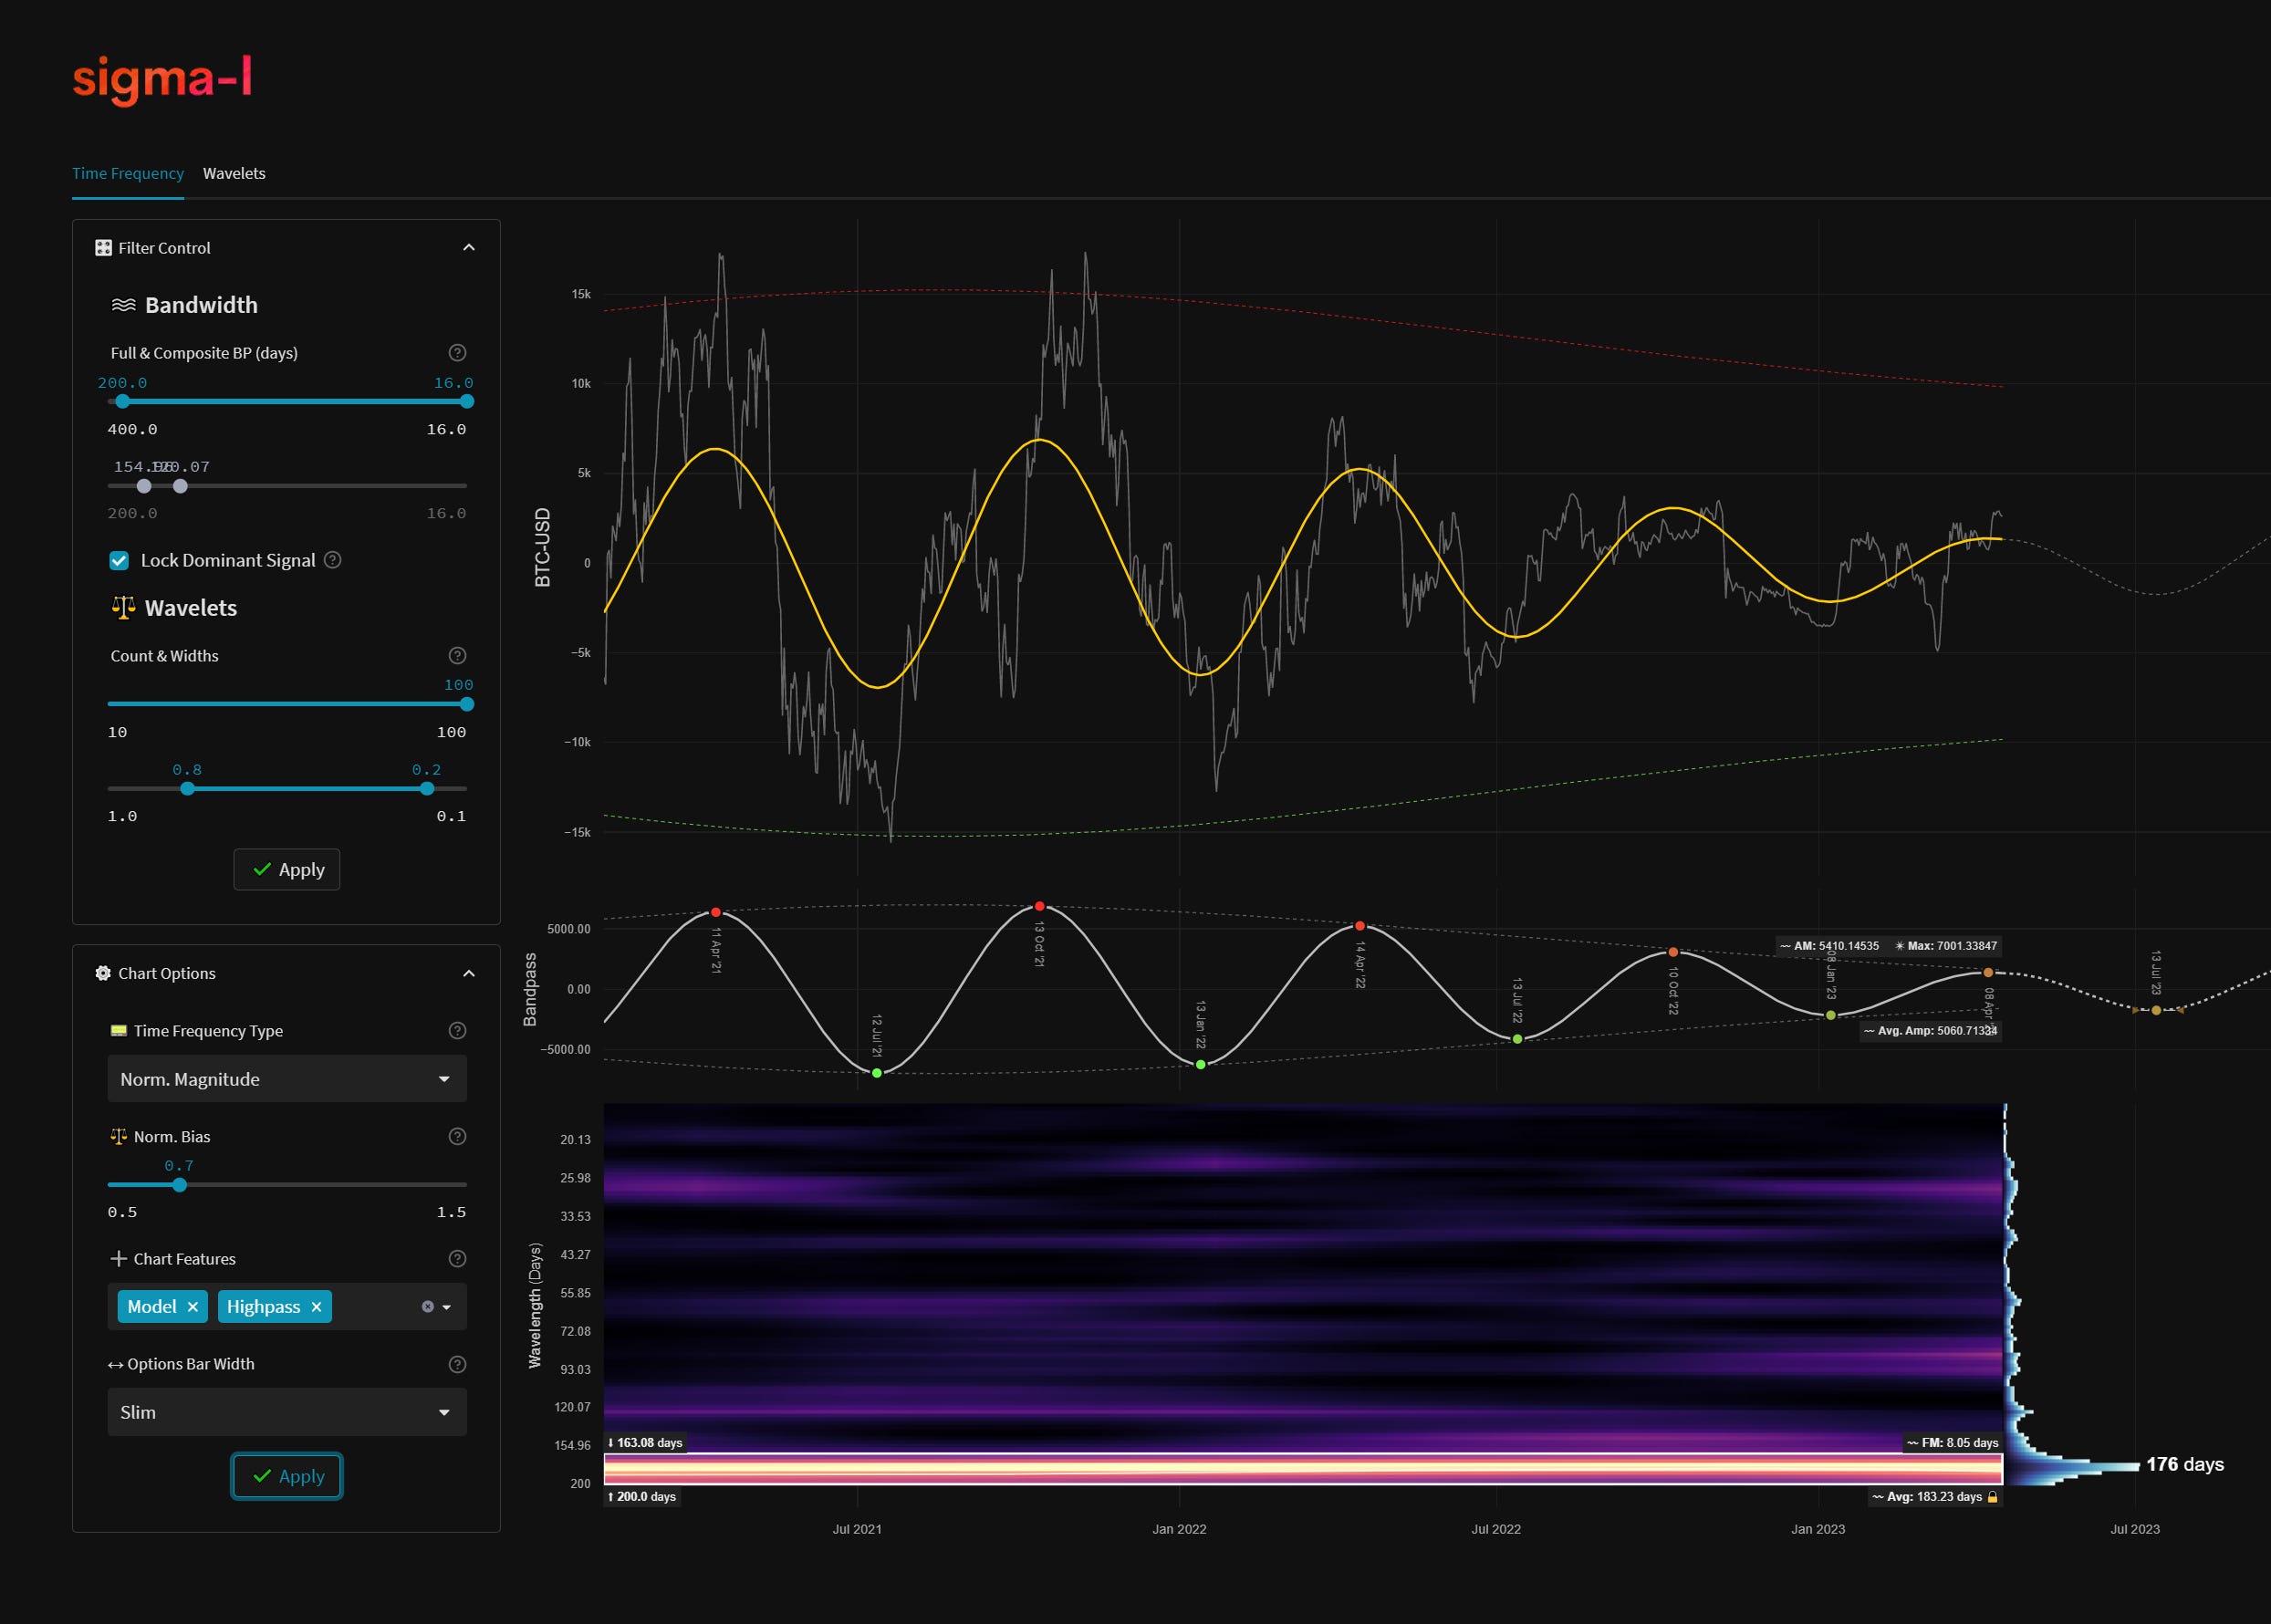
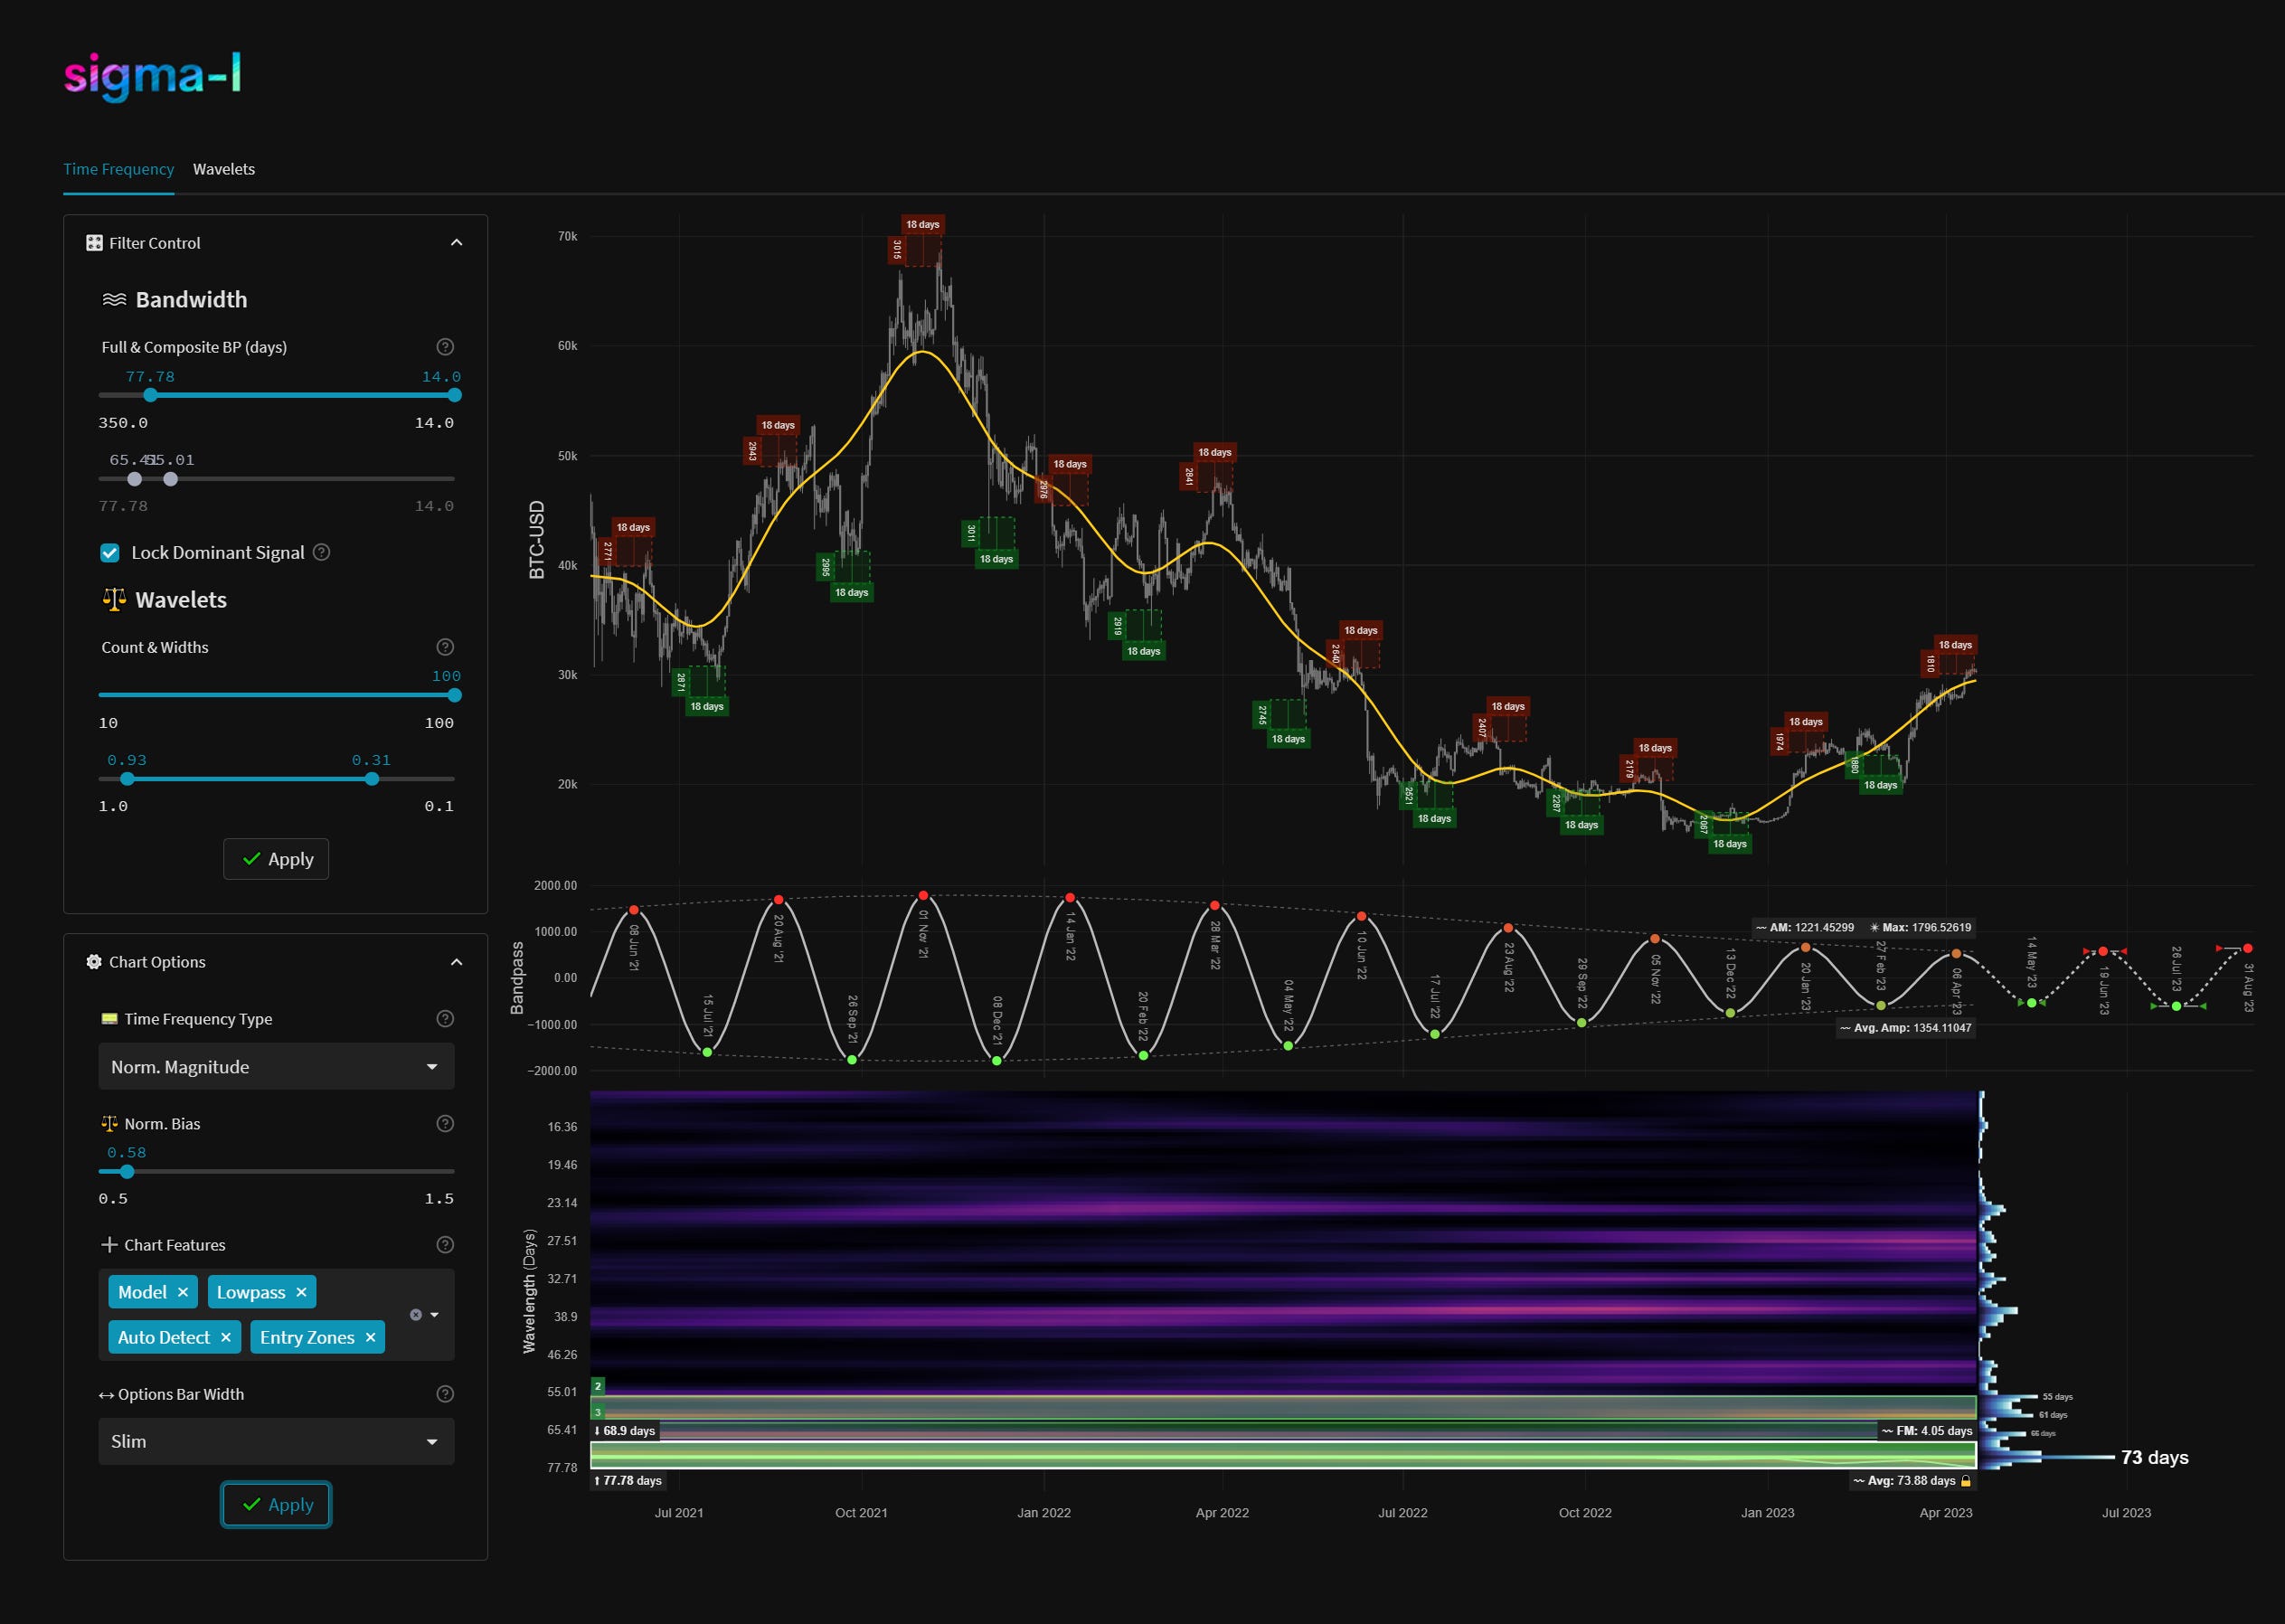
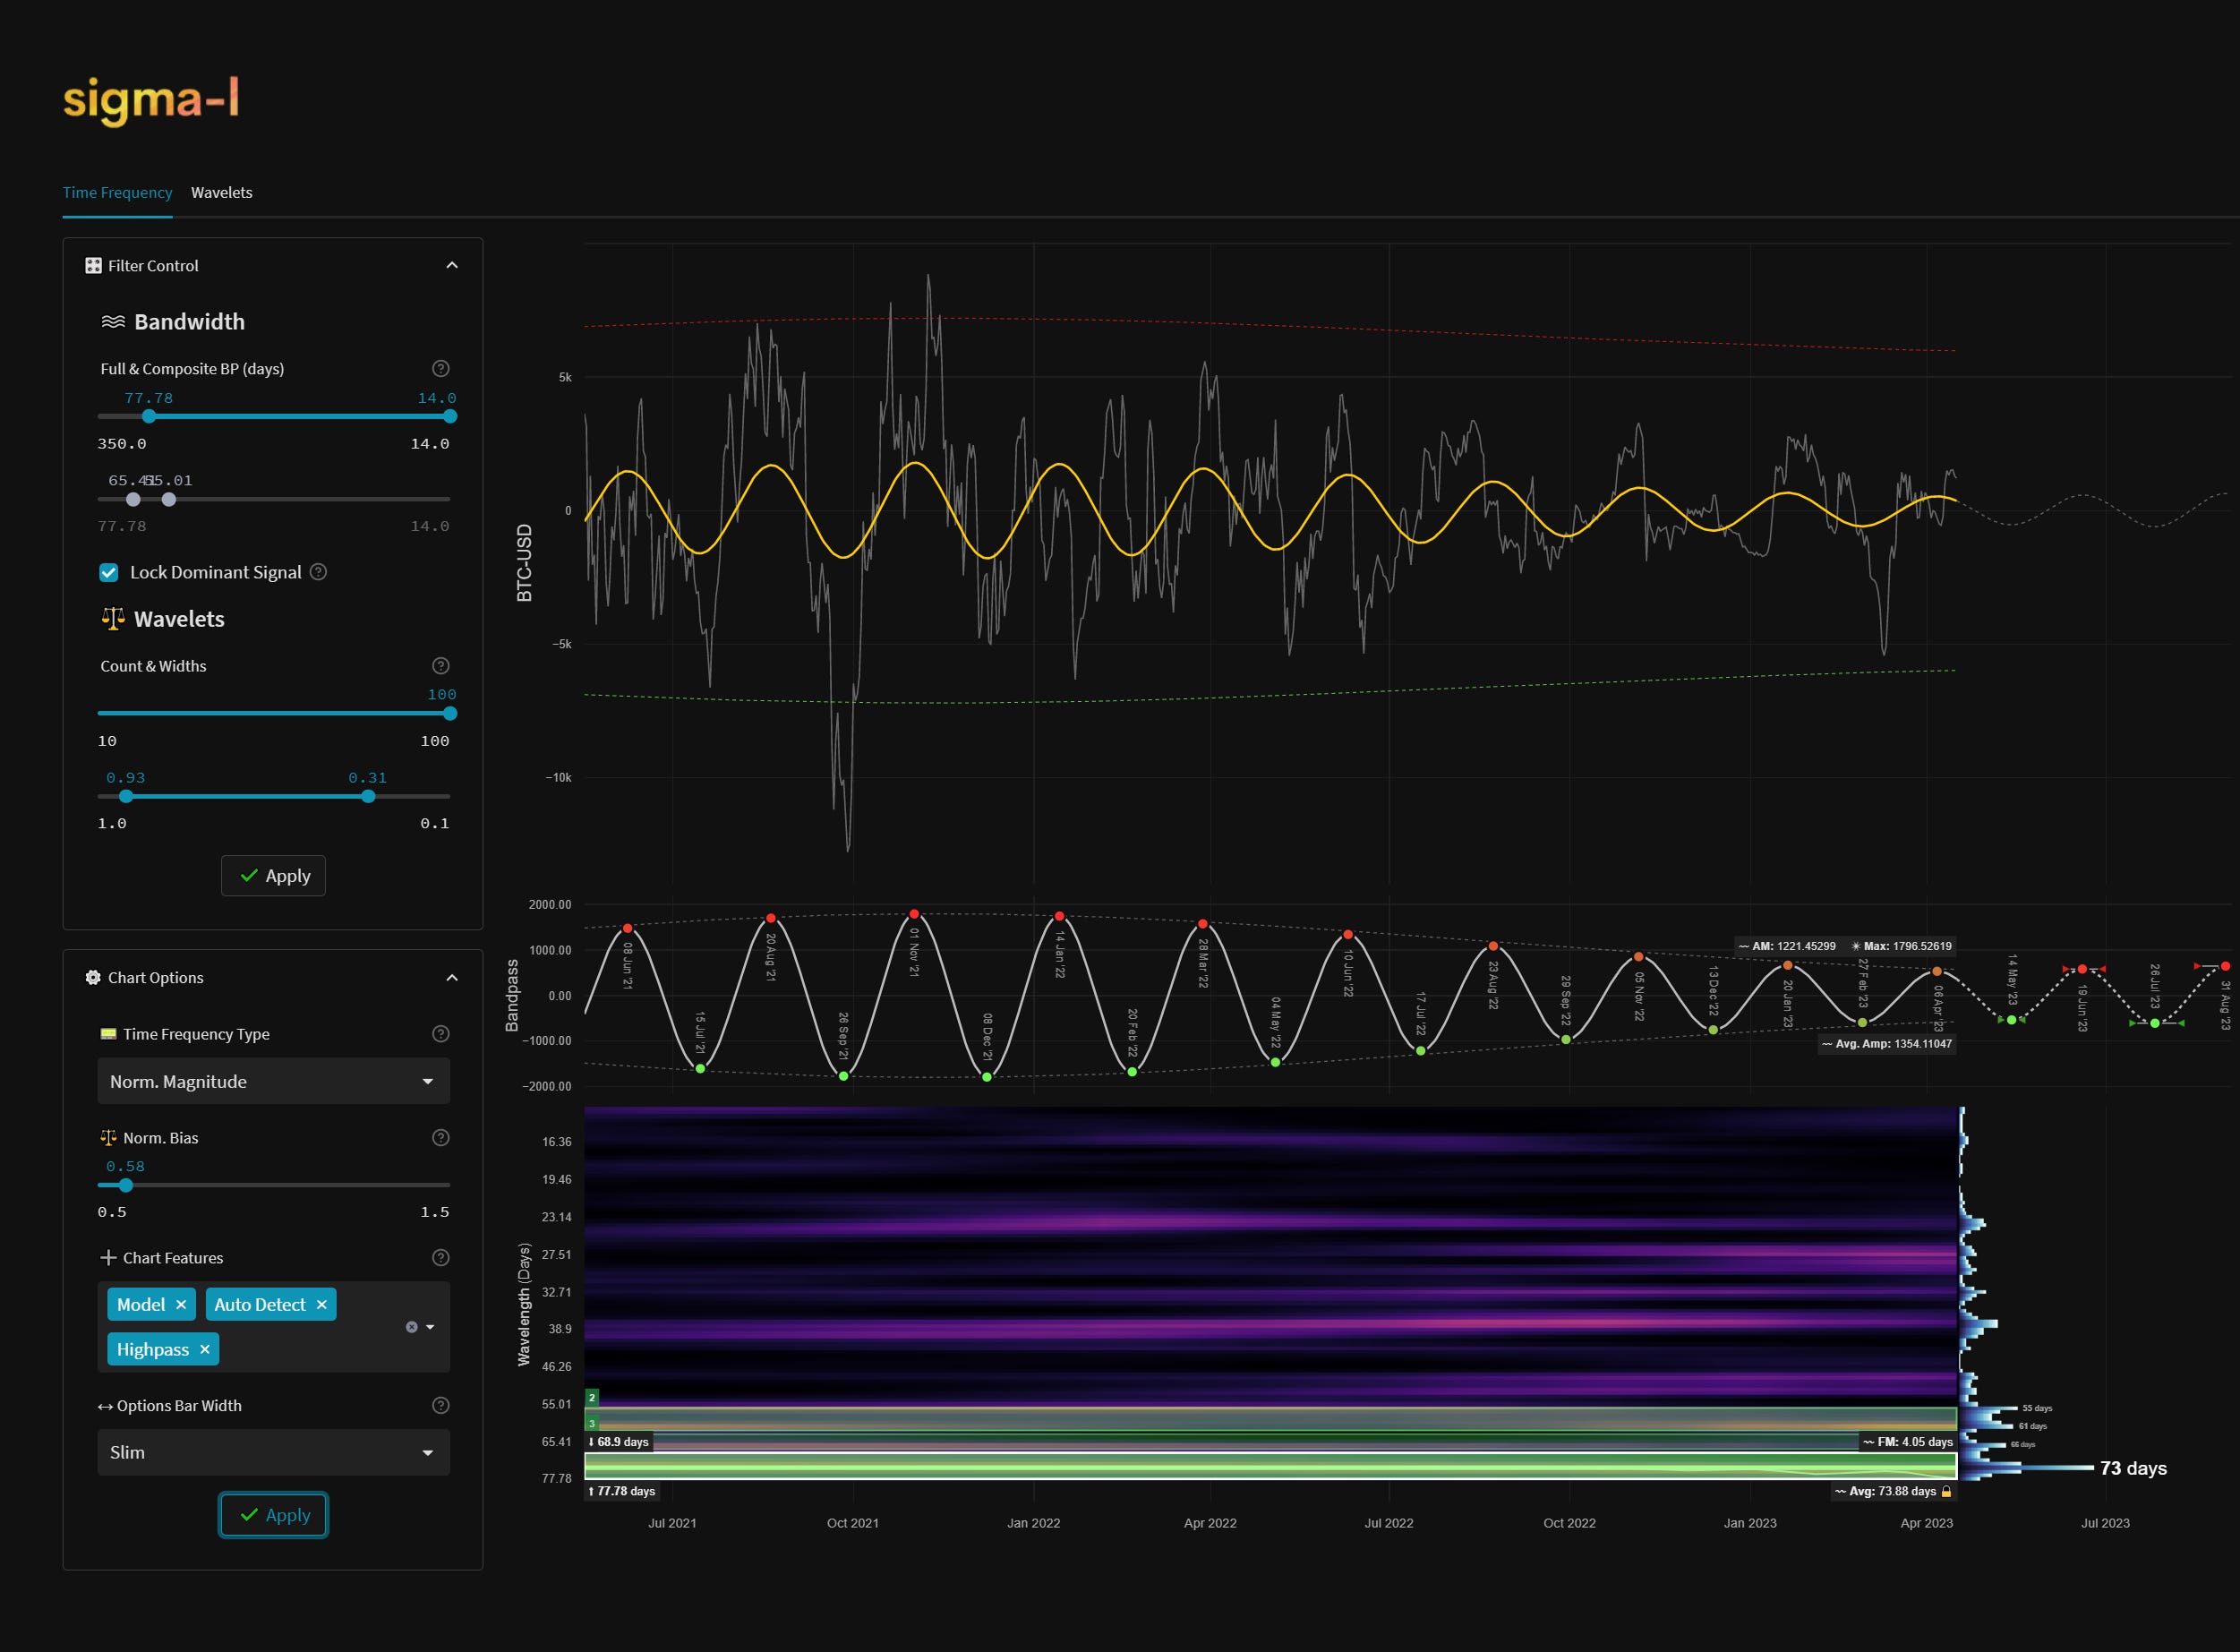
Shorter term the component around 65-75 average wavelength is starting to emerge from a noisy spectra (see below). We will need a couple more iterations to seperate it meaningfully and reduce the chance of being fooled by randomness here. This should always be the approach when considering financial market cycles - one or two iterations is no way to reject the null hypothesis! We have seen many signals that are incredible in markets over the last few years, this is, due to lack of iterations, not one of them.
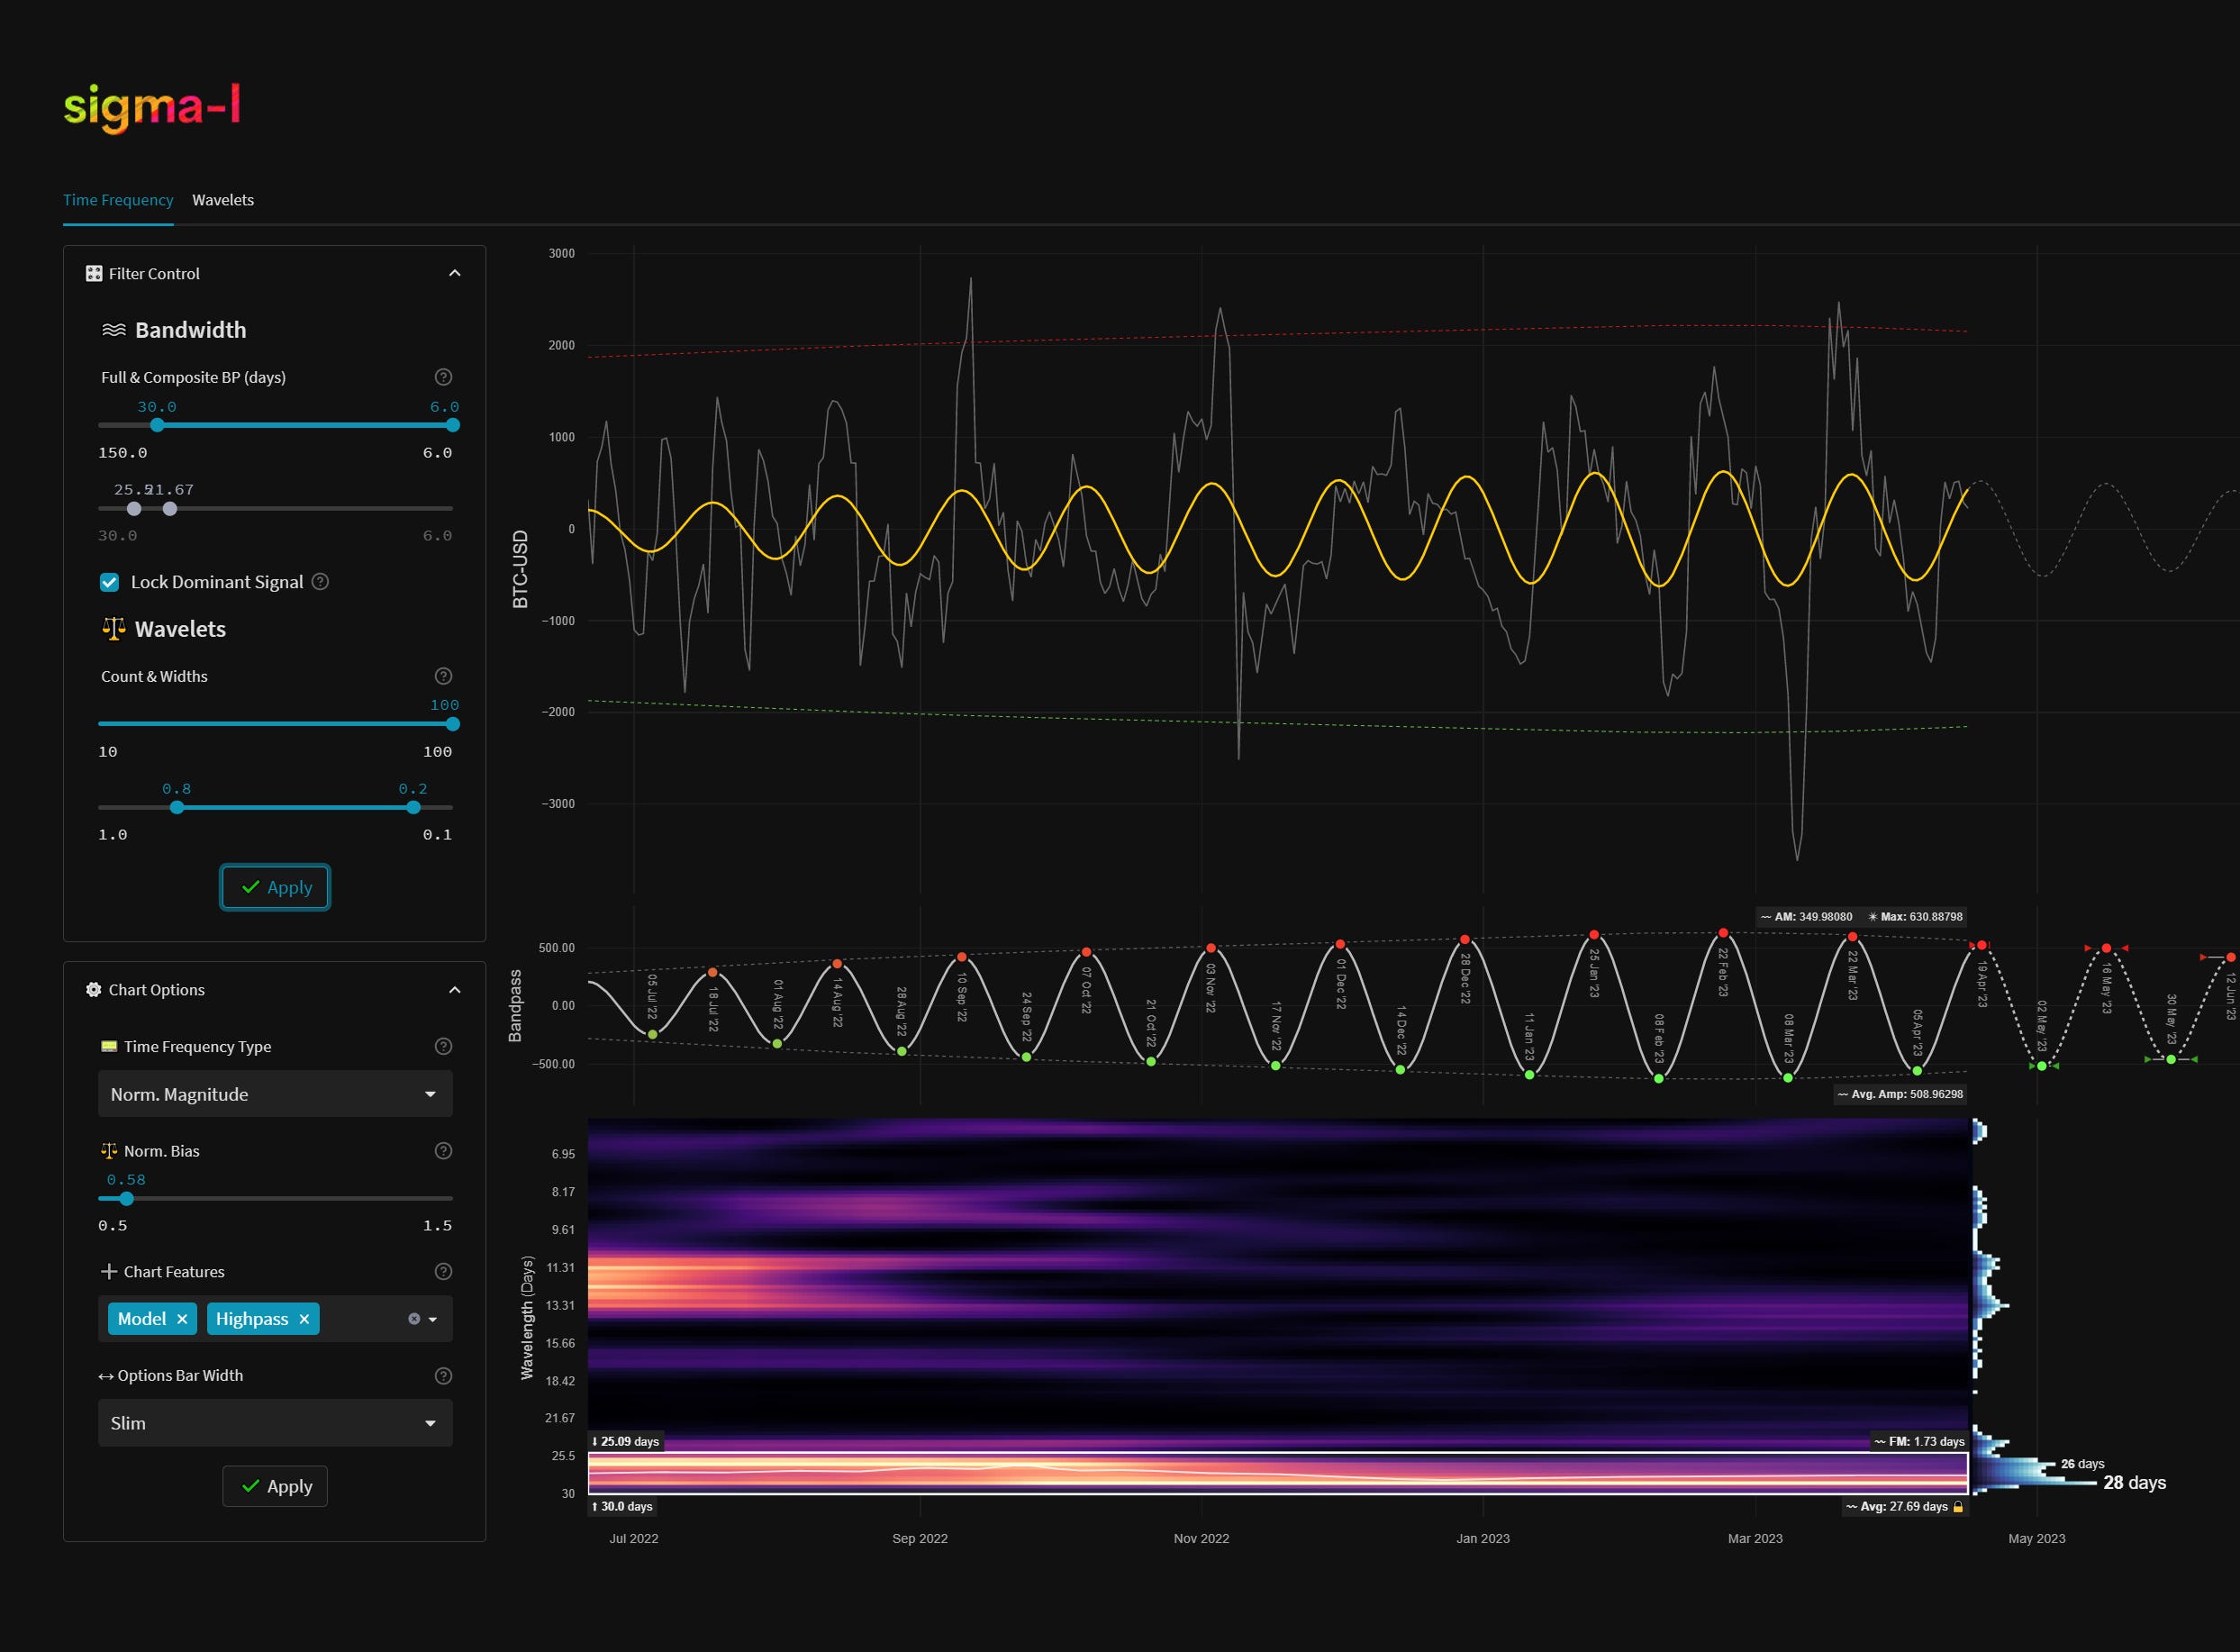
Of further note to subscribers is a component around 30 days (shown below on short term TFA), a stand out stationary wave, particularly over the last few iterations and peaking at the time of writing.
Phasing Analysis
Long Term
Components including and longer than the 18 month nominal wave
Medium Term
Components between the 20 week to 18 month nominal wave
Short Term
Components shorter than the 20 week nominal wave
Trading Strategy
Interaction Status
Interactions and price in the FLD Trading Strategy (Advanced). This looks at an idealised 40 week cycle and an array of 3 FLD signal cycles. We apply the instrument’s phasing to the model and arrive at an overall summary for the interactions with the 20 day FLD, current and forthcoming.

Sigma-L recommendation: Sell
Entry: 10 Day FLD / 20 Day FLD
Stop: Above forming 20 week nominal wave peak
Target: 25000 (20 week FLD support) then 20000 (40 week FLD support)
Reference 20 Day FLD Interaction: F3
Underlying 40 Day FLD Status: D2
Underlying 80 Day FLD Status: F
According to Sentient Trader the 18 month FLD cross target is at 29310 and has now been met and slightly exceeded.
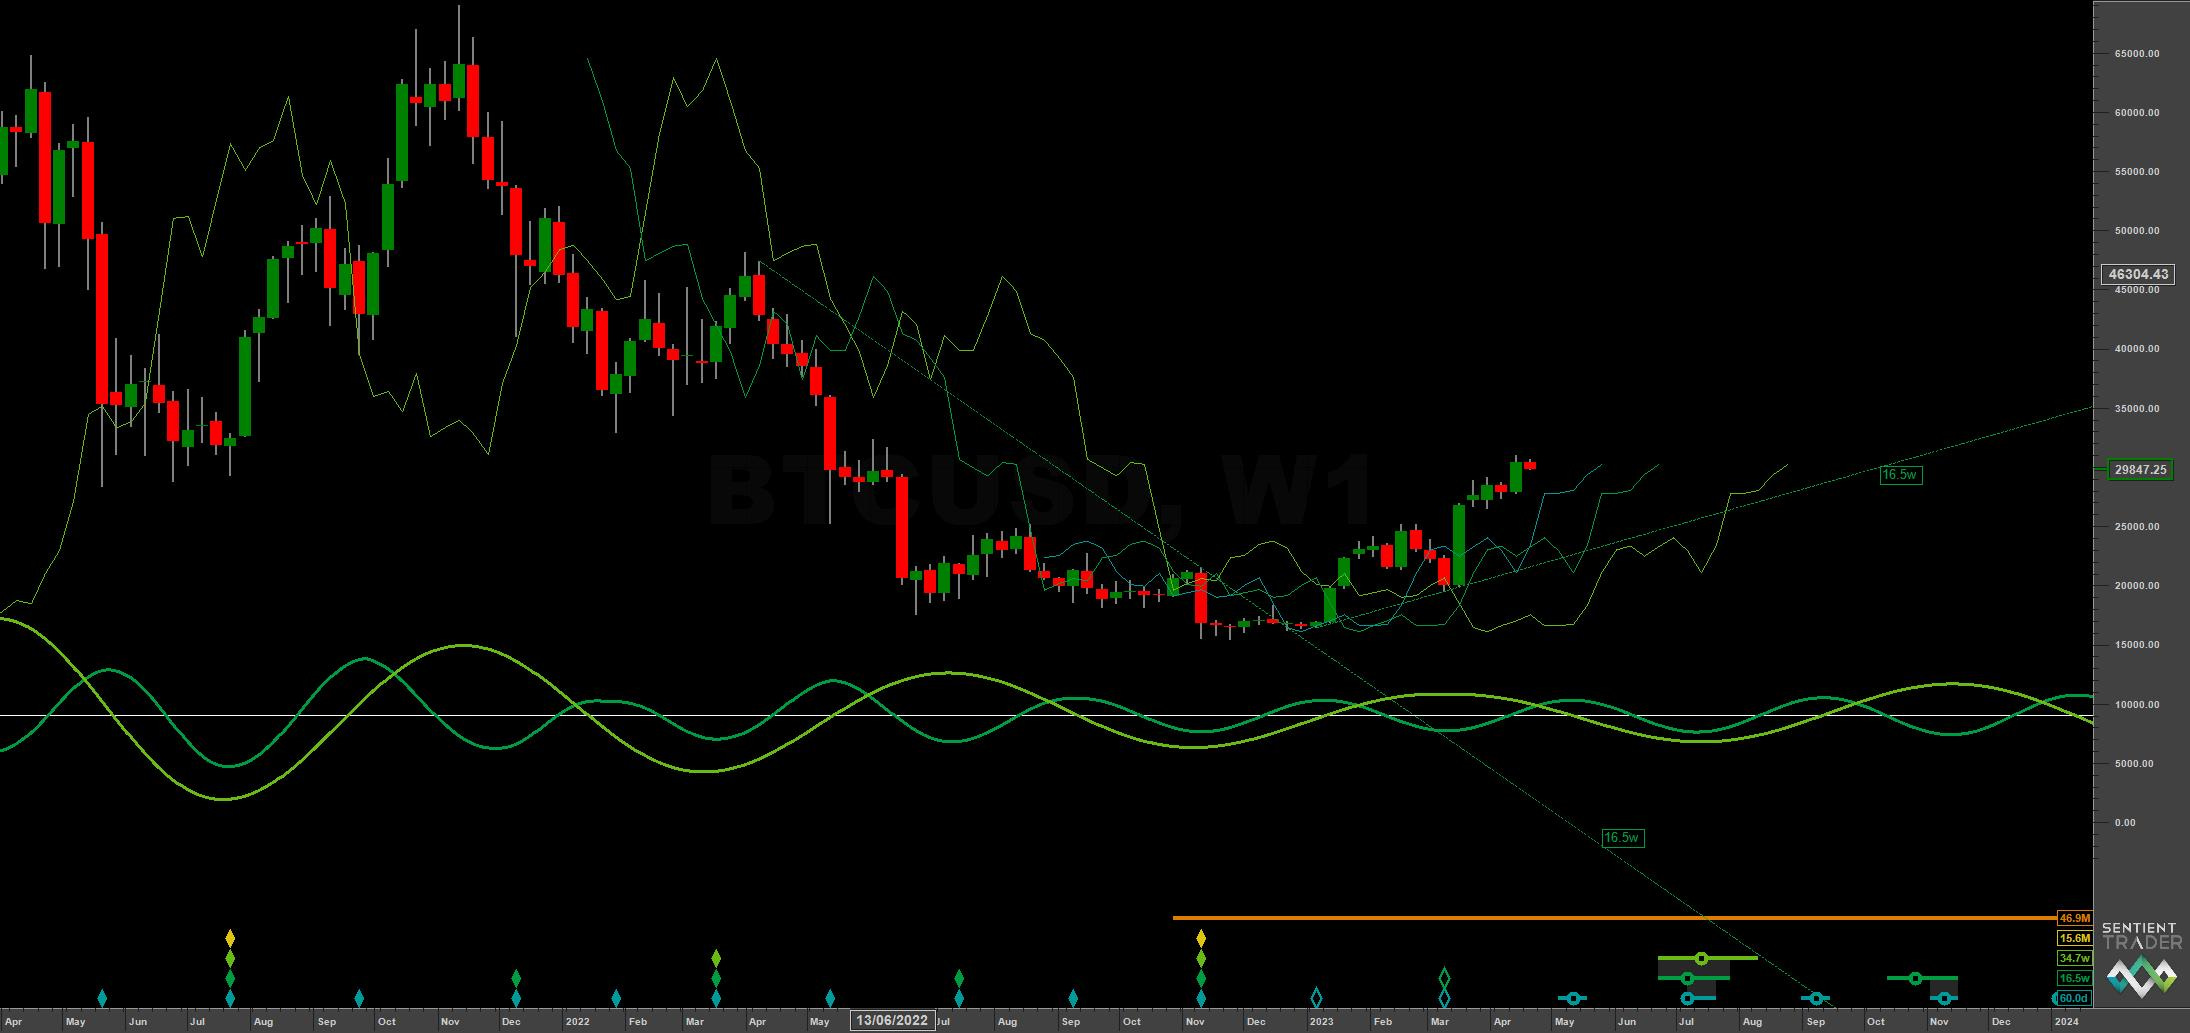
Price is currently around the 10 day FLD and likely peaking from the 80 day component in addition to a highly likely 20 week nominal wave peak. Support is down at 25000 for the end of this 80 day component, due early - mid May. Should the bear market be still in place (our current scenario) we should expect largely sideways to down price action into the 40 week nominal low early - mid July. There should be a bounce from the 80 day nominal wave component low in early - mid May but this will be relatively weak, assuming the longer term phasing is accurate.
A significantly higher high (above the forming 20 week nominal peak) from the 80 day nominal low in early - mid May is the outlier scenario at this point. This would indicate the low in November 2022 was almost certainly of larger magnitude than an 18 month component.
FLD Settings
If you do not have the use of Sentient Trader use these settings to plot common FLDs in your trading software (daily scale) to more easily follow trading signals and strategy from Sigma-L.
Make sure to account for non-trading days if your broker omits them in the data feed (weekends, for example). The below offsets are given with no added calculation for non-trading days.
80 day nominal: 60 days | 30 day FLD offset
40 day nominal: 30.7 days | 15 day FLD offset
20 day nominal: 15 days | 8 day FLD offset
10 day nominal: 7.5 days | 4 day FLD offset
Correlated Exposure
A non exhaustive list of correlated instruments for consideration
ProShares Bitcoin Strategy ETF BITO 0.00%↑
Valkyrie Bitcoin Strategy ETF BTF 0.00%↑
VanEck Bitcoin Strategy ETF XBTF 0.00%↑
Global X Blockchain & Bitcoin Strategy ETF BITS 0.00%↑
Global X Blockchain ETF BKCH 0.00%↑
Siren Nasdaq NexGen Economy ETF BLCN 0.00%↑
Bitwise Crypto Industry Innovators ETF BITF 0.00%↑
First Trust SkyBridge Crypto Industry and Digital Economy ETF CRPT 0.00%↑
Great work. This is beyond me ... so few subscribers with content of this quality.
ps - additionally bitcoin also found support at the 20W FLD at this point too, adding to the argument