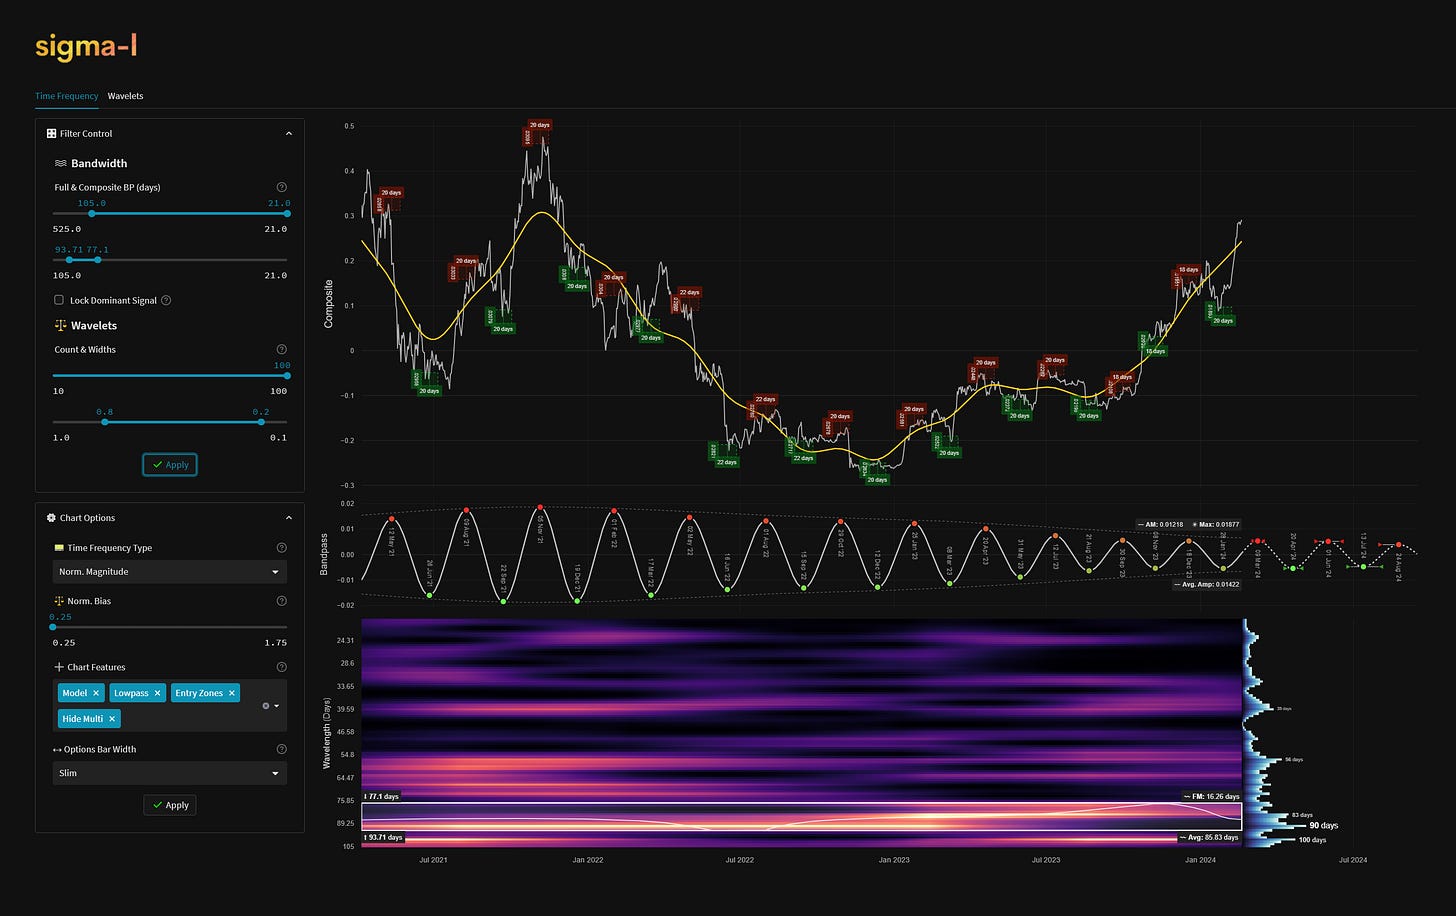
ΣL Bitcoin Composite - 19th April 2024 | @ 86 Days
'C' class signal detected in Sigma-L Bitcoin Composite (BTC vs USD/EUR/GBP). Average wavelength of 86 days over 12 iterations since April 2021. Currently troughing
ΣL Cycle Summary
Although this wave was considered a ‘no trade / early sell’ signal at the last report we have seen some encouraging signs of predictability, peaking when expected in mid March and subsequently pulling back to what should be the latest trough iteration. Certainly the bullish pressure to the upside was impressive, with some incredible amplitude boosting the up leg toward the peak, as shown below. A further move up in the coming weeks from the anticipated low of this component would be a welcome datapoint in identifying the main short term price driver in Bitcoin / crypto in general. The spectra is still, in the grand scheme of things and in comparison to other more clarified markets, notably noisy.
Before and After
Signal comparison between our last report and the current time, in chart format.
Time Frequency Analysis
Time frequency charts (learn more) below will typically show the cycle of interest against price, the bandpass output alone and the bandwidth of the component in the time frequency heatmap, framed in white. If a second chart is displayed it will usually show high-passed price with the extracted signal overlaid for visual clarity.


