Bitcoin - 29th May 2023 | @ 348 Hours
Last trade: + 4.05% | 'C' class signal detected in BTC/USD. Running at an average wavelength of 348 hours over 8 iterations since February 3rd, 2023. Currently approaching a peak.

Trade Update
Summary of the most recent trade enacted with this signal and according to the exact time prediction detailed in the previous post for this instrument. For a composite analysis, each constituent’s respective gain over the period is displayed, in descending order. The average of the constituent gain is also shown.
Type: Late Buy - Bitcoin 23rd May 2023
Entry: 23rd May 2023, 18:00 (GMT) @ 26924.48
Exit: 29th May 2023, 06:00 (GMT) @ 28014.73
Gain: 4.05%
Signal Class & Attributes
Defining characteristics of the component detected over the sample period.
Detected Signal Class: B - learn more
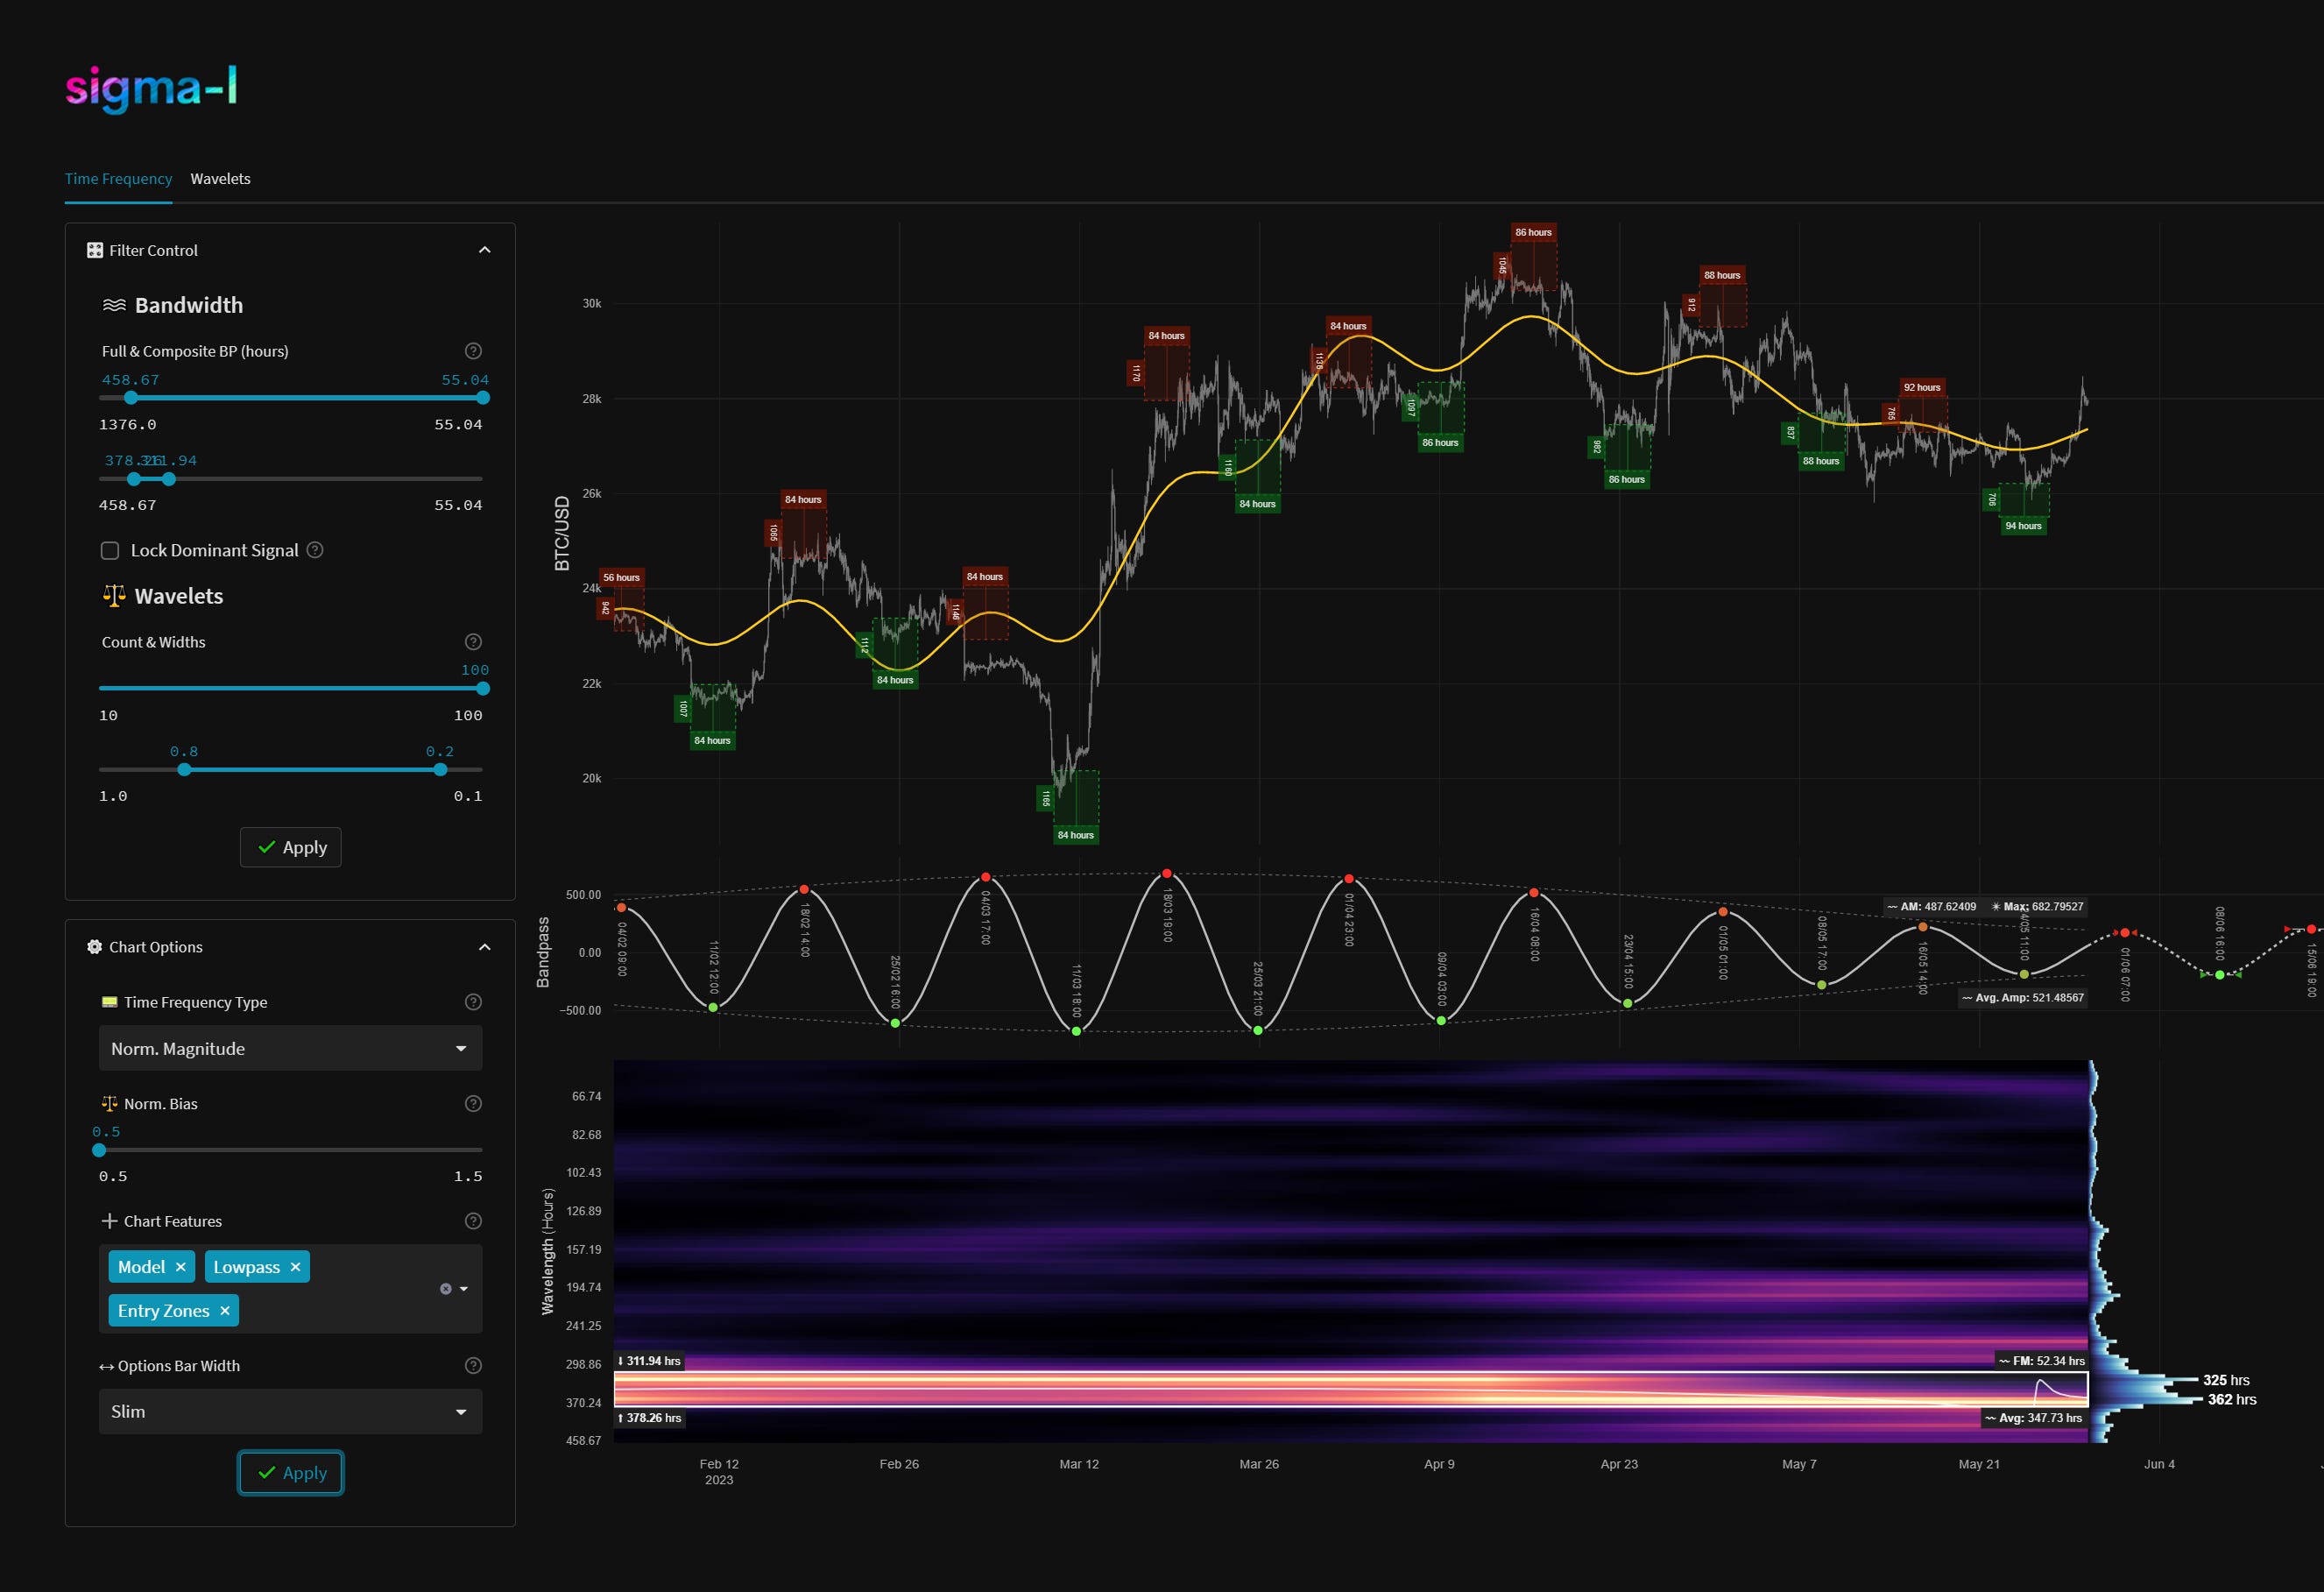
Average Wavelength: 347.73 Hours (14.49 Days)
Completed Iterations: 8
Time Frequency Analysis
Time frequency charts (learn more) below will typically show the cycle of interest against price, the bandpass output alone and the bandwidth of the component in the time frequency heatmap, framed in white. If a second chart is displayed it will usually show highpassed price with the extracted signal overlaid for visual clarity.