

ΣL August 2023 Results & September Preview
The Sigma-L portfolio saw a nominal loss of 14.31% (normalised -8.93%) in August 2023 via 39 trades. We also preview the packed September schedule and identify highlights

ΣL August 2023 Performance
Covering trade reports posted in August 2023 on Sigma-L.
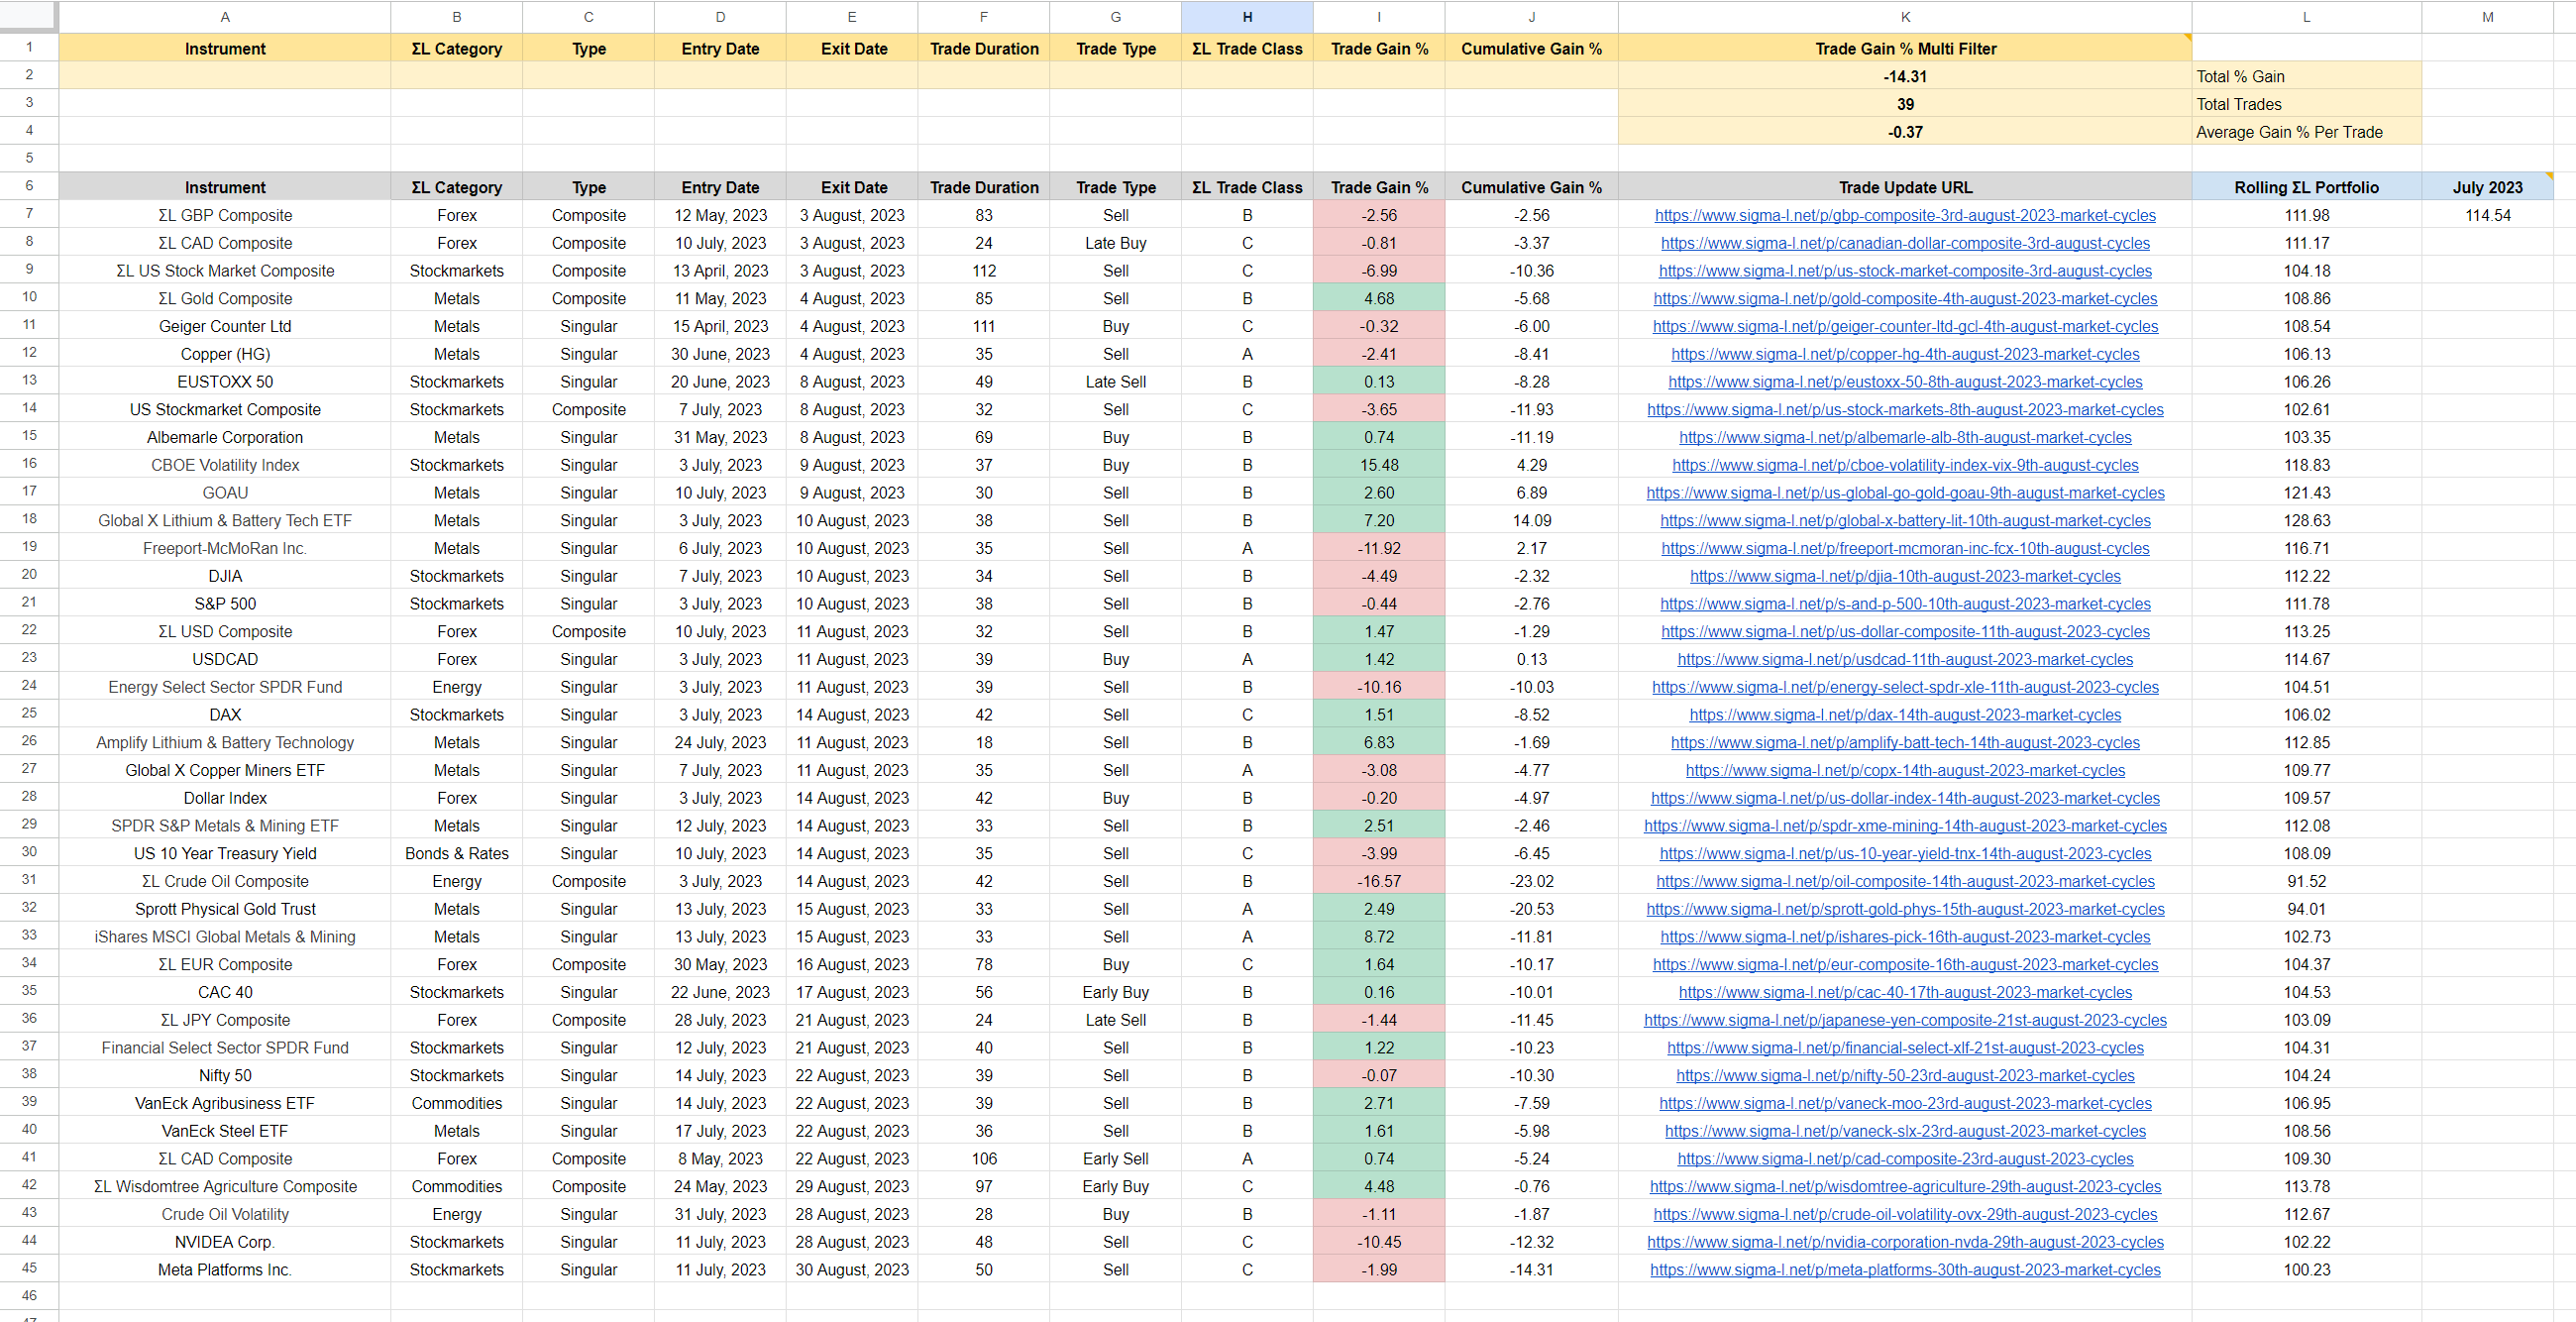
View the full trade list and details in Google Sheets
Headline Numbers
Sigma-L Nominal vs Benchmarks - August 2023
S&P 500 (-1.51%): -12.8%
Gold (-0.17%): -14.14%
WTI Crude Oil (1.91%): -16.22%
Bitcoin (-11.11%): -3.20%
Monthly Breakdown
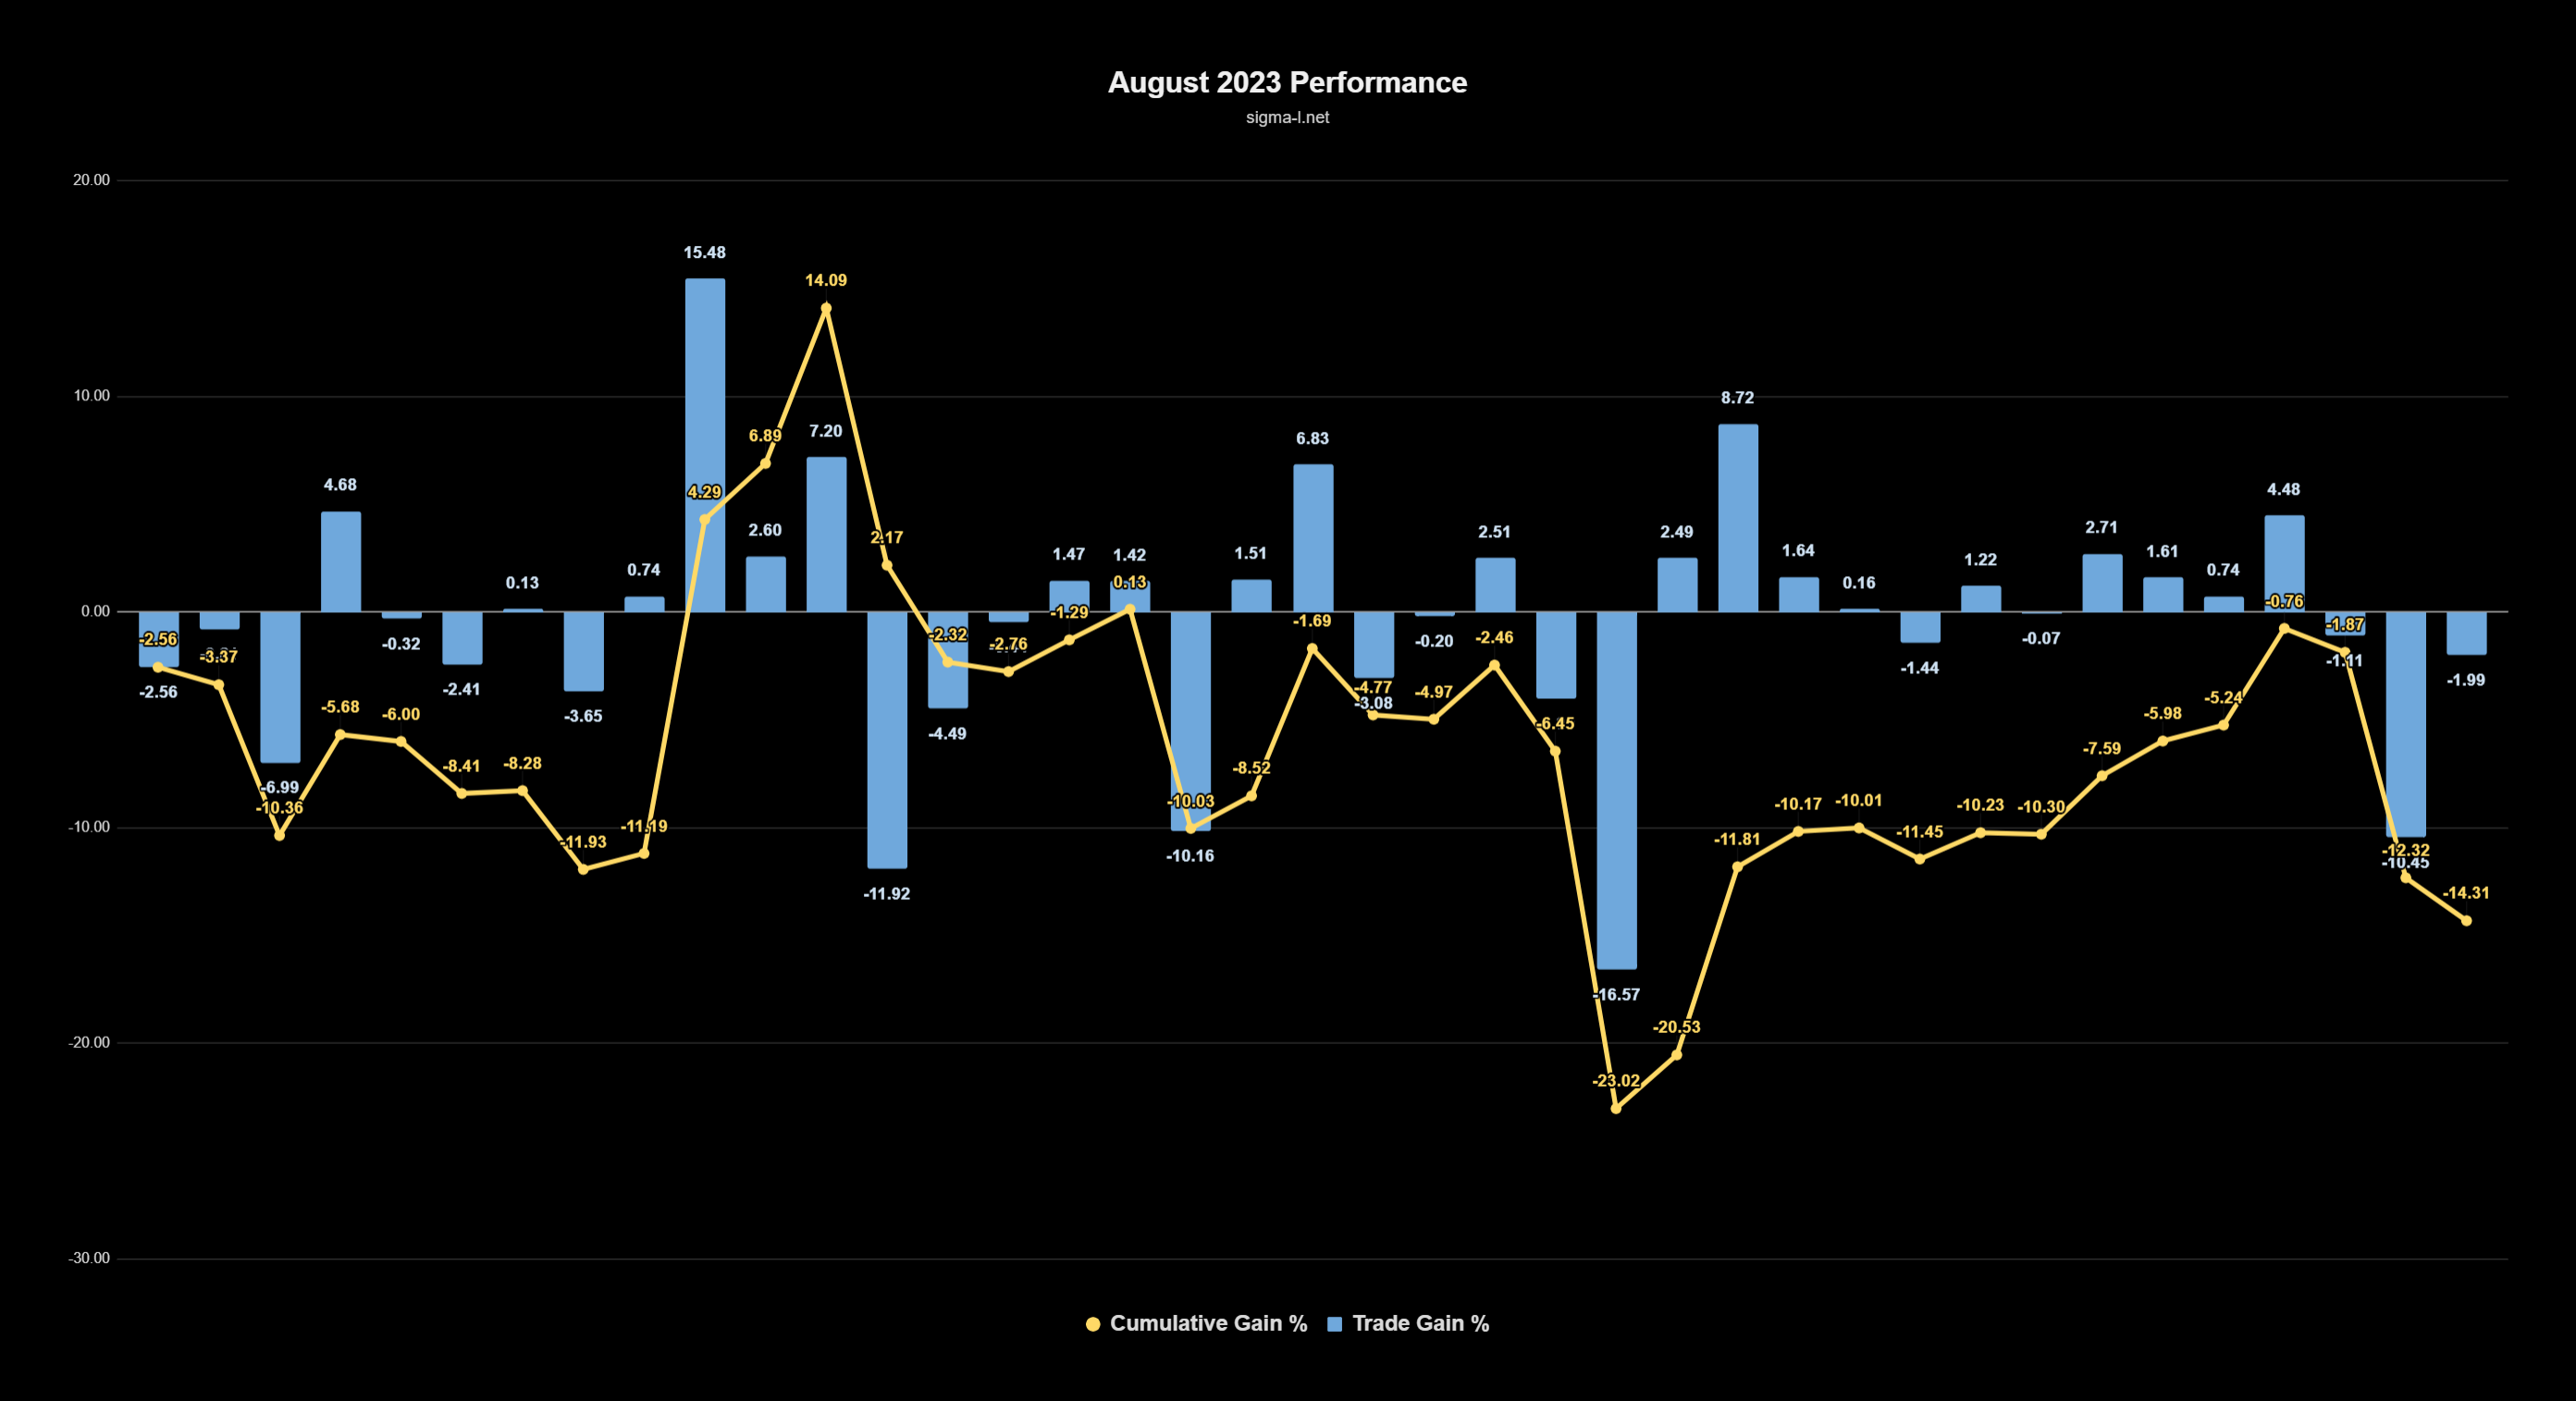
Total Gain: -14.31% / Total Trades: 39 / Win:Loss Ratio: 1.05:1 (20:19)
Average Gain Per Trade: -0.37%
Win Percentage: 51%
Average Win: 3.42% / Average Loss: -4.35%
Average Duration: 48 Days
Breakdown by Direction & ΣL Category
Sell Side
Total Gain: -35.79% / Trade Count: 29 / Win:Loss Ratio: 0.93:1 (14:15)
Average Gain Per Trade: -1.23%
Win Percentage: 48%
Average Win: 3.17% / Average Loss: -5.35%
Average Duration: 45 Days
Biggest Win: 8.72% → Sell - iShares MSCI Global Metals & Mining ETF 13th July 2023
Biggest Loss: -16.57% → Sell - ΣL Oil Composite 3rd July 2023
Buy Side
Total Gain: 21.48% / Trade Count: 10 / Win:Loss Ratio: 1.5:1 (6:4)
Average Gain Per Trade: 2.15%
Win Percentage: 60%
Average Win: 3.99% / Average Loss: -0.61%
Average Duration: 58 Days
Biggest Win: 15.48% → Buy - CBOE Volatility Index (VIX) 3rd July 2023
Biggest Loss: -1.11% → Buy - Crude Oil Volatility (OVX) 31st July 2023Gain By ΣL Category (Trade Count)
Metals: 19.65% (13)
Commodities: 7.19% (2)
Forex: 0.26% (8)
Cryptocurrency: 0% (0)
Bonds & Rates: -3.99% (1)
Stock Markets: -9.58% (12)
Energy: -27.84% (3)
Dates for your Diary - September 2023

ΣL September 2023 Highlights
August saw a small loss across the portfolio as we consolidated from a highly profitable July. Price action was relatively sideways across a large number of instruments in the month with the most prevalent component around 60-80 days providing little impetus in it’s latest iteration. Identified periodic components largely maintained their signal class, reflecting a stationarity in frequency that is paramount to future profitability. Within categories, metals once again outperformed (19.65%). The energy sector (-27.84%) contributed largely to the month’s loss - oil in particular.
Note: for component time targets that fall on a Saturday or Sunday, we will generally update these on the preceding Friday or following Monday.
Monday 4th September - US Natural Gas 108 Days
US Natural Gas has been subdued for months, tracing out a series of sideways iterations of the prominent component at around 108 days average wavelength. It is due to trough imminently, will we see some increased bullish power in the next iteration?
Wednesday 13th September - PHYS 56 Days
The Sprott Physical Gold Trust (PHYS) exhibits the beacon signal common in Gold, as you may expect, and has been identified as an ‘A’ category signal on Sigma-L. The latest peak of this component is coming up early-mid September.
Saturday 16th September - CBOE Volatility Index (VIX) 75 Days
The VIX has shown outstanding periodicity over a prolonged period with the component around 75 days a particular highlight. Useful in it’s ability to inversely correlate with the stock market, the latest incoming trough, mid September, will be fascinating.
Wednesday 20th September - S&P 500 75 Days
On a packed Wednesday for updates with 6 instruments being reported, the S&P 500 is one many will be watching. The component around 75 days is due to peak mid September and this could well also be a peak of larger magnitude.
Friday 22nd September - XAU/XAG 270 Days
One of the first instruments we phased using the time frequency method, this one will be of interest to precious metal subscribers. Silver has outperformed Gold over the latest iteration - that is due to end late September with the component forming a trough.
Sunday 24th September - US Stock Market Composite 76 Days
Alongside the S&P 500 mentioned above, other US indices are also peaking around this time. The composite provides clarity here and is useful to watch for a higher signal to noise ratio than individual indices. Includes the Russell 2000 and DJIA.
Thursday September 28th - COPX 79 Days
The Global X Copper Miners ETF is a popular vehicle for investors looking to gain exposure to the utility metal. Here the excellent component around 79 days is metronomic and due a peak late September.
A Quick Note on Strategy Optimisation
As mentioned in our July report and worth reiterating:
The time based signals and analysis we give on Sigma-L, grounded in our time frequency analysis, are deliberately under optimised. When proposing a trading strategy with a anticipated statistical edge, the analyst must be extremely careful to not overfit (curve fitting) and subsequently be fooled by randomness. In our case the error terms in the predictions are defined by modulation characteristics of the signal identified. It is these modulation ‘ranges’ which can possibly be further optimised to increase the already excellent edge this approach has.
Readers are, of course, free to add additional filters, time or price based, to optimise entry. One time based example might be to only enter trades which also have a larger, with trend, periodic component providing additional impetus. One price based example might be to use a momentum indicator as a signal for peak or trough occurrence.
Good results given Aug is a very confusing month in terms of market direction. Lots of right translated peak unexpected, possibly skewed by some larger cycle.