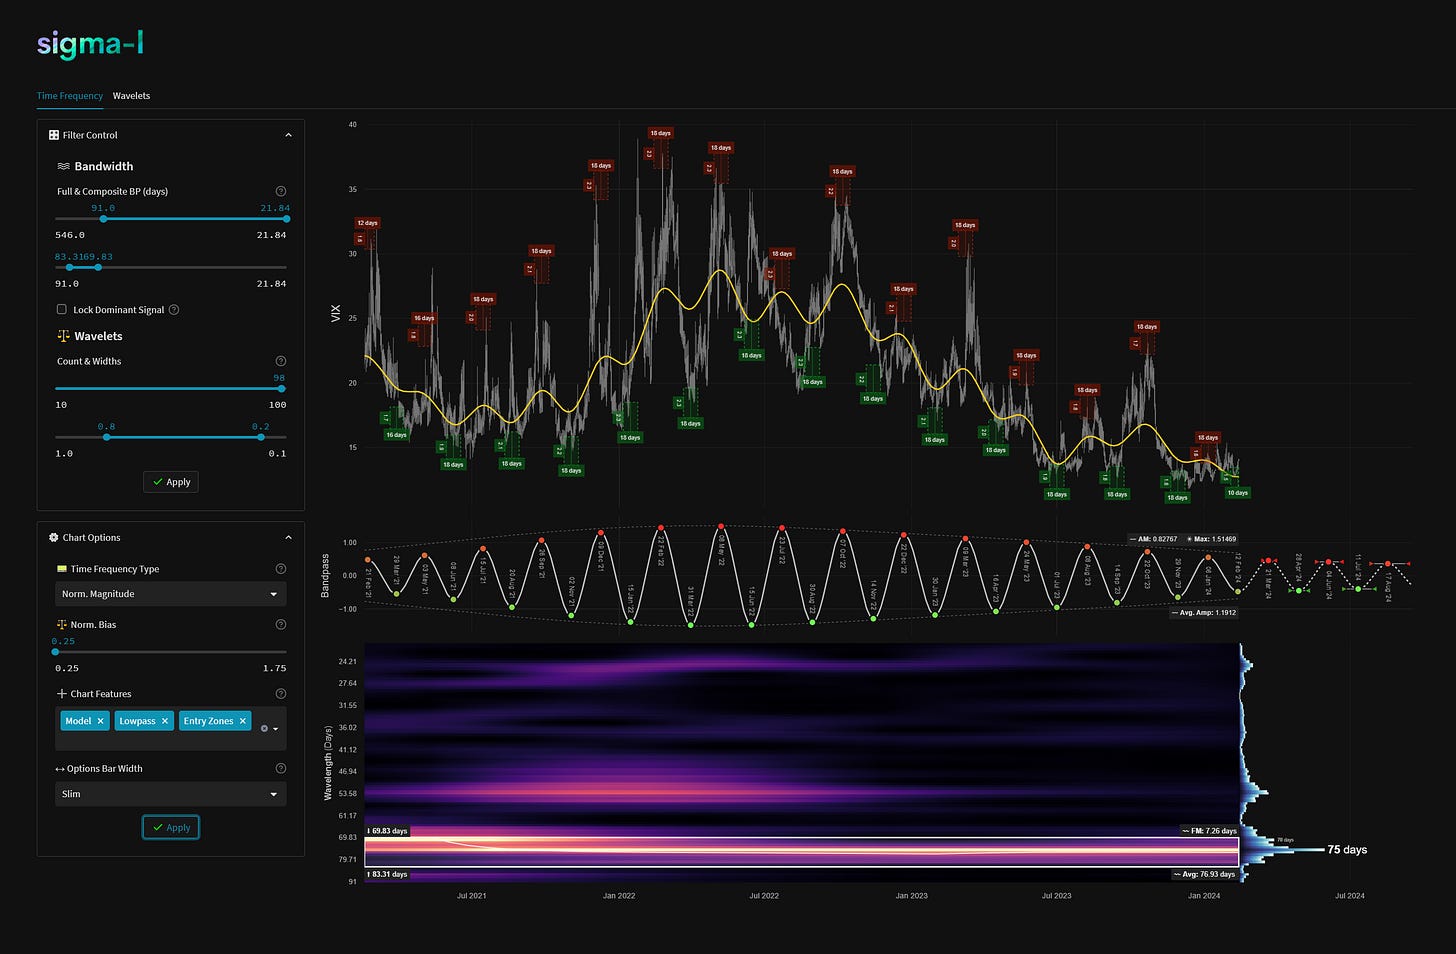
CBOE Volatility Index (VIX) - 27th March 2024 | @ 76 Days | - 6.45%
Last trade: - 6.45% | 'A' class signal detected in CBOE Volatility Index (VIX). Running at an average wavelength of 76 days over 15 iterations since February 2021. Currently hard down.
ΣL Cycle Summary
The move up from this component since mid February has once again been largely devoid of amplitude as volatility dwindles to levels not seen since 2019. Reflected largely in the S&P 500’s linear uptrend recently, the concurrent and inverse 80 day nominal wave is being suppressed by the larger wave’s bullish power in that and other global equity indices. In addition the price peak can be seen to be slightly left translated. In this situation we can but be patient and wait for the next opportunity, cognisant of the excellent periodicity of this wave in the past, shown evidently below in our time frequency analysis. Unfortunately amplitude (volatility) is much harder to predict than timing (frequency), the latter of which is extremely stationary in this instrument and component. The current phase is hard down with the next trough due mid-late April.
Trade Update
Summary of the most recent trade enacted with this signal and according to the time prediction detailed in the previous report for this instrument, linked below.
Type: Buy - CBOE Volatility Index 13th February 2024
Entry: 13th February 2024 @ 13.96
Exit: 27th March 2024 @ 13.06
Gain: - 6.45%
Before and After
Signal comparison between our last report and the current time, in chart format.
Time Frequency Analysis
Time frequency charts (learn more) below will typically show the cycle of interest against price, the bandpass output alone and the bandwidth of the component in the time frequency heatmap, framed in white. If a second chart is displayed it will usually show high-passed price with the extracted signal overlaid for visual clarity.


