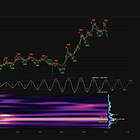
USDCAD - 20th June 2025 | @ 82 Days | - 0.52%
Last trade: - 0.52% | 'B' class signal detected in USDCAD. Running at an average wavelength of 82 days over 15 iterations since February 2022. Currently peaking.
ΣL Cycle Summary
A rare small loss in the metronome that is the ~ 80 day cycle in USDCAD, stable for many years and one of the most profitable periodic features in any financial market. The underlying trend is still down and this has weighed on the smaller wave here, forming what looks to be the first half of an overall bearish cycle and which is to be concluded toward the end of July. The time frequency spectra shows some mild frequency modulation toward a close and higher frequency. This is likely an artifact and we will see the 80 day resume stability (in terms of the frequency domain and resulting time frequency spectra) as the larger trend power dissipates.
Trade Update
Summary of the most recent trade enacted with this signal and according to the time prediction detailed in the previous report for this instrument, linked below.
Type: Buy - USDCAD 6th May 2025
Entry: 6th May 2025 @ 1.37753
Exit: 20th June 2025 @ 1.37037
Gain: -0.52%


