

ΣL CHF Composite - 26th February 2024 | @ 239 Days | + 1.54%
Last trade: + 1.54% | 'C' class signal detected in Sigma-L CHF composite (CHF vs JPY/USD/GBP/AUD/EUR/CAD/SGD/HKD). Avg. wavelength of 239 days over 12 iterations since June 2016. Turning down

ΣL Cycle Summary
A steady up leg in this latest iteration of what is notionally the 40 week nominal wave in the Swiss Franc here. In general the Swiss Franc has been in a strong uptrend since 2018, outperforming many fiat currencies - perhaps increased rates and the perceived superior yield of the Swiss Franc is attractive to many. Now peaking, we anticipate some down trending until late May at current wavelengths for this component. Within the composite, the Yen was the weakest performer whilst the British Pound hardly moved over the sample period since the last report.
Trade Update
See also: Live ΣL Portfolio & History
Summary of the most recent trade enacted with this signal and according to the time prediction detailed in the previous report for this instrument, linked below.
Type: Early Buy - ΣL CHF Composite 18th September 2023
Entry: 18th September, 2023
Exit: 26th February, 2024
For a composite analysis, each constituent’s respective gain over the period is displayed, in descending order. The average of the constituent gain is also shown.
Constituent Gain:
CHFJPY (4.16%)
CHFCAD (2.30%)
CHFHKD (2.30%)
CHFUSD (2.05%)
CHFSGD (0.72%)
CHFEUR (0.67%)
CHFAUD (0.31%)
CHFGBP (-0.20%)
Composite Average Gain:
1.54%
Before and After
Signal comparison between our last report and the current time, in chart format.
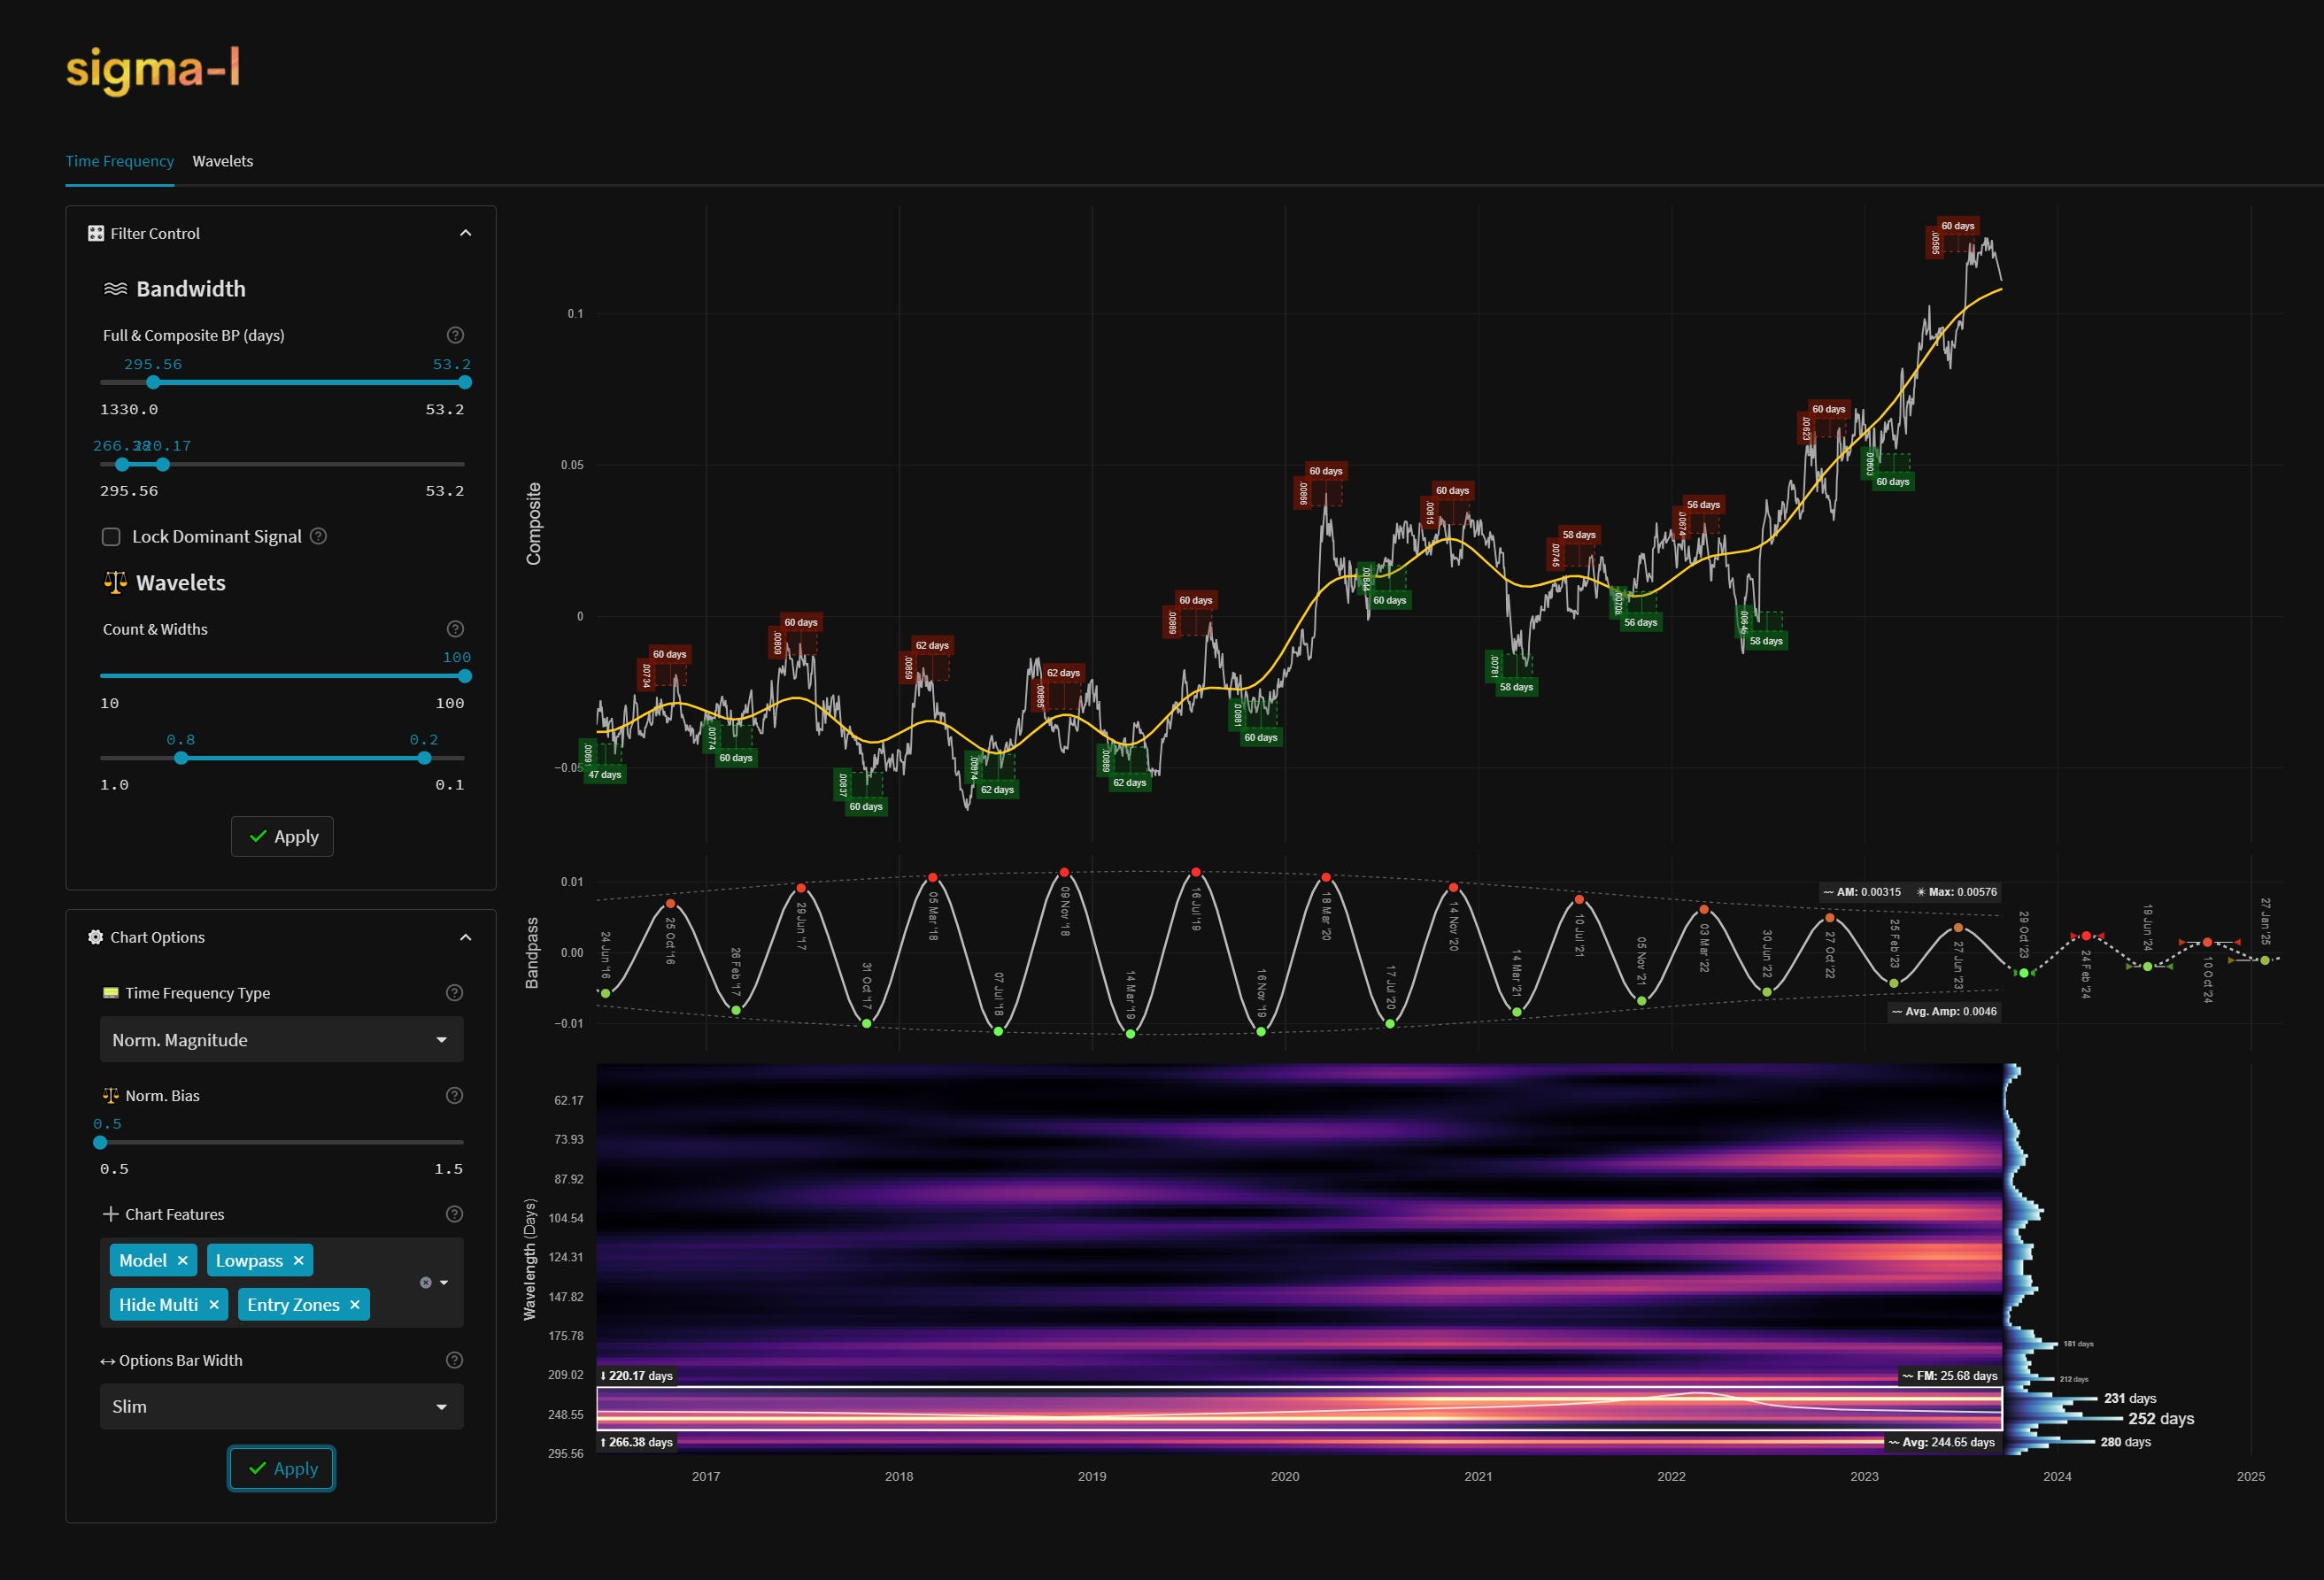
Time Frequency Analysis
Time frequency charts (learn more) below will typically show the cycle of interest against price, the bandpass output alone and the bandwidth of the component in the time frequency heatmap, framed in white. If a second chart is displayed it will usually show high-passed price with the extracted signal overlaid for visual clarity.