

VanEck Steel ETF (SLX) - 1st March 2024 | @ 80 Days | + 2.95%
Last trade: + 2.95% | 'B' class signal detected in the VanEck Steel ETF (SLX). Running at an average wavelength of 80 days over 13 iterations since April 2021. Currently peaking.


Instrument Summary
The VanEck Steel ETF (SLX) is an exchange-traded fund that aims to replicate the performance of the global steel industry. SLX provides investors with exposure to well-established steel companies worldwide, including prominent entities such as Nucor Corporation, Steel Dynamics Inc., POSCO, and ArcelorMittal.
ΣL Cycle Summary
A flat to bullish up leg has characterised price action in the latest move for Steel, via our proxy SLX. The larger wave around 280 days is due a trough shortly, so the culmination of the down leg of this wave will possibly cluster with that low, taking into account average frequency modulation as our rational error metric. Overall the shorter wave around 80 days is an excellent signal that is maintaining stationarity in both amplitude and frequency. The down leg, forthcoming here, should be more powerful than the recent pullback, given the overall phasing and influence of the longer wave, which is likely pushing down. There is an outside chance the larger cycle low has occurred in late January, which will be evident if the down leg of this shorter wave is flat. Early April will resolve this, see timing information below.
Trade Update
See also: Live ΣL Portfolio & History
Summary of the most recent trade enacted with this signal and according to the time prediction detailed in the previous report for this instrument, linked below.
Type: Buy - VanEck Steel ETF (SLX) 12th January 2024
Entry: 12th January 2024 @ 69.51
Exit: 1st March 2024 @ 71.56
Gain: 2.95%
Before and After
Signal comparison between our last report and the current time, in chart format.

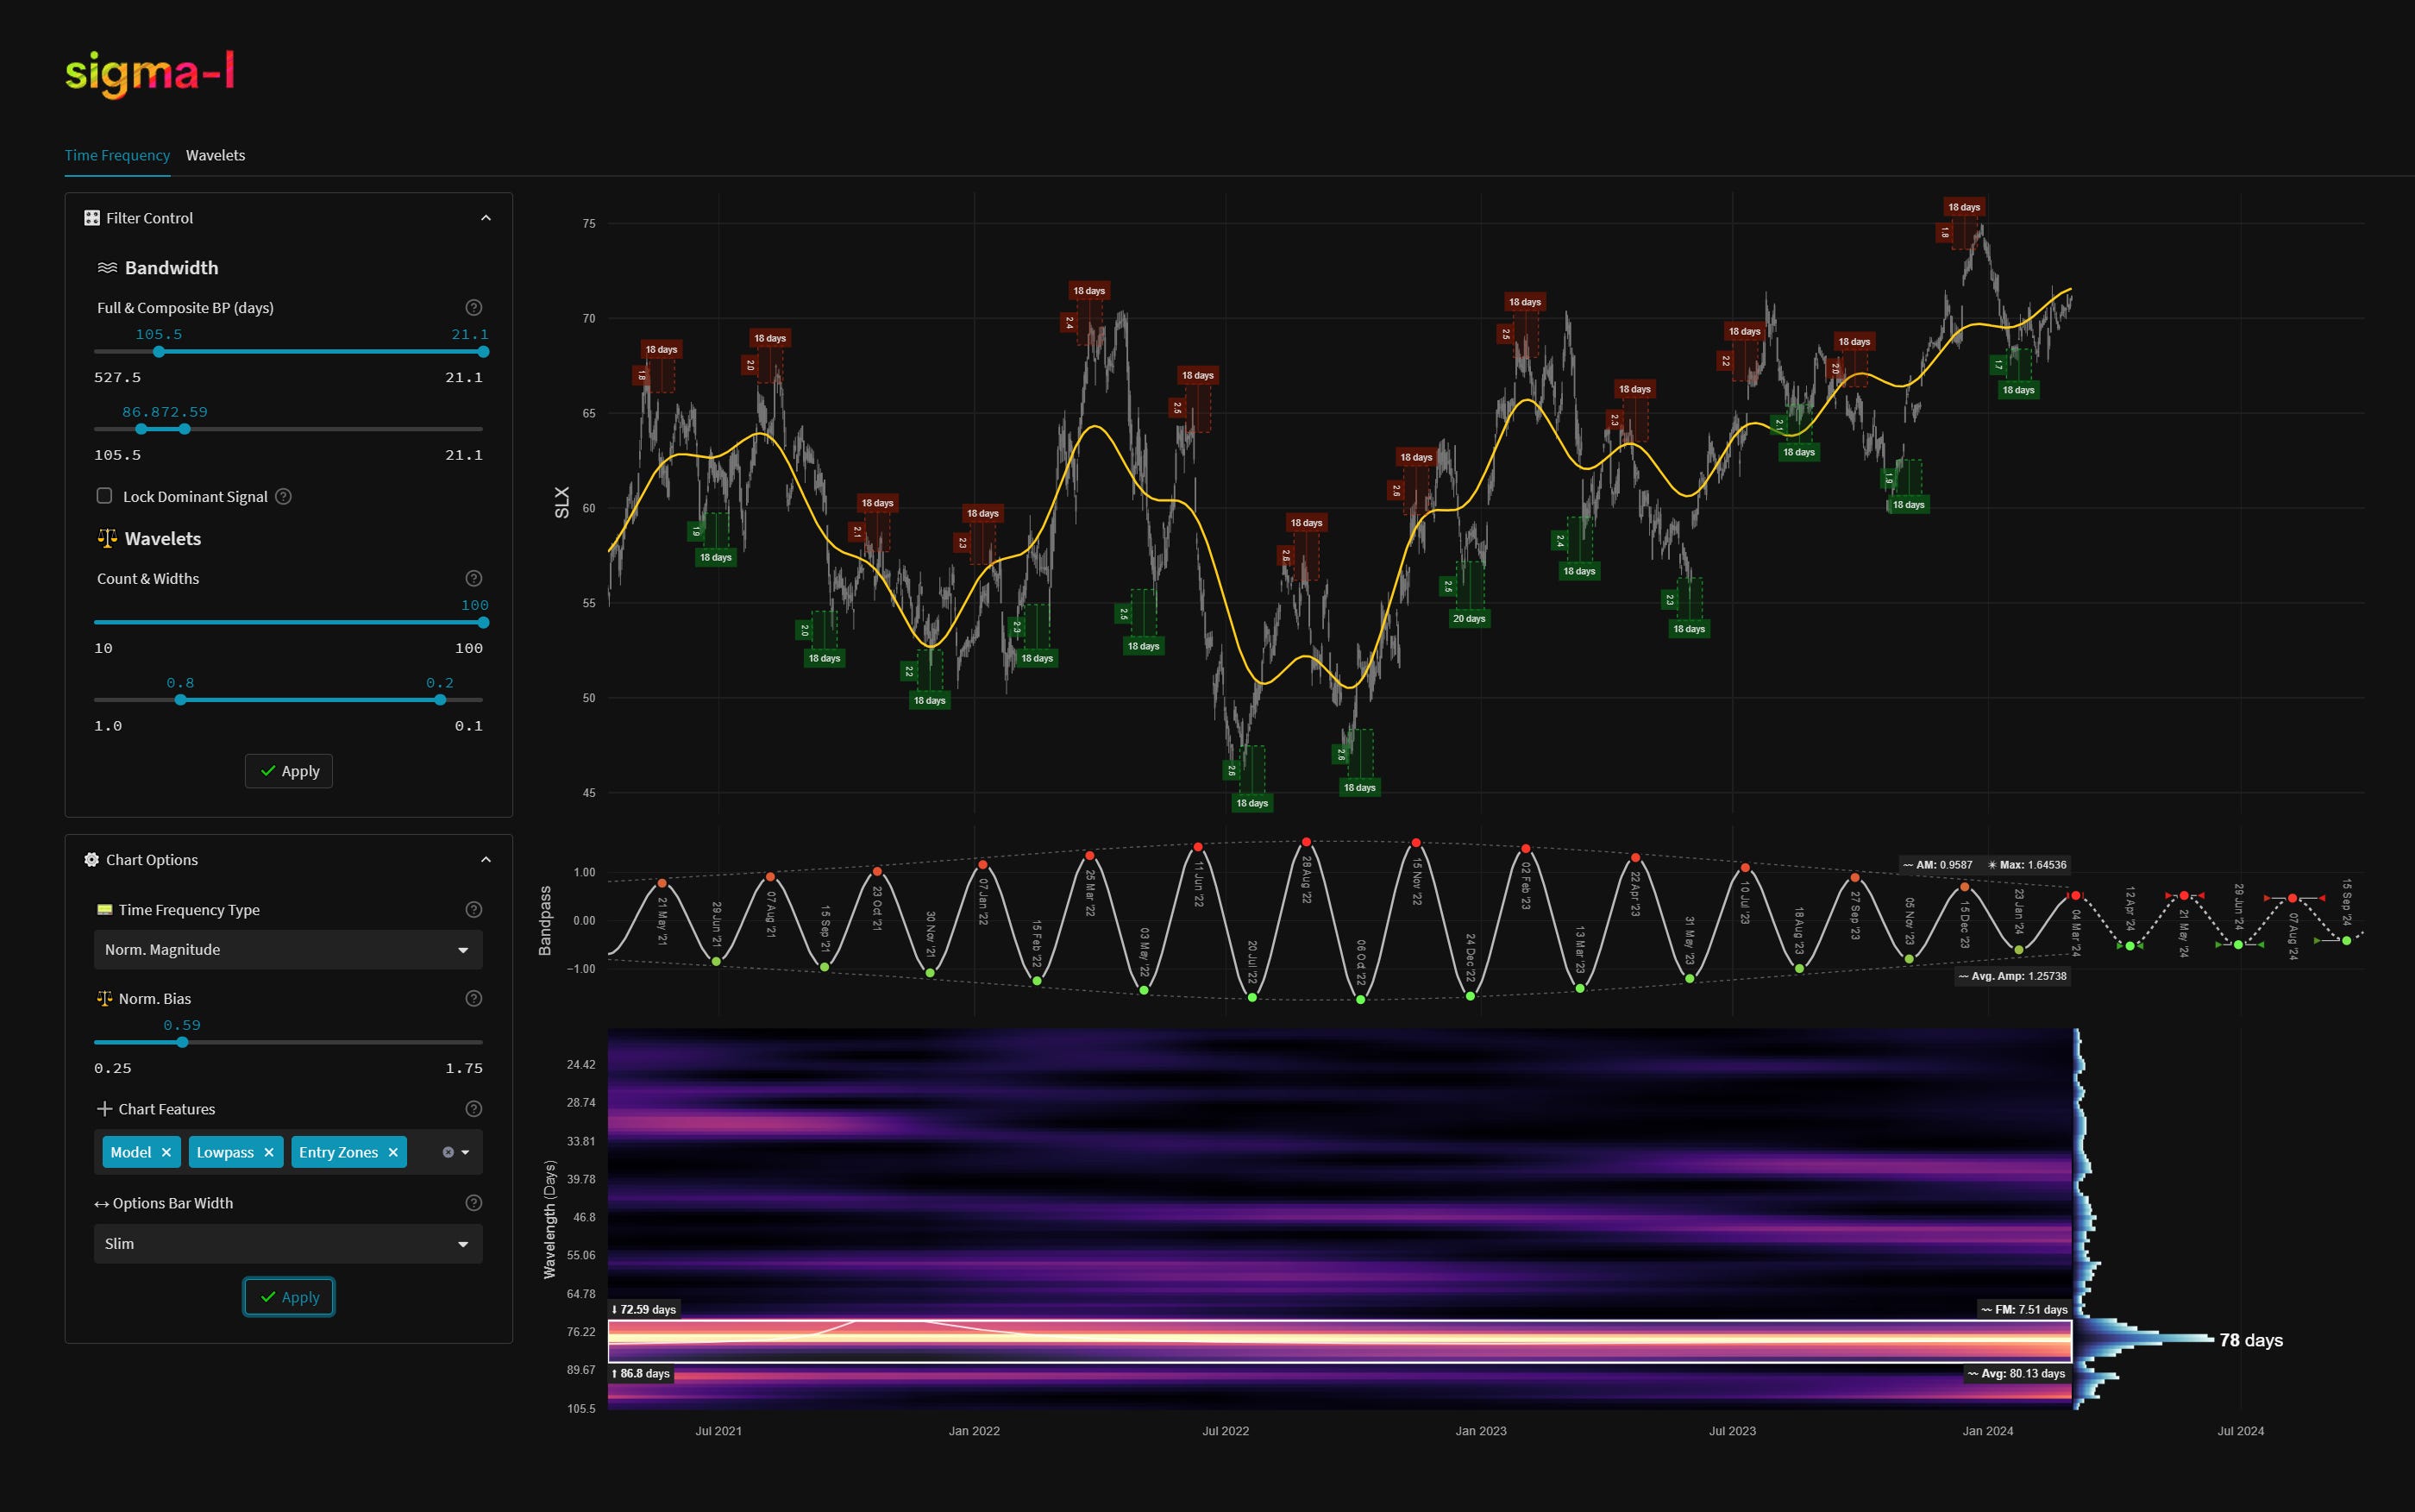
Time Frequency Analysis
Time frequency charts (learn more) below will typically show the cycle of interest against price, the bandpass output alone and the bandwidth of the component in the time frequency heatmap, framed in white. If a second chart is displayed it will usually show high-passed price with the extracted signal overlaid for visual clarity.