

VanEck Steel ETF (SLX) - 4th March 2024 | @ 282 Days | - 8.04%
Last trade: - 8.04% | 'B' class signal detected in VanEck Steel ETF (SLX). Running at an average wavelength of 282 days over 12 iterations since October 2015. Currently troughing


Instrument Summary
The VanEck Steel ETF (SLX) is an exchange-traded fund that aims to replicate the performance of the global steel industry. SLX provides investors with exposure to well-established steel companies worldwide, including prominent entities such as Nucor Corporation, Steel Dynamics Inc., POSCO, and ArcelorMittal.
ΣL Cycle Summary
The latest down leg of this historically quite stationary medium to long term wave in our Steel proxy has been flat to bullish over the period since early November 2023. There is clearly underlying power coming from the larger component low which troughed in 2020 and which underwent a pause in power (bull flag for those traditional TAs!) between November 2021 and May 2023, allowing this wave to beat with clarity during that period. A smaller wave has punctuated the current iteration of this cycle (@ ~ 282 days), which, according to the phasing analysis is troughing at the time of writing +- some notable frequency modulation of around 31 days.
Trade Update
See also: Live ΣL Portfolio & History
Summary of the most recent trade enacted with this signal and according to the time prediction detailed in the previous report for this instrument, linked below.
Type: Sell - SLX 3rd November 2023
Entry: 3rd November 2023 @ 65.64
Exit: 4th March 2024 @ 70.92
Gain: - 8.04%
Before and After
Signal comparison between our last report and the current time, in chart format.
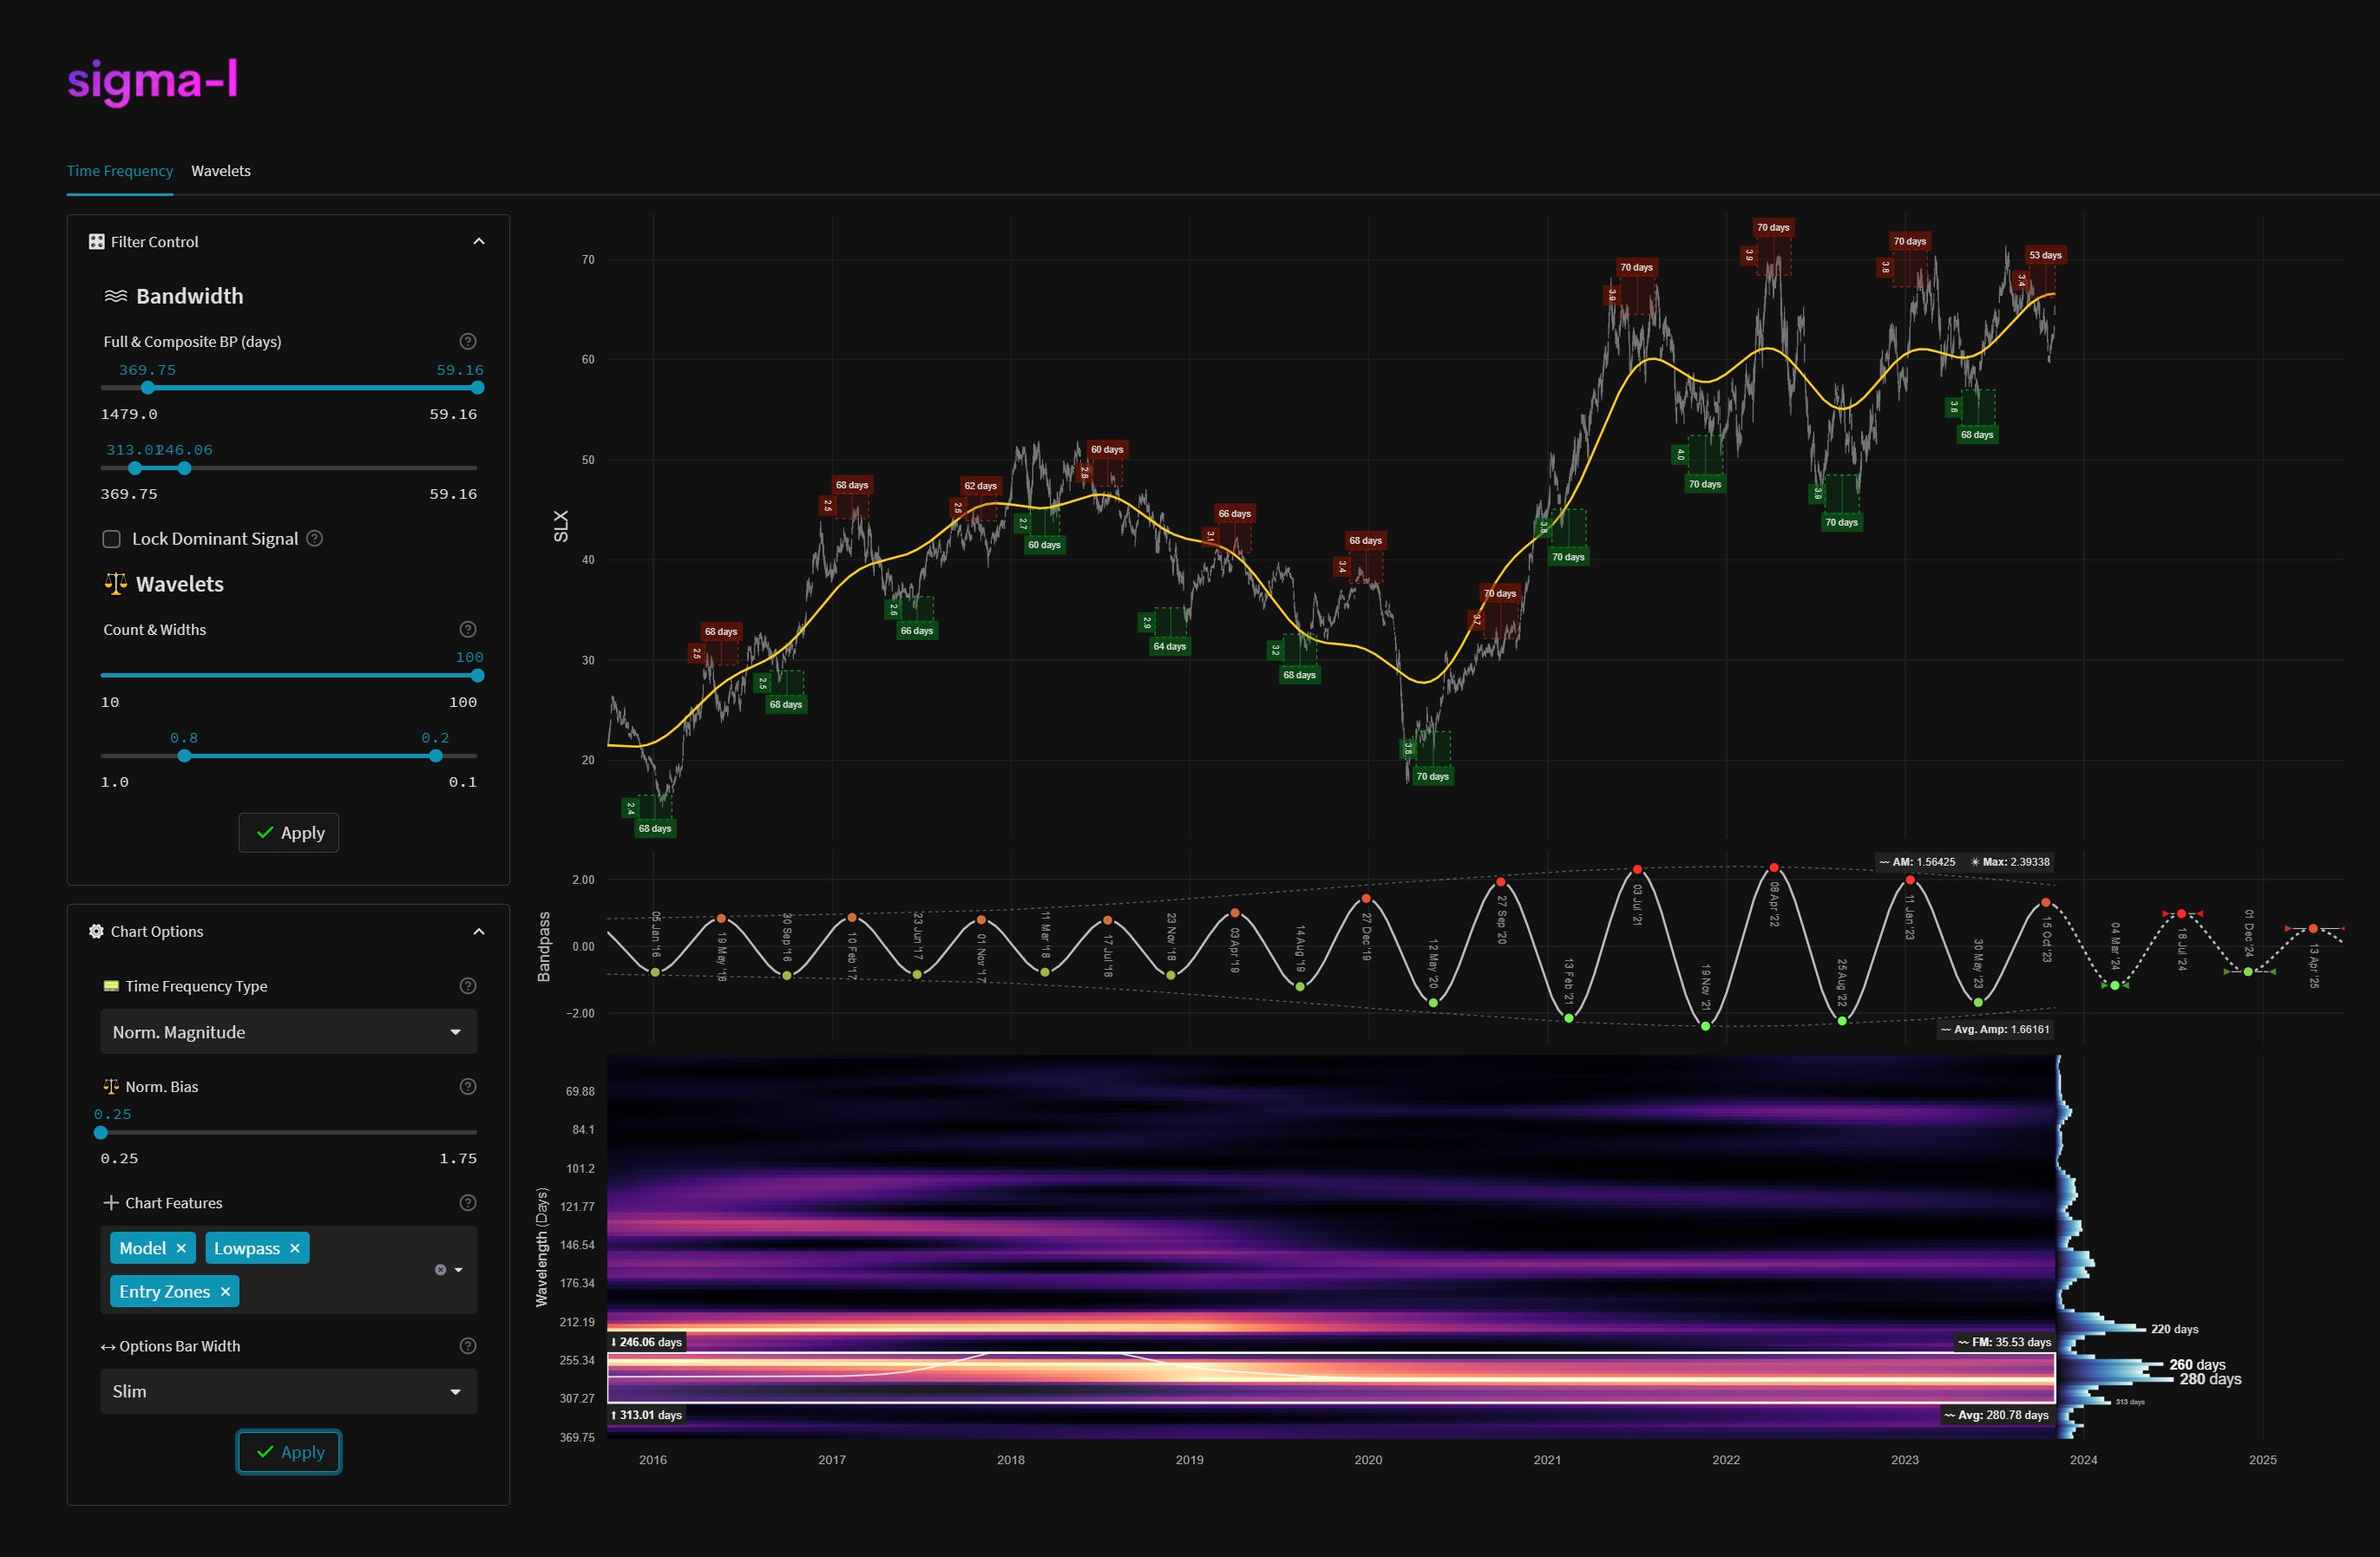

Time Frequency Analysis
Time frequency charts (learn more) below will typically show the cycle of interest against price, the bandpass output alone and the bandwidth of the component in the time frequency heatmap, framed in white. If a second chart is displayed it will usually show high-passed price with the extracted signal overlaid for visual clarity.