S&P 500: Hurst Cycles - 18th November 2022
The S&P 500 moves from what is now likely to be the 18 month nominal low, formed mid October. As price reaches an imminent 80 day component peak, we look at what to expect and the trading strategy
Tools required: Nominal Model | FLD | FLD Trading Strategy | FLD Trading Strategy (Advanced) | Principle of Nominality | Underlying Trend
Analysis Summary
The S&P 500 has performed relatively poorly when placed against the DJIA in recent weeks, aswell as European counterparts in the FTSE and DAX. Taken alone, this could cause the naive analyst to conclude the probability of the 18 month component low occurring mid October is lower. However, when taken in the round and giving a nod to commonality amongst global markets, it is highly likely the larger low has, infact, occurred.
The price action we alluded to in our last report was relatively bullish, although the 20 day FLD was breached with some vigour.
From 26th October Report:
So, the next move is crucial is clarifying the low on the 13th October. Which other aspects of price action can we examine for more evidence? Well, we can look at where price will likely find support in this next move and correlate it to what we might expect for each scenario.
40 day nominal low alone: price should break down through the 20 day FLD below price (3700) easily and rapidly.
20 week nominal low has formed: price will find support at the 20 day FLD in a ‘B’ category interaction.
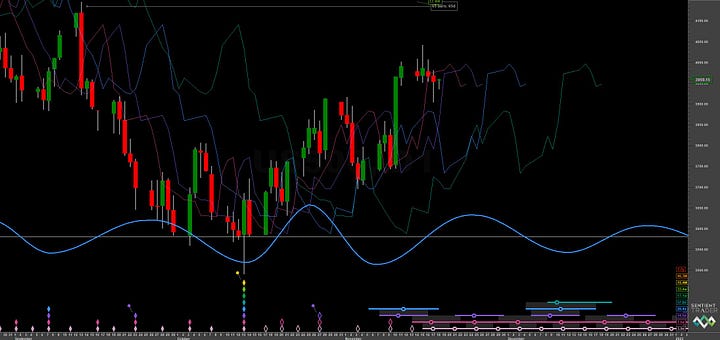
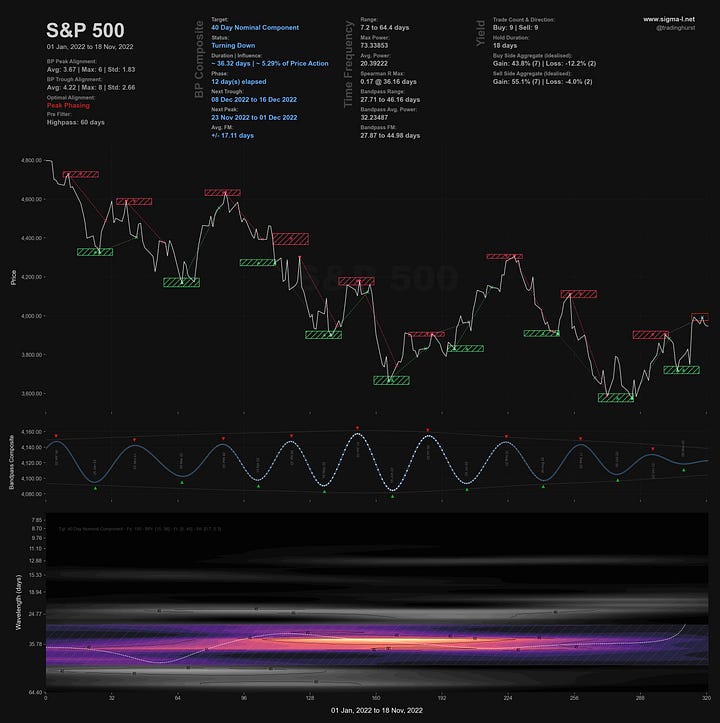
What actually happened and is compelling here is that price found support at the 40 day and 80 day FLDs, shown on the short term charts below, at the area of 3700. Subsequently price tracked the 40 day FLD, moving up and out of what is highly likely to be the 40 day component low on the 10th November. The 40 day FLD forms the signal cycle of the 20 week component trading cycle, a component that is highly dominant at the moment (see time frequency analysis below) and so interactions should be noted. The next interaction at this point would be the ‘D’ category, price falling into the 80 day nominal low whilst being expected to meet targets made from a cross down through the 40 day FLD.
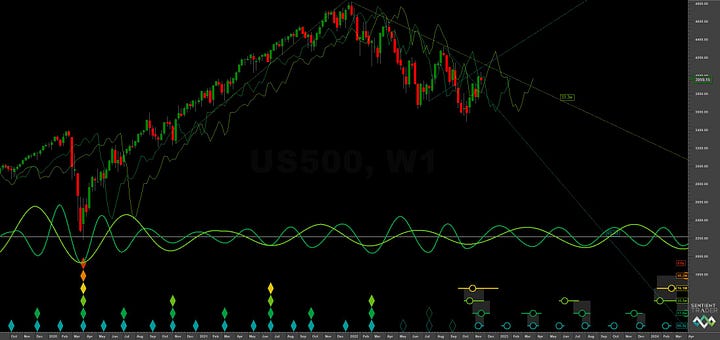
At the medium term we have to watch how price forms the 80 day nominal low and whether it is generally tracking the 20 week FLD down to that low in coming weeks. We then expect price to bounce once again, tracking further the 20 week FLD to approach the 40 week FLD. At that point, in early 2023, we can anticipate the first signs of a continuation of the bear market and a validation of the phasing at the long term.
The longer term phasing is stable, one can always question the 4.5 year nominal low in 2020, however. This uncertainty will be resolved by the 1st quarter 2023 as the 20 week component of this current 18 month component resolves. A neutral to bearish shape of the 20 week component would most likely confirm the current placement of the 4.5 year component low in 2020 is correct and we can expect a bearish 2023. This is against the placement of it in 2019, which would imply the 4.5 year component has just occurred.
The position of the 4.5 year FLD peak suggests, given a idealised neutral underlying trend (underlying trend is never neutral!), a trough of the 4.5 year component around October/November 2023. In reality left or right translation of that trough will happen and will, in turn, betray the status of longer components still, most notably the 9 year nominal wave.
Phasing Analysis
Sentient Trader
Utilising a pattern recognition algorithm and Hurst’s diamond notation


Time Frequency Analysis
Wavelet convolution targeting 20 week and 40 day nominal components


Trading Strategy
Interaction Status
Interactions and price in the FLD Trading Strategy (Advanced). This looks at an idealised 40 week cycle and an array of 3 FLD signal cycles. We apply the instrument’s phasing to the model and arrive at an overall summary for the interactions with the 20 day FLD, current and forthcoming.
Sigma-L recommendation: Risk Sell
Entry: 20 Day FLD
Stop: Above formed 80 day nominal peak
Target: 3800
Reference 20 Day FLD Interaction: F
Underlying 40 Day FLD Status: D
Underlying 80 Day FLD Status: B
Assuming now that the 18 month component trough has formed 13th October, we have a peak of the first 80 day component (@ ~ 58 days in ST) to consider.
Price action in the S&P 500 has been significantly weaker than the DJIA and European indices so we may see some deeper downside movement. The 80 day FLD support is down around 3800 and is a reasonable price target at this early point of the 18 month component, regardless of the underlying (bearish) long term phasing.
The trough of the 80 day component is expected early-mid December.
FLD Settings
If you do not have the use of Sentient Trader use these settings to plot common FLDs in your trading software (daily scale) to more easily follow trading signals and strategy from Sigma-L.
Make sure to account for non-trading days if your broker omits them in the data feed (weekends, for example). The below offsets are given with no added calculation for non-trading days.
80 day nominal: 57.8 days | 29 day FLD offset
40 day nominal: 29.4 days | 15 day FLD offset
20 day nominal: 14.5 days | 7 day FLD offset
10 day nominal: 7.5 days | 4 day FLD offset
Correlated Exposure
A non exhaustive list of correlated instruments for consideration
SPDR S&P 500 ETF Trust SPY 0.00%↑
iShares Core S&P 500 ETF IVV 0.00%↑
Vanguard S&P 500 ETF VOO 0.00%↑
SPDR Portfolio S&P 500 ETF SPLG 0.00%↑
Direxion Daily S&P 500 Bull 3X Shares SPXL 0.00%↑
Direxion Daily S&P 500 Bear 3X Shares SPXS 0.00%↑
ProShares UltraPro Short S&P500 SPXU 0.00%↑
ProShares UltraPro S&P500 UPRO 0.00%↑


