

S&P 500: Hurst Cycles - 13th December 2022
Stock markets fall into the 80 day nominal low in varied fashion. The excellent 20 week nominal component has potentially peaked too, we look at the evidence in this report on the S&P 500.

Tools required: Nominal Model | FLD | FLD Trading Strategy | FLD Trading Strategy (Advanced) | Principle of Nominality | Underlying Trend
Analysis Summary
The S&P 500 has made a sideways, turgid trough for the first 80 day component low of what is highly likely now the first move in an 18 month component that bottomed in October this year. Price is currently finding some support around the 80 day FLD (short term chart below), a typical interaction at this stage of the 40 week component (see trading strategy below).
At the long term the 18 month component, if it indeed did form in October, is running at around 15.4 months average wavelength over the period. This sets up the larger low, assumed to be the 4.5 year component, at the end of 2023 and into early 2024. That period, if the phasing is accurate, is likely to be tumultuous.
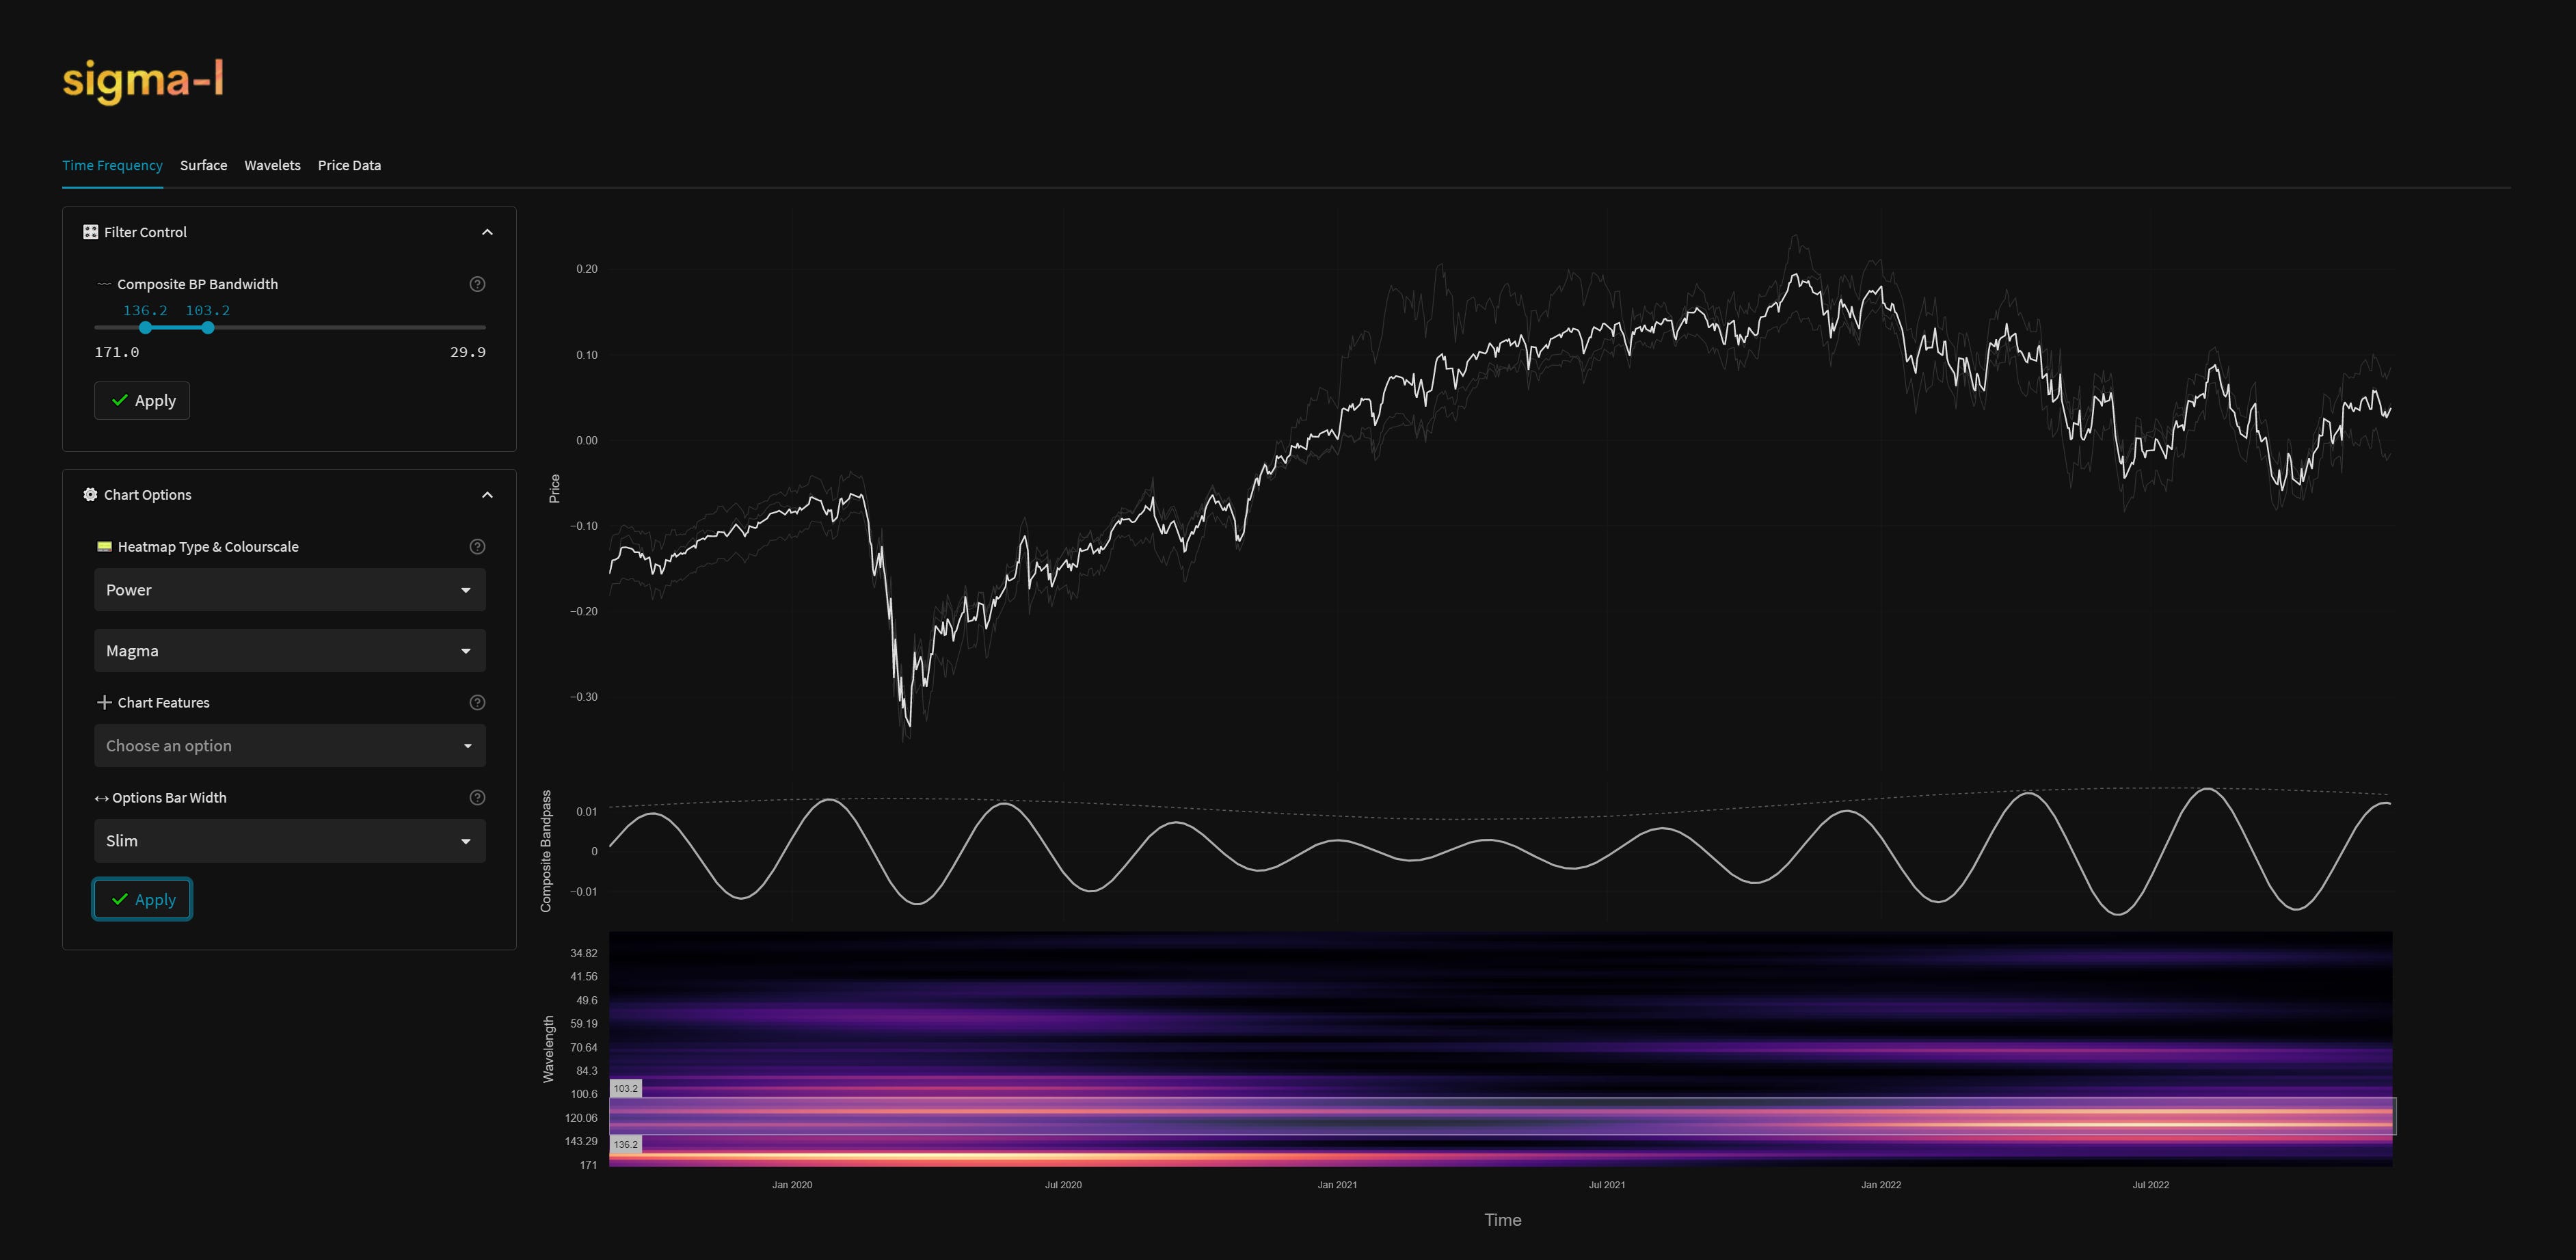
There has been general support around the 4.5 year FLD (orange on long term chart) for the most recent 18 month nominal low and this sets up a cross of that FLD for the downside target in due course. The medium term components (20 and 40 week) will now dictate the position of the cross and indeed the 20 week component is the one to watch into the new year for signs of continued bearish underlying trend. A move to test the lows around 3600-3700 is an ominous sign. Indeed the time frequency analysis below suggests a peak of the 20 week component has already occurred (calculated on average wavelength + average frequency modulation over the period). The move from this proposed 80 day nominal low may therefore be weak and generally sideways in nature.
Watch closely the interaction between price and the 18 month / 40 week FLDs in the coming weeks, shown on the Sentient Trader charts below. Price may well generally track or straddle the 40 week FLD on the down leg of the current 20 week component.

Phasing Analysis
Sentient Trader
Utilising a pattern recognition algorithm and Hurst’s diamond notation


Time Frequency Analysis
Wavelet convolution targeting the 20 week nominal component


Trading Strategy
Interaction Status
Interactions and price in the FLD Trading Strategy (Advanced). This looks at an idealised 40 week cycle and an array of 3 FLD signal cycles. We apply the instrument’s phasing to the model and arrive at an overall summary for the interactions with the 20 day FLD, current and forthcoming.

Sigma-L recommendation: Risk Buy
Entry: 20 Day FLD
Stop: Below formed 80 day nominal low
Target: 4150 (18 month FLD resistance)
Reference 20 Day FLD Interaction: A2
Underlying 40 Day FLD Status: E
Underlying 80 Day FLD Status: B-C
Support as it stands is coming from the 80 day FLD (short term chart) in a typical fashion for the first 80 day component low in a 40 week cycle. The 20 week nominal peak will likely form in this first 40 day component and there is likely to be strong resistance at the 18 month FLD as we head into the new year.
The move to the 20 week nominal low, expected early February, will likely be the one to watch and a potential early short in this 18 month component.
FLD Settings
If you do not have the use of Sentient Trader use these settings to plot common FLDs in your trading software (daily scale) to more easily follow trading signals and strategy from Sigma-L.
Make sure to account for non-trading days if your broker omits them in the data feed (weekends, for example). The below offsets are given with no added calculation for non-trading days.
80 day nominal: 57.8 days | 29 day FLD offset
40 day nominal: 28.7 days | 14 day FLD offset
20 day nominal: 14.4 days | 7 day FLD offset
10 day nominal: 7.4 days | 4 day FLD offset
Correlated Exposure
A non exhaustive list of correlated instruments for consideration
SPDR S&P 500 ETF Trust SPY 0.00%↑
iShares Core S&P 500 ETF IVV 0.00%↑
Vanguard S&P 500 ETF VOO 0.00%↑
SPDR Portfolio S&P 500 ETF SPLG 0.00%↑
Direxion Daily S&P 500 Bull 3X Shares SPXL 0.00%↑
Direxion Daily S&P 500 Bear 3X Shares SPXS 0.00%↑
ProShares UltraPro Short S&P500 SPXU 0.00%↑
ProShares UltraPro S&P500 UPRO 0.00%↑
This analysis is rather bearish relative to the FLD/price interaction one would expect when moving out of an 18 month trough. From what I understand of Hurst phasing, this bearishness would normally be the catalyst to re-evaluate the phasing of the 18M trough in October.
I note that you're not re-evaluating the phasing. Is that because the time frequency analysis still supports the placement of the 18M trough in October or is there something I'm missing?