

Under Development: Sigma-MT Cycle Scanner
A powerful new companion tool that scans your entire market watch for dominant cycles across multiple timeframes - instantly identifying the strongest cyclical opportunities.

Alongside the main Sigma-MT EA, I’ve been developing something I’m very excited about: a dedicated market-wide cycle scanner. While Sigma-MT lets you dive deep into the time-frequency structure of individual instruments, the scanner answers a different question entirely: where should I be looking right now?
The scanner applies the same robust wavelet convolution engine that powers Sigma-MT across every instrument in your market watch, simultaneously analysing multiple timeframes and ranking results by cycle strength. In seconds, you have a prioritised list of instruments exhibiting the most statistically significant cyclical behaviour.

Under the Hood: Time-Frequency
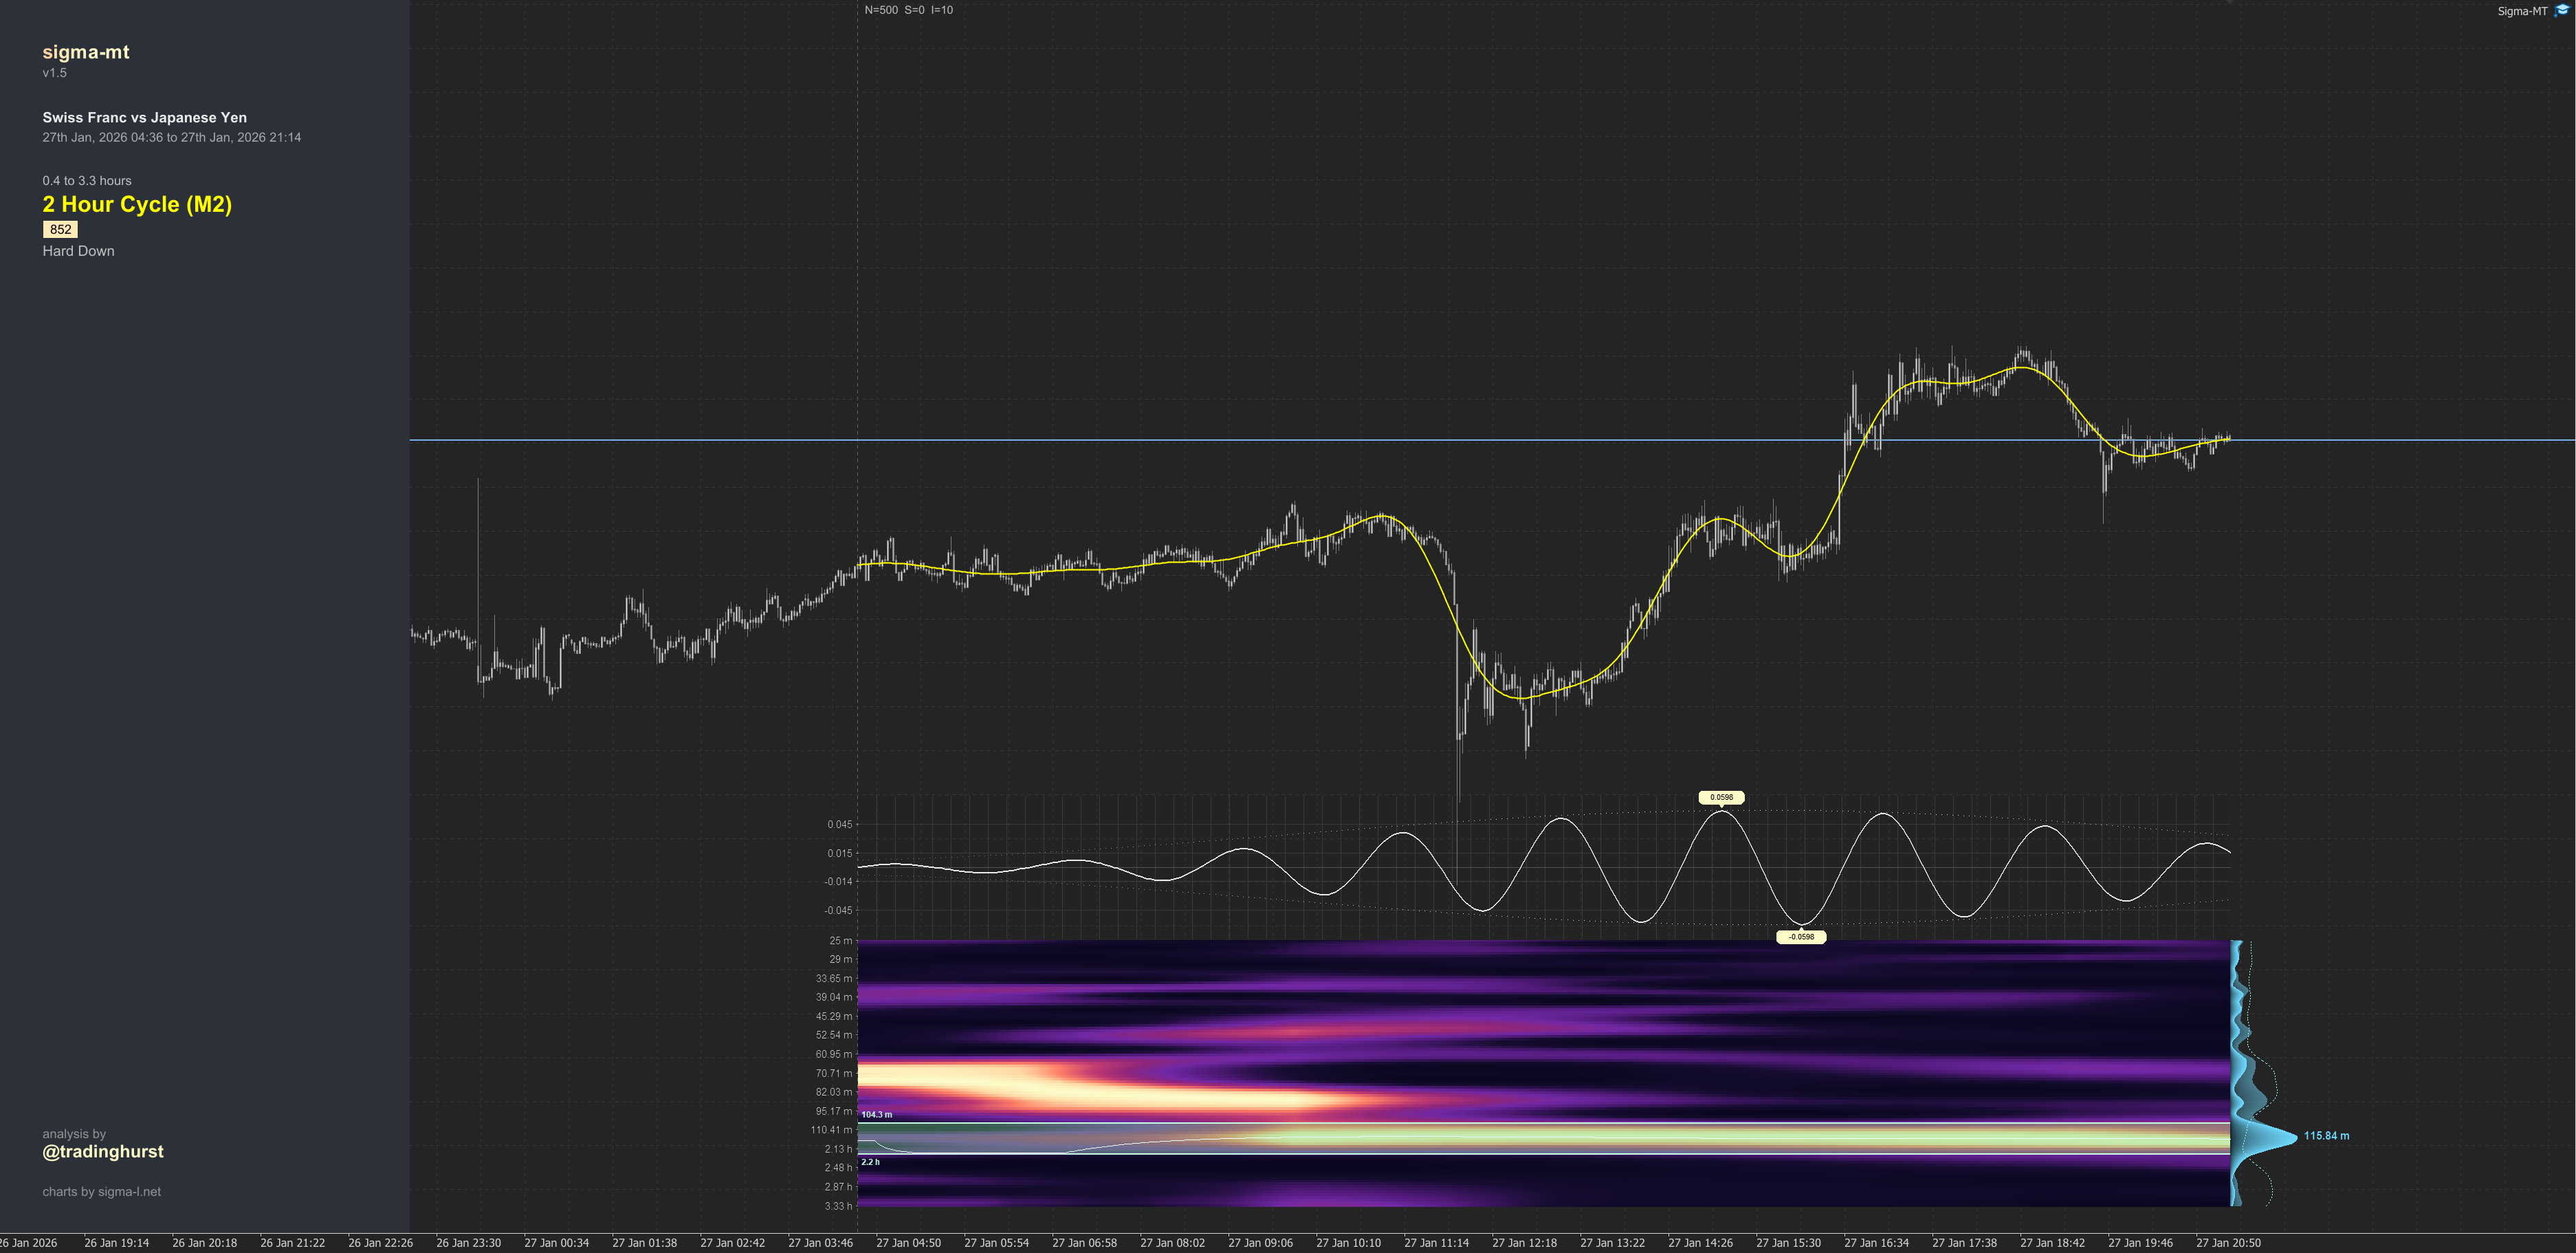
Under the hood, the scanner leverages the same frequency-domain convolution that makes Sigma-MT so fast in MT5. Each instrument undergoes a full wavelet transform, with automatic cycle detection using either a simple SNR (Signal-to-Noise Ratio) and filter or CFAR (Constant False Alarm Rate) algorithms - the same detection methods used in radar systems for picking signals out of noise.
The cycle ranking score then combines multiple factors: peak prominence above the noise floor, spectral isolation, amplitude stability, frequency consistency, and persistence across the analysis window. To be clear this isn’t just finding any cycle - it’s finding cycles that exhibit the characteristics of genuine periodic phenomena rather than random fluctuations.
A scan of several hundred instruments across multiple timeframes completes in seconds.
Intelligent Phase Grouping
This is where the scanner becomes more than just a ranking tool. When analysing multiple timeframes, the scanner can automatically identify phase confluence - instruments showing aligned cycle phases across different time horizons.
When the same symbol exhibits similar phase, these groups lock to the top of the results, immediately drawing your attention to potential multi-timeframe confluence setups.
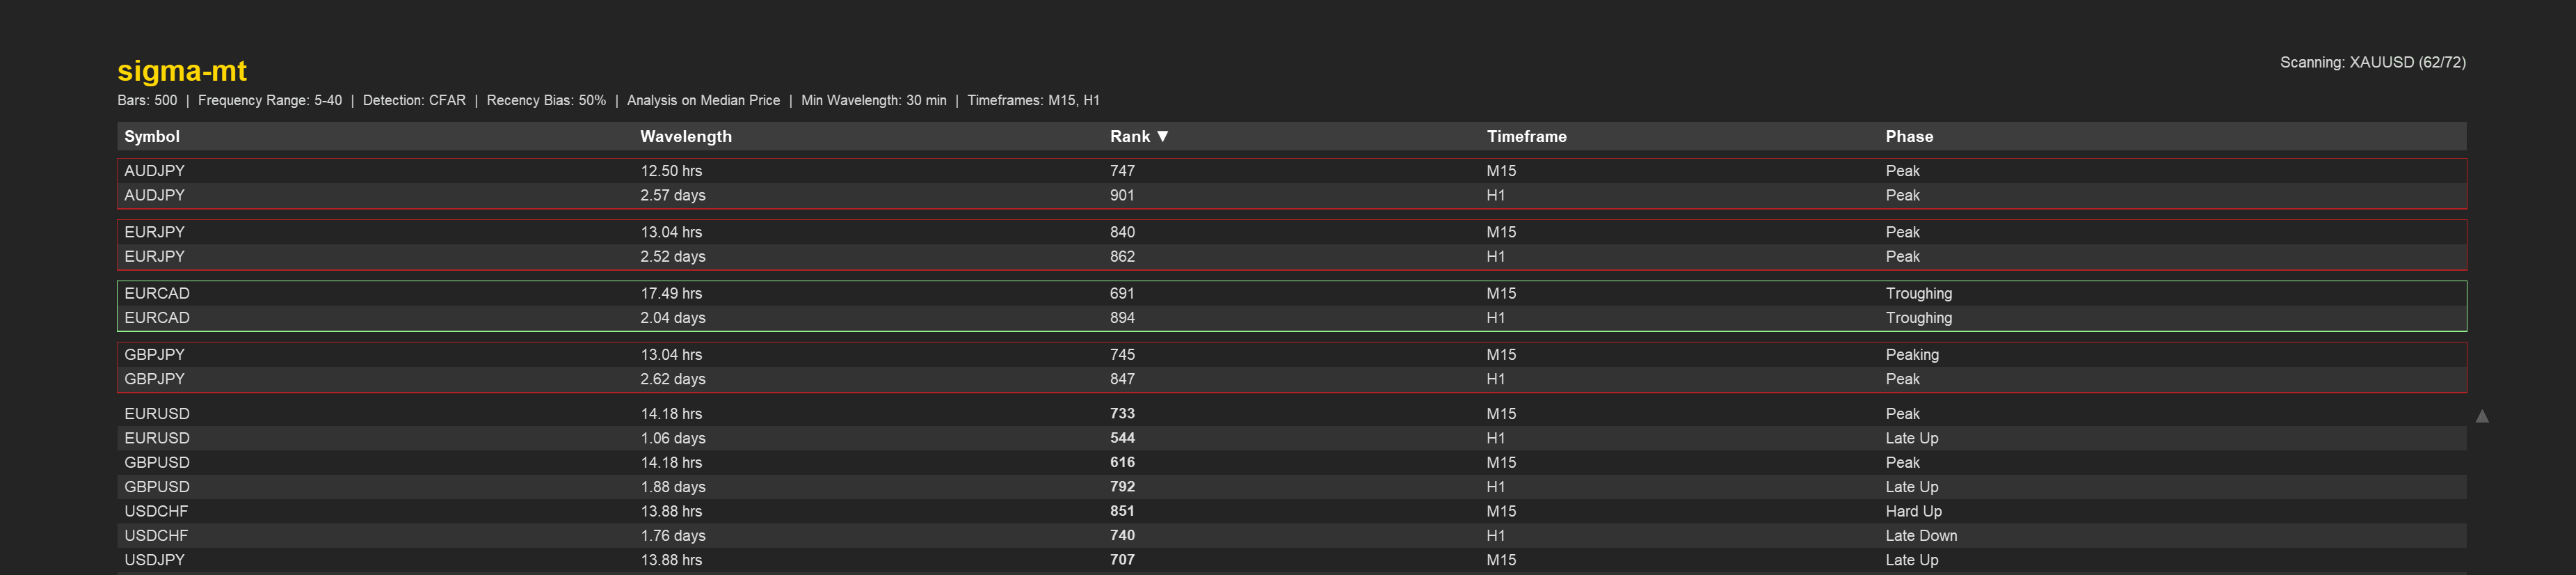
However, matching phases alone isn’t enough. To ensure meaningful alignment rather than the same cycle detected at different resolutions, the scanner validates that each higher timeframe shows a wavelength greater than at least 1.5 times the previous timeframes’ detected cycle. This filters for genuine nested cycle structures - the kind of fractal patterns that Hurst and others identified as characteristic of market behaviour.
Multi-Timeframe Analysis
The scanner has capacity for up to five timeframes running at simultaneous analysis. The scanner will evaluate every market watch instrument against each timeframe, giving you a comprehensive view of cyclical activity from intraday through to longer-term structures, if required.
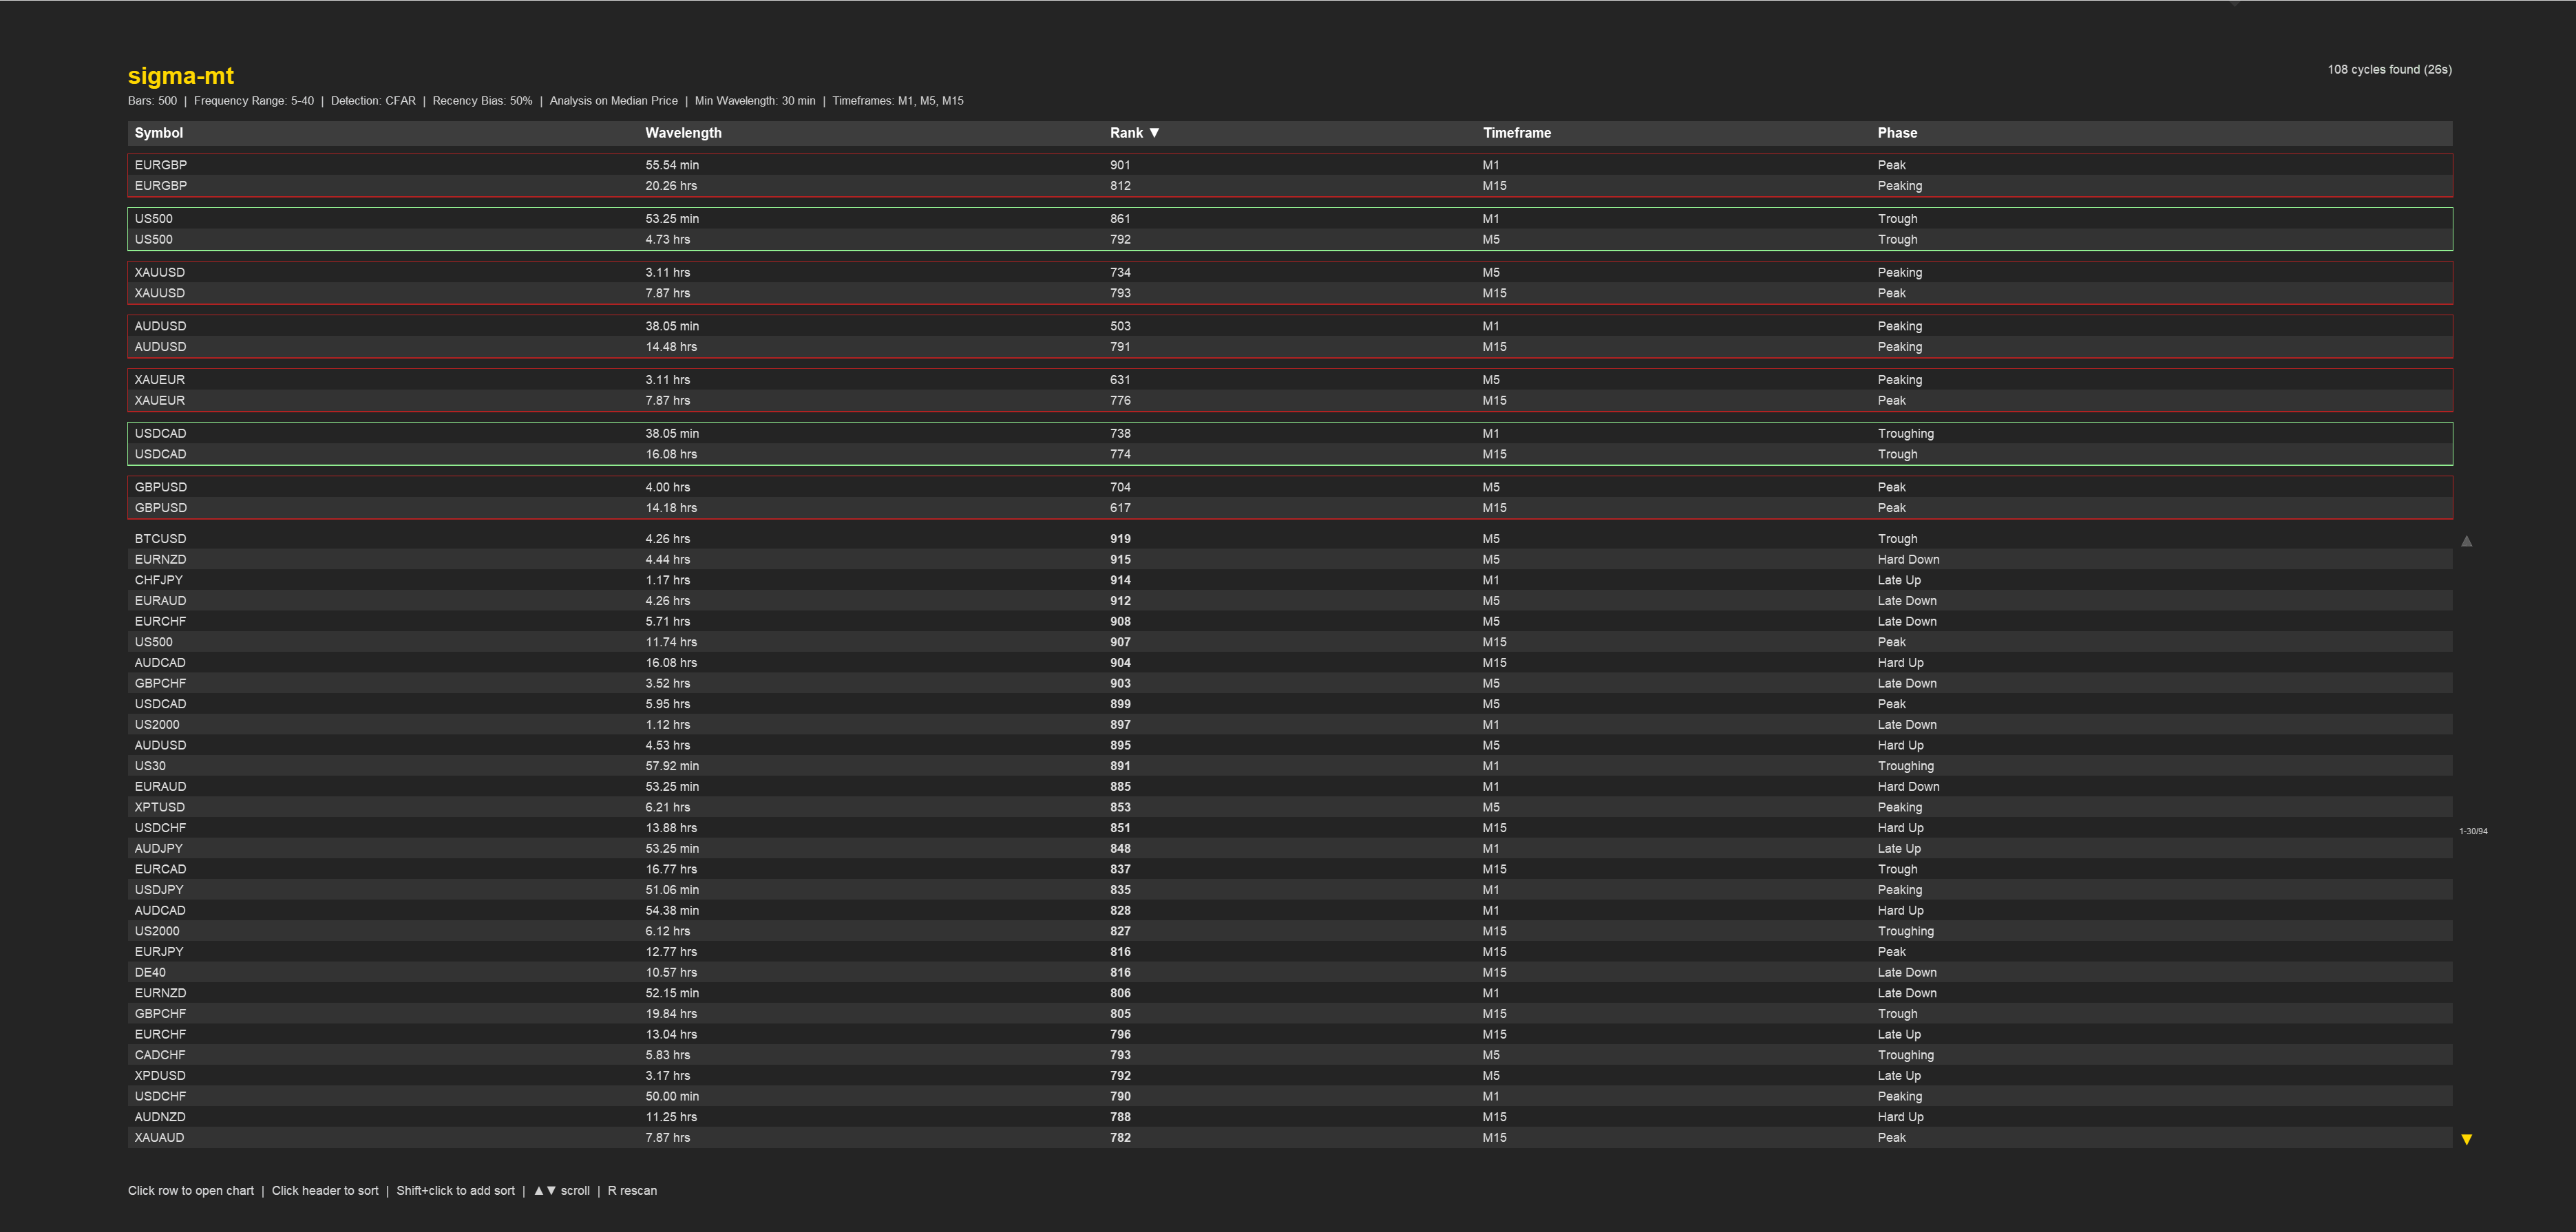
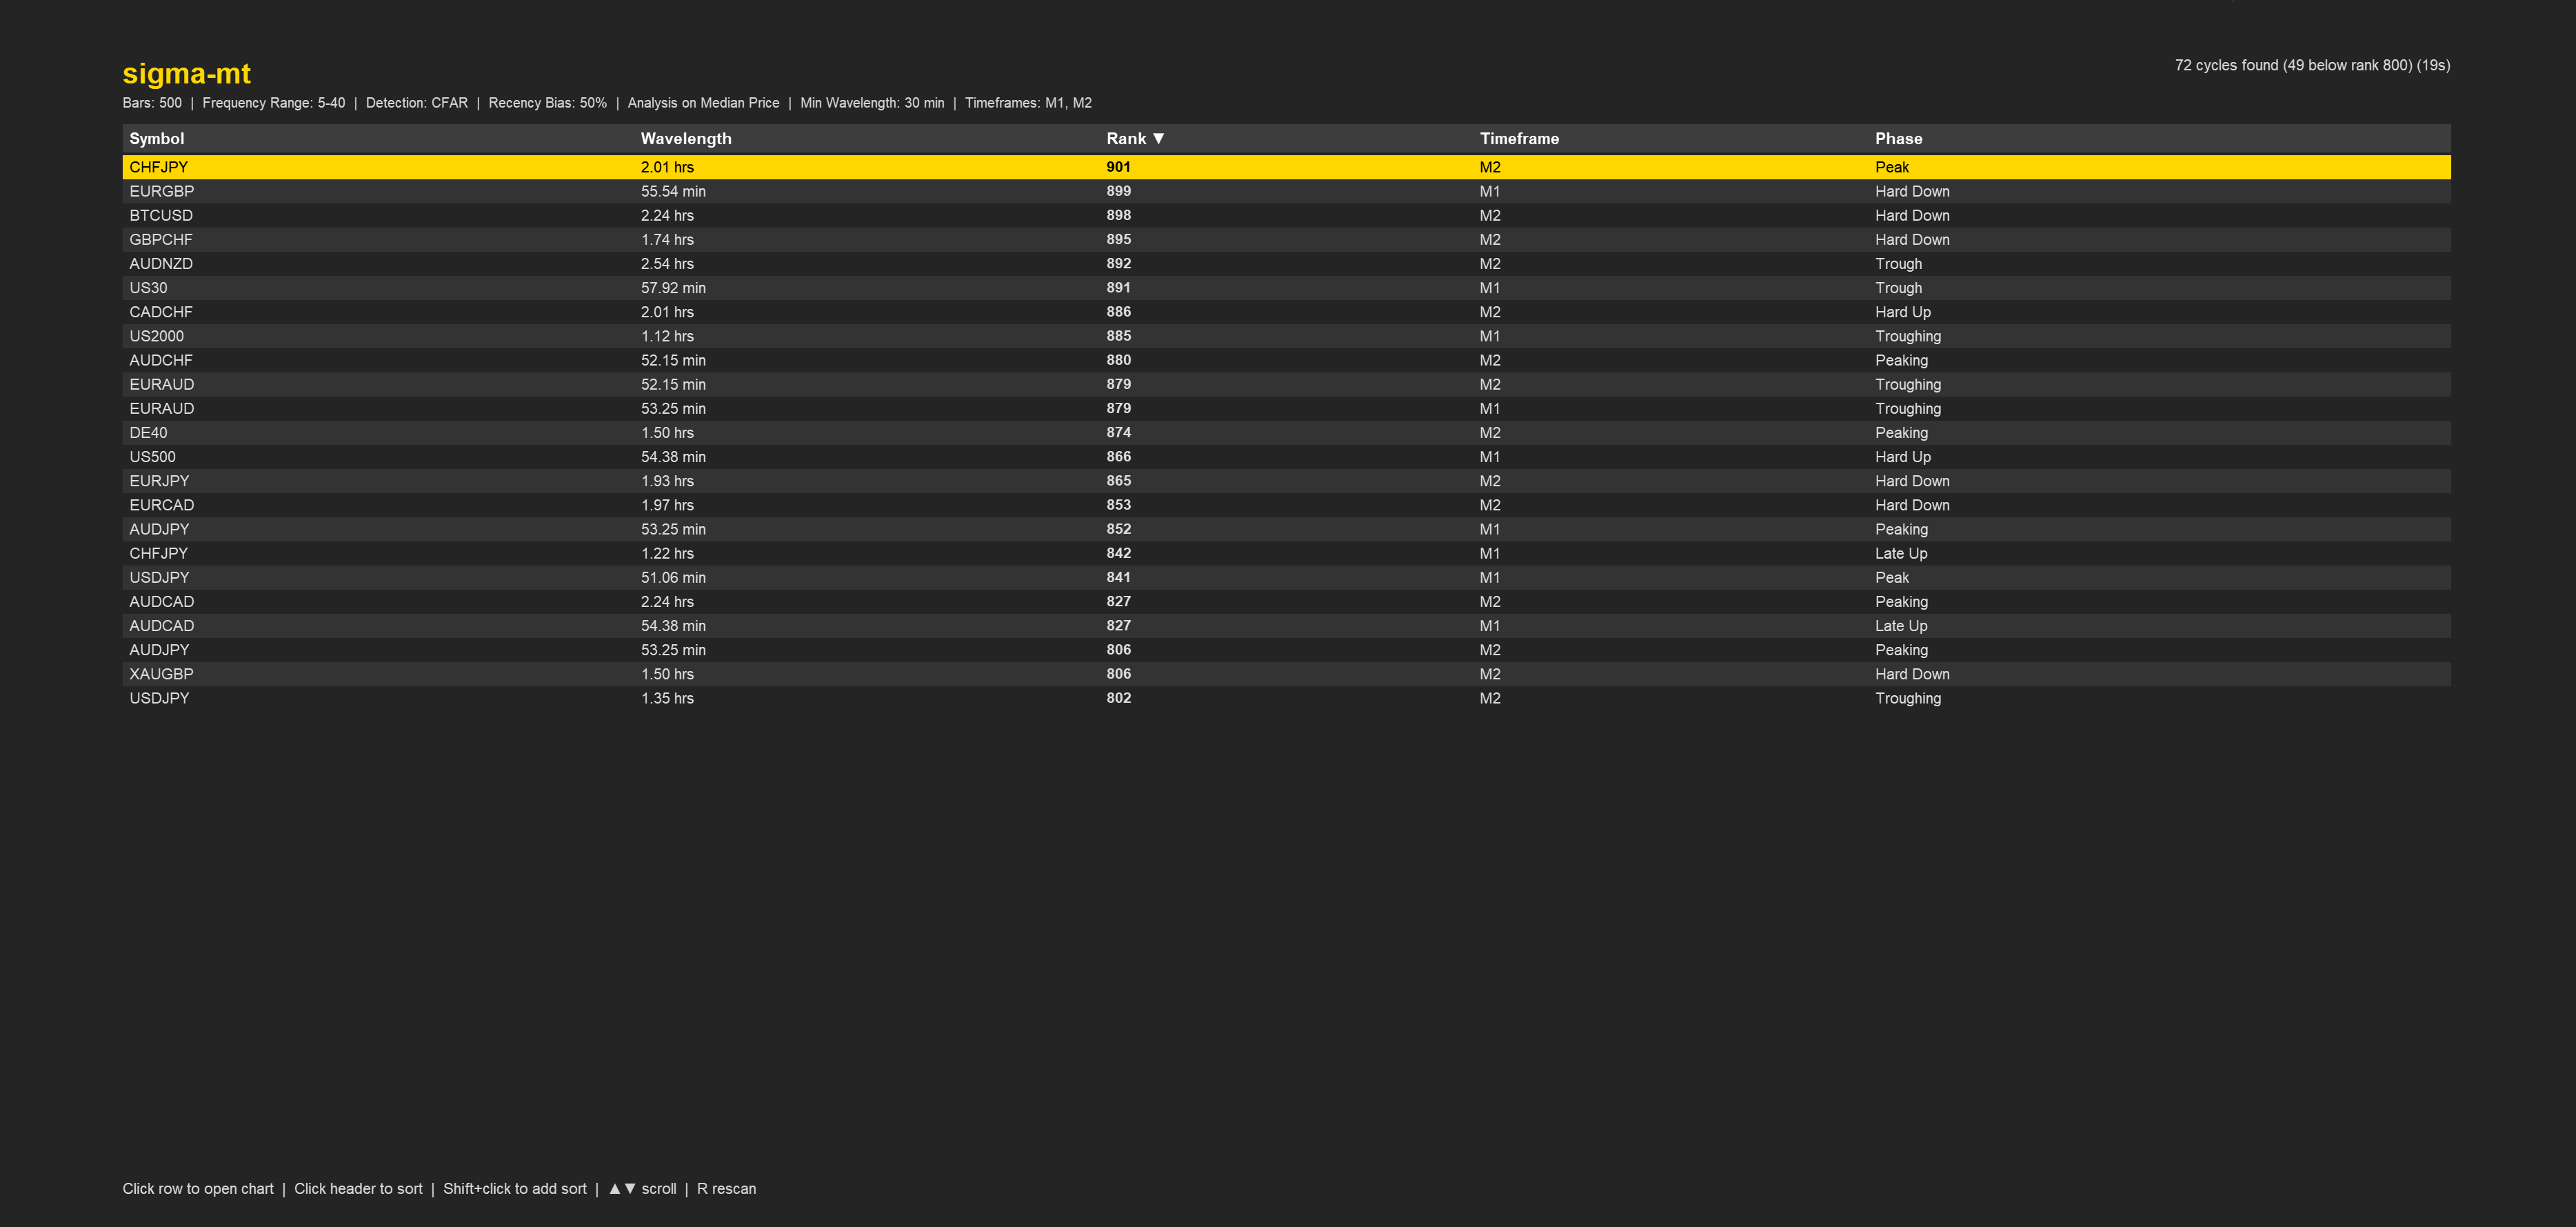
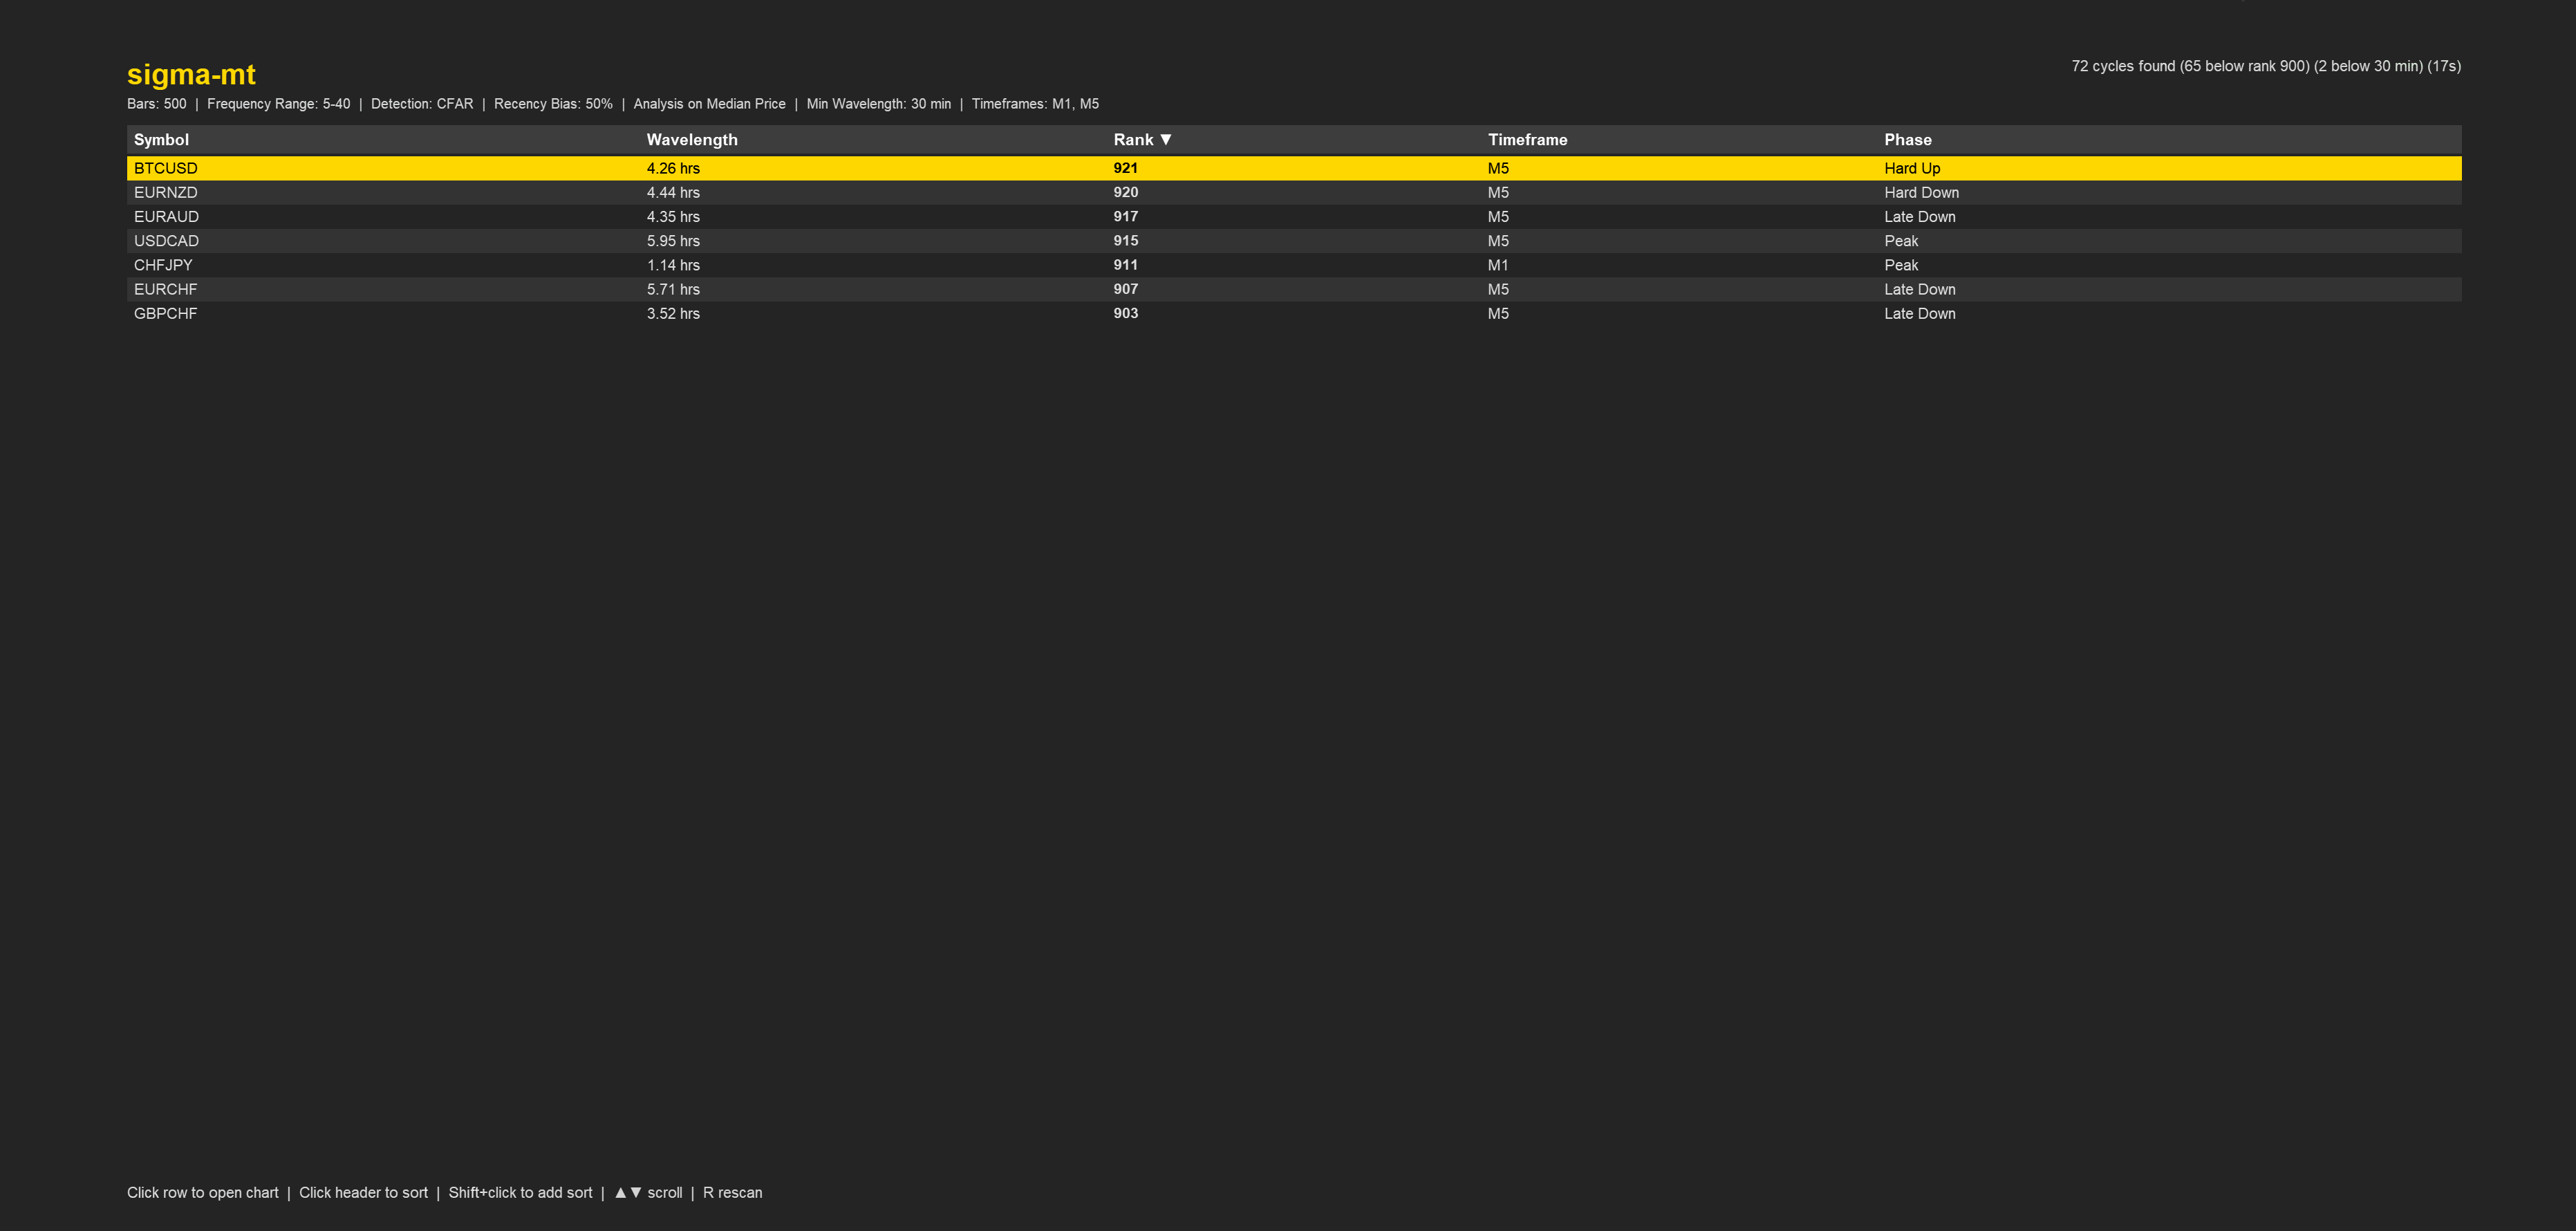
Results display the detected wavelength (automatically formatted in minutes, hours, days, or weeks), the cycle rank score, timeframe, and current phase status. Click any row to instantly open a chart with that symbol and timeframe - ready for deeper analysis with the main Sigma-MT EA.
Filtering & Configuration
Focus your attention with built-in filtering (more features to come):
Minimum Rank Threshold - Hide weak cycles below a specified score
Minimum Wavelength - Filter out very short cycles that may represent noise rather than tradeable features
Recency Bias - Weight the analysis toward recent price action
All active parameters display clearly at the top of the interface, so you always know exactly what you’re looking at:
Bars: 500 | Frequency Range: 5-40 | Detection: CFAR | Recency Bias: 50% | Analysis on Median Price | Min Wavelength: 30 min | Timeframes: M1, M15, H1
The Workflow
The scanner and Sigma-MT EA are designed to work together although one can use the scanner standalone if you have a system already setup to identify periodicities in markets.
Scan - Run the Scanner to identify instruments with strong cyclical behaviour. Set the scan to loop continuously after completion, manually by pressing ‘R’ or at set intervals.
Filter - Use phase grouping and rank thresholds to surface the most interesting opportunities
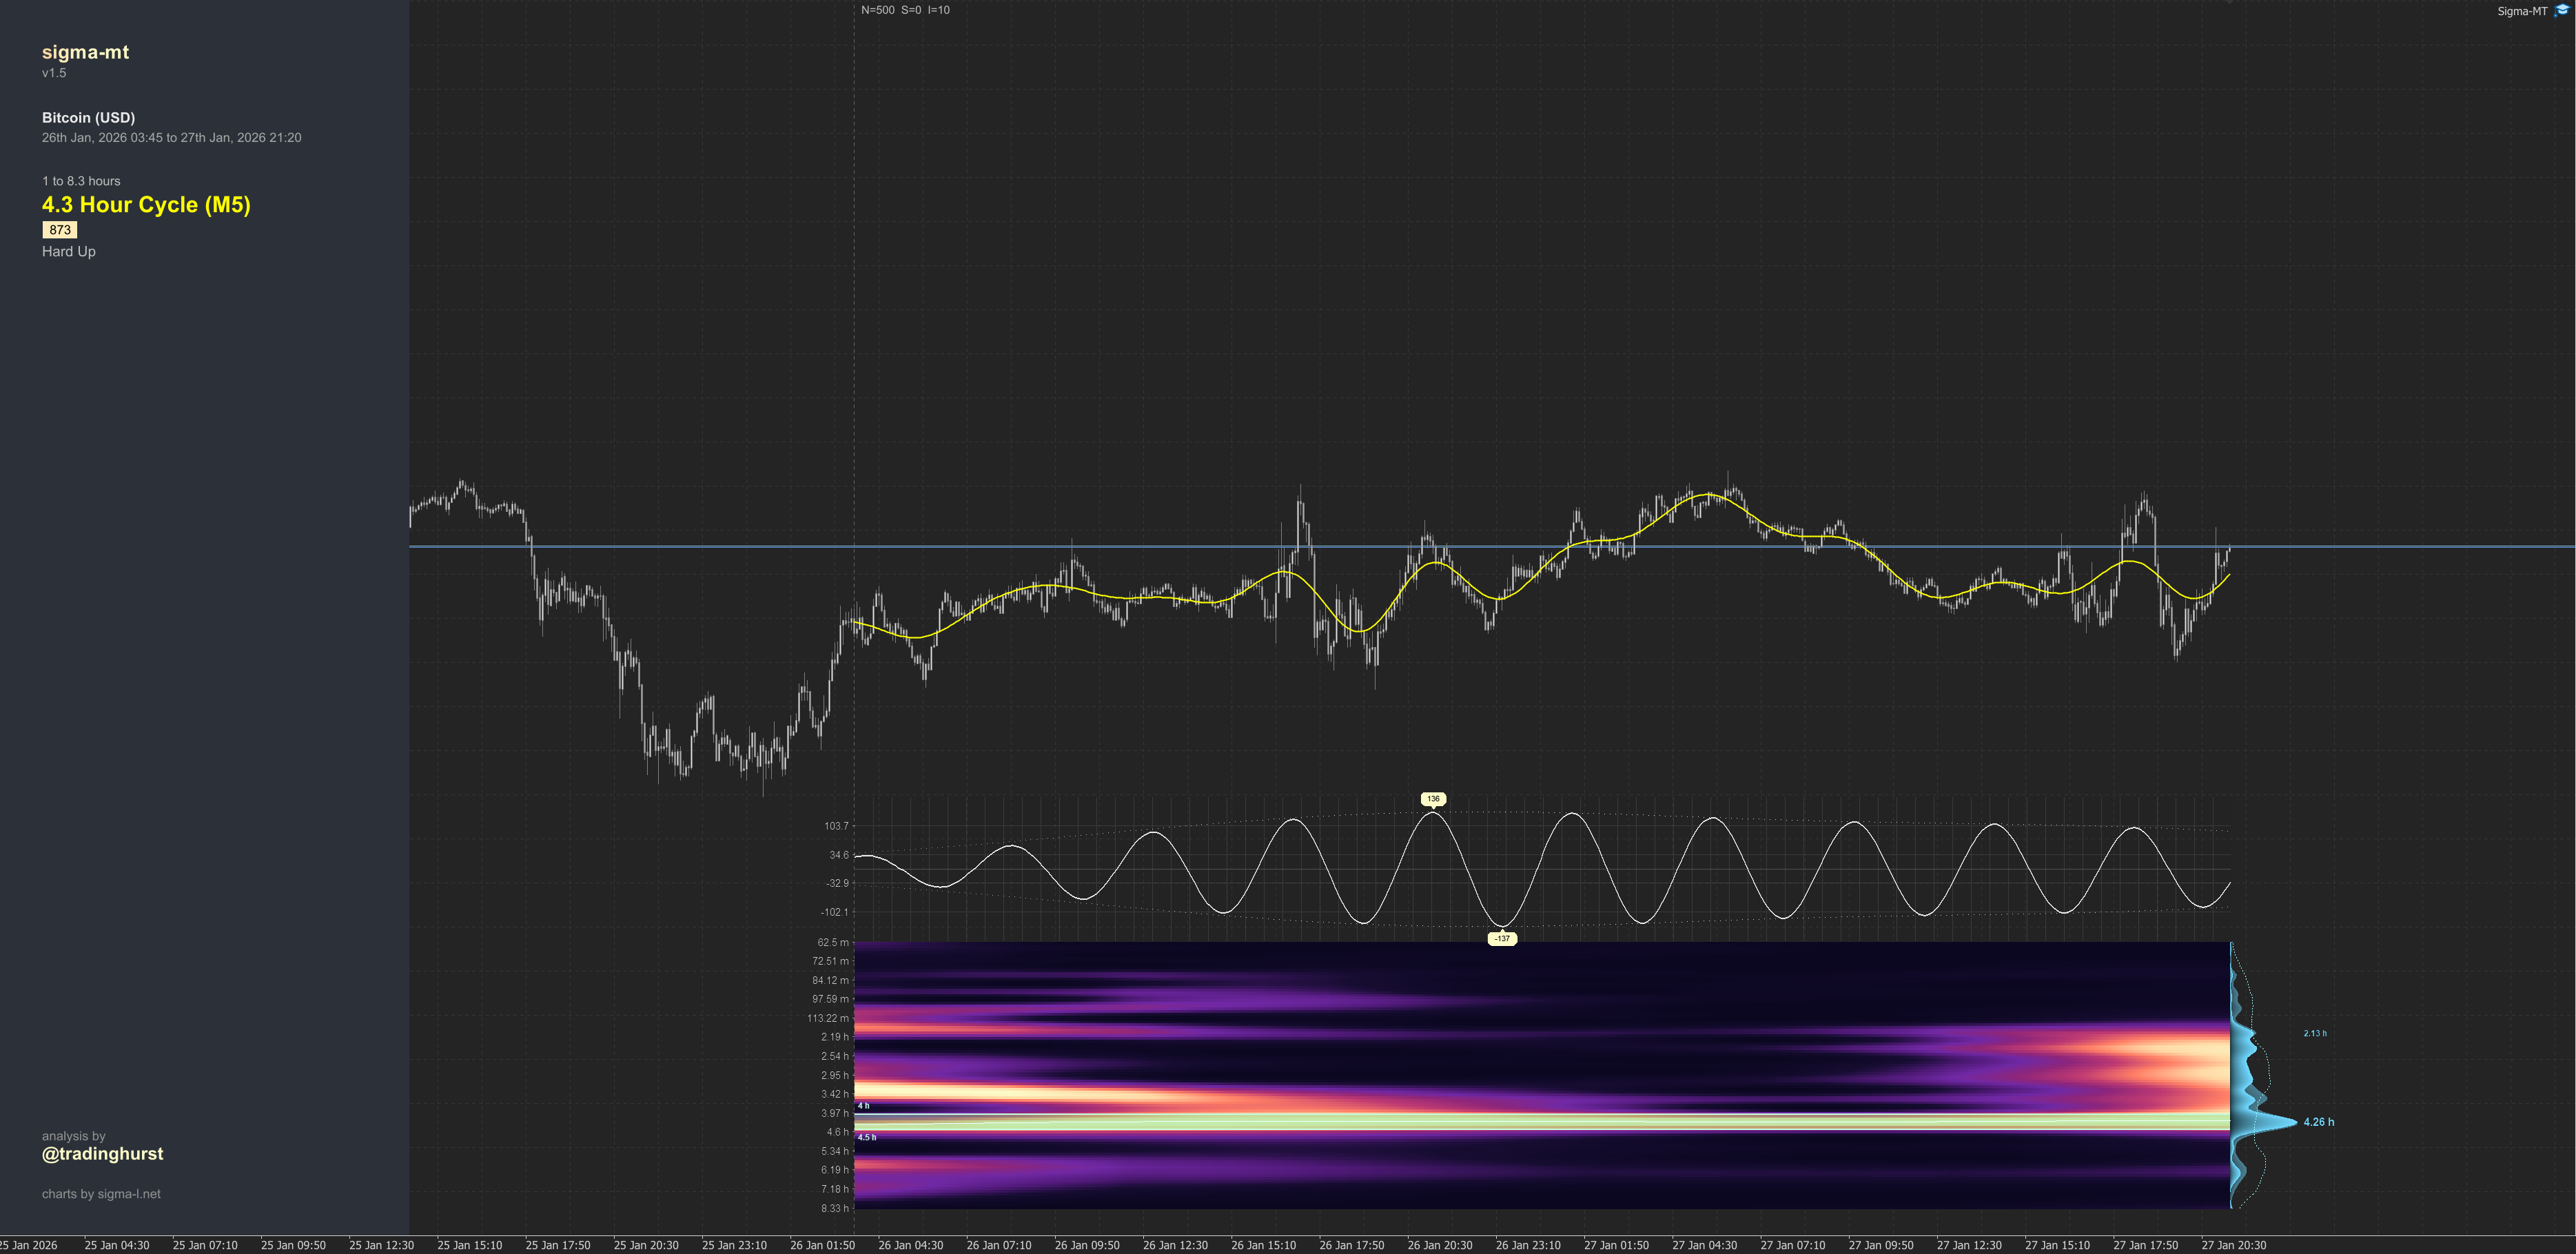
Click - Open a chart directly from the scanner results
Analyse - Apply Sigma-MT for detailed time-frequency analysis, phase projection, extrapolation and cycle visualisation. Automatic trading will also be in place further along the development process.
This workflow transforms cycle analysis from a manual, instrument-by-instrument process into a systematic scan of the entire market.
The scanner is currently in development alongside the main Sigma-MT EA and will be available to new founding members on Sigma-L in addition to being directly available on the MQL store. I believe this combination of tools - broad market scanning paired with deep individual analysis - represents something genuinely new for retail cycle analysts. I am excited to finally be able to share the insight I have been using for the past few years with others.
More updates to follow as development progresses. Thank you for your continued support.
David