

Sigma-MT: Development Update - February 2026
From alpha to beta — extrapolation, trade zones, yield analysis, composite instruments, and a dramatically expanded interface. Read about the latest developments for our MT5 app

Since the January update, Sigma-MT has moved from alpha to beta. This has been a significant step, adding several major analytical features on top of the time-frequency engine while reworking the interface to support a much more interactive workflow. Here's an overview of what's new.
Extrapolation
One of the most requested and often well discussed features is now live. Sigma-MT uses a sinusoidal tuned Kalman filter to decompose the bandpass-filtered cycle into trend and oscillatory components, then projects forward. The extrapolation respects the detected wavelength and current phase, producing a natural continuation rather than a naive repetition. A short cross-fade at the boundary prevents discontinuities where historical data meets the forecast.
Each enabled timeframe — short, medium, and long-term — extrapolates independently, with the projection length configurable in terms of forward cycles.
Inflection Points and Uncertainty
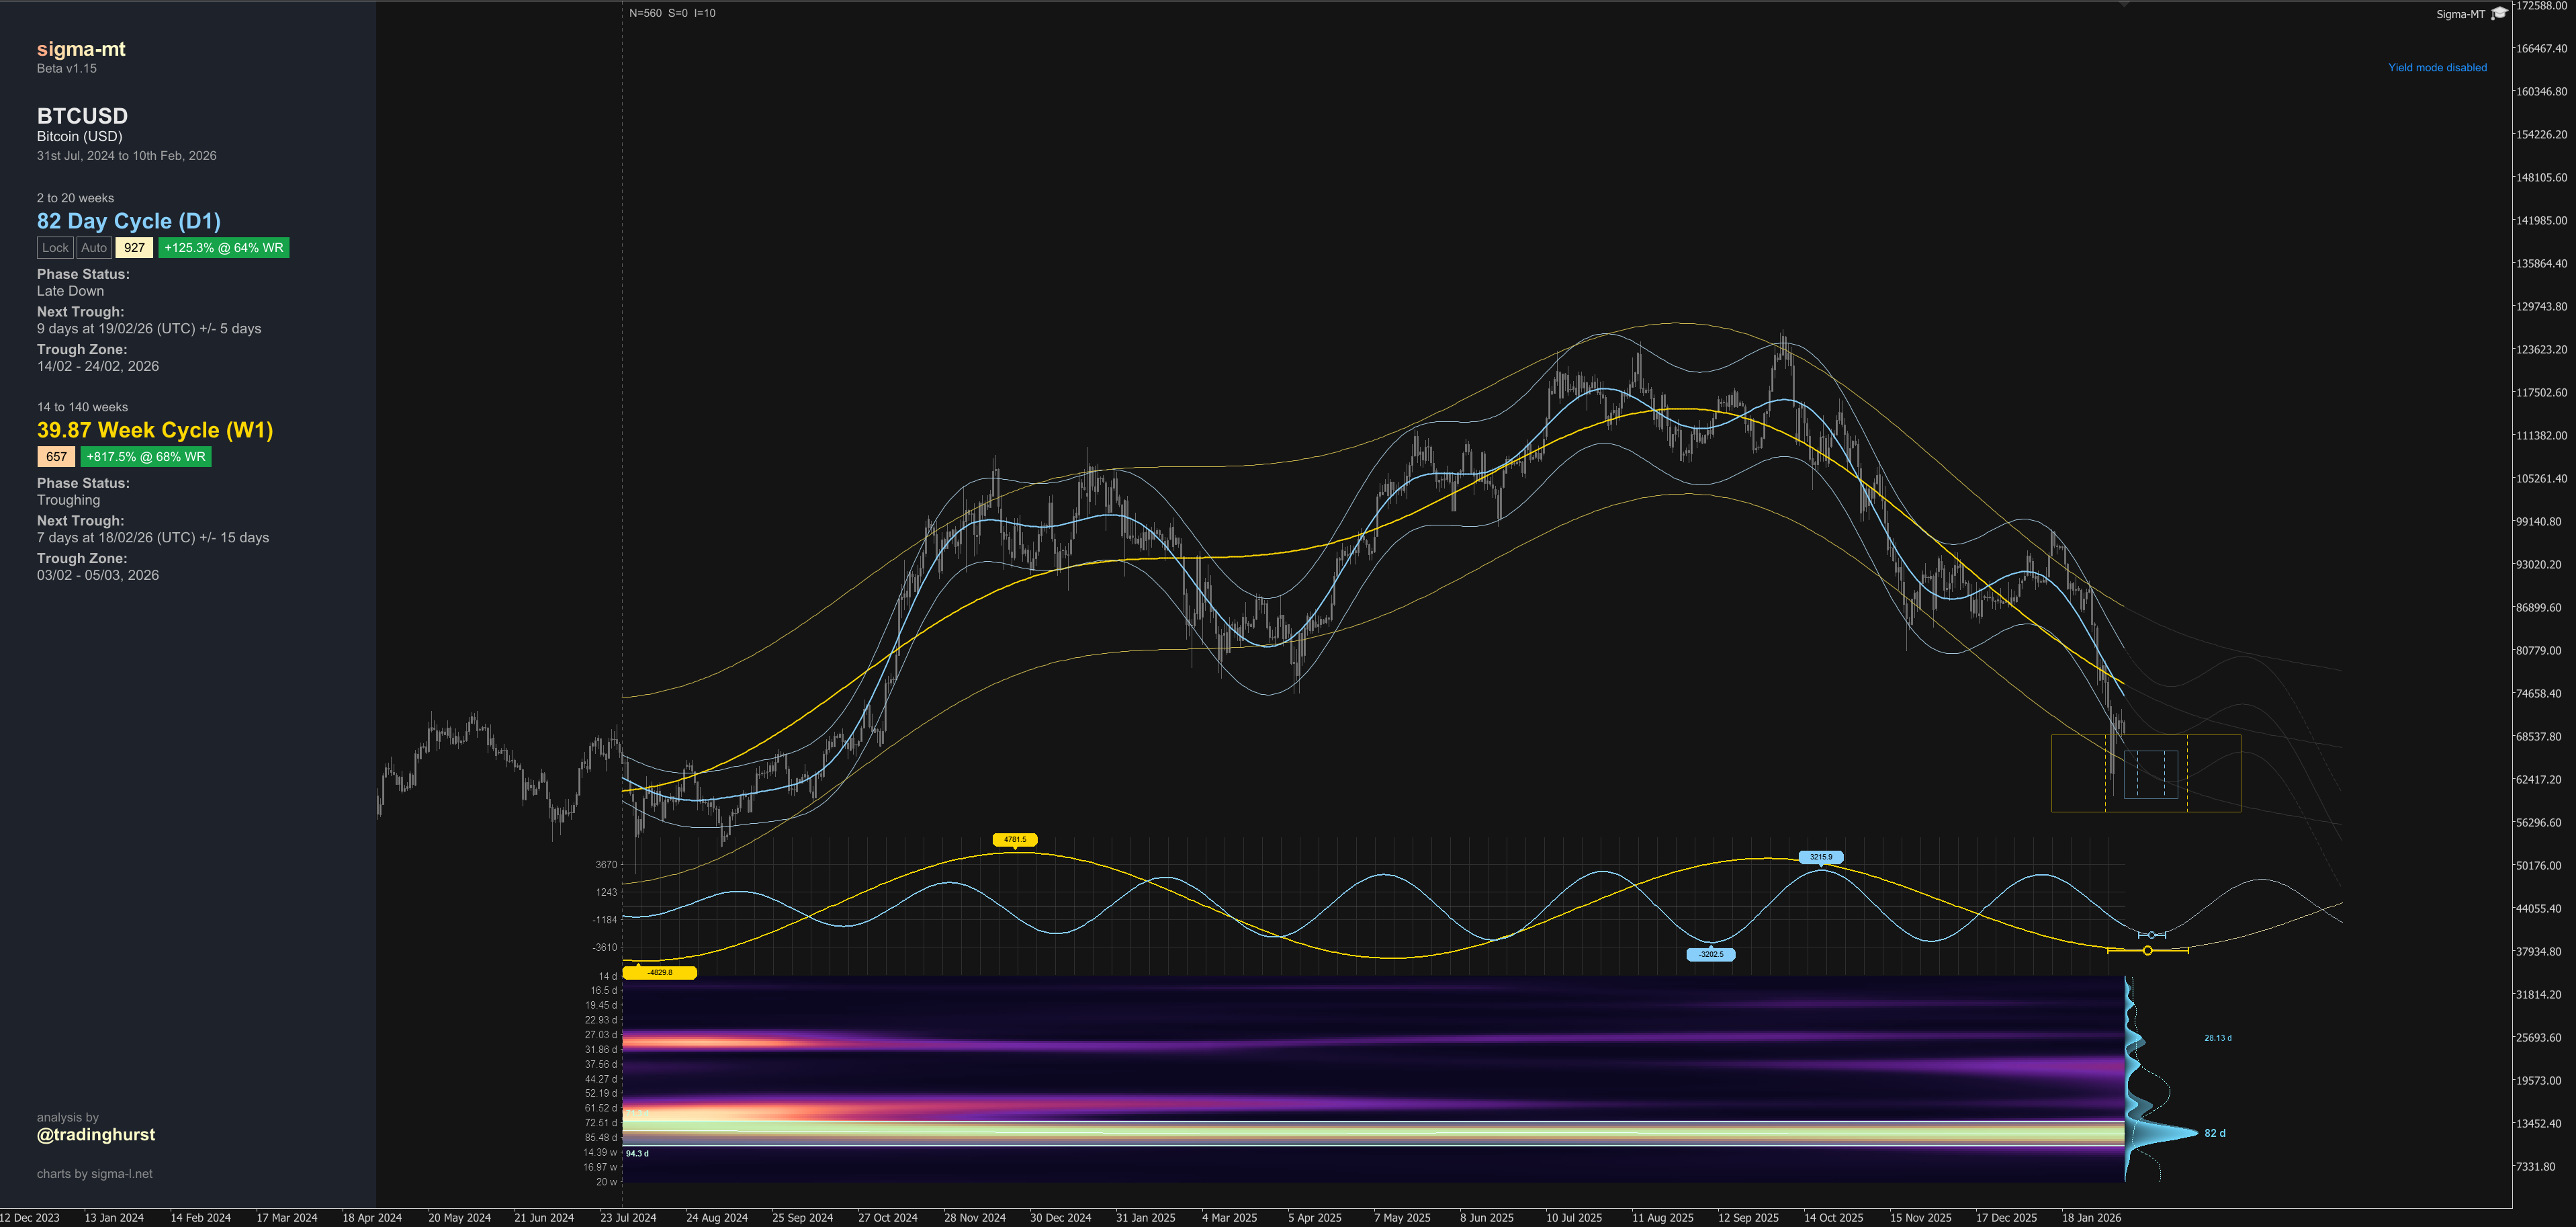
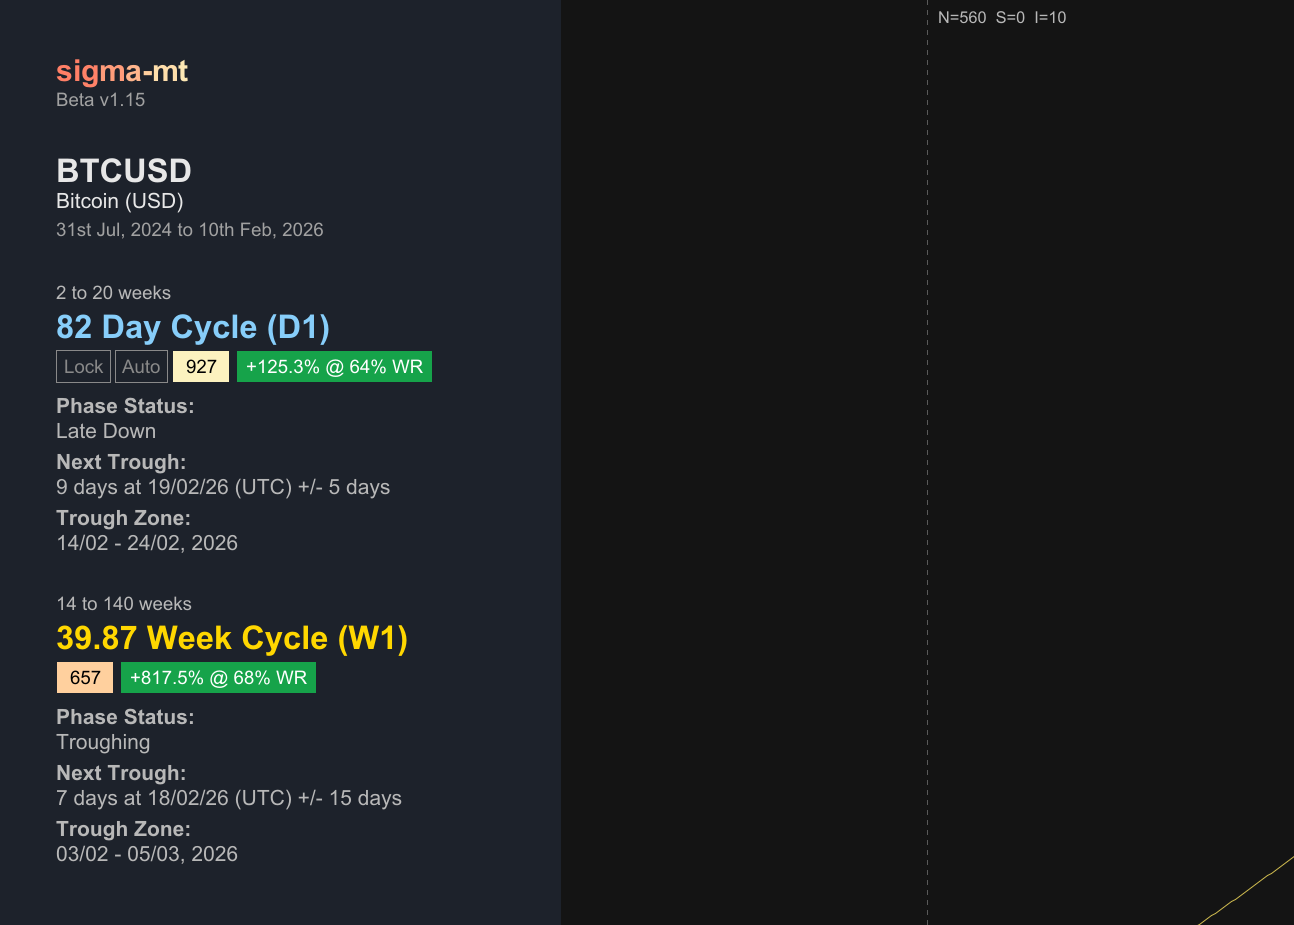
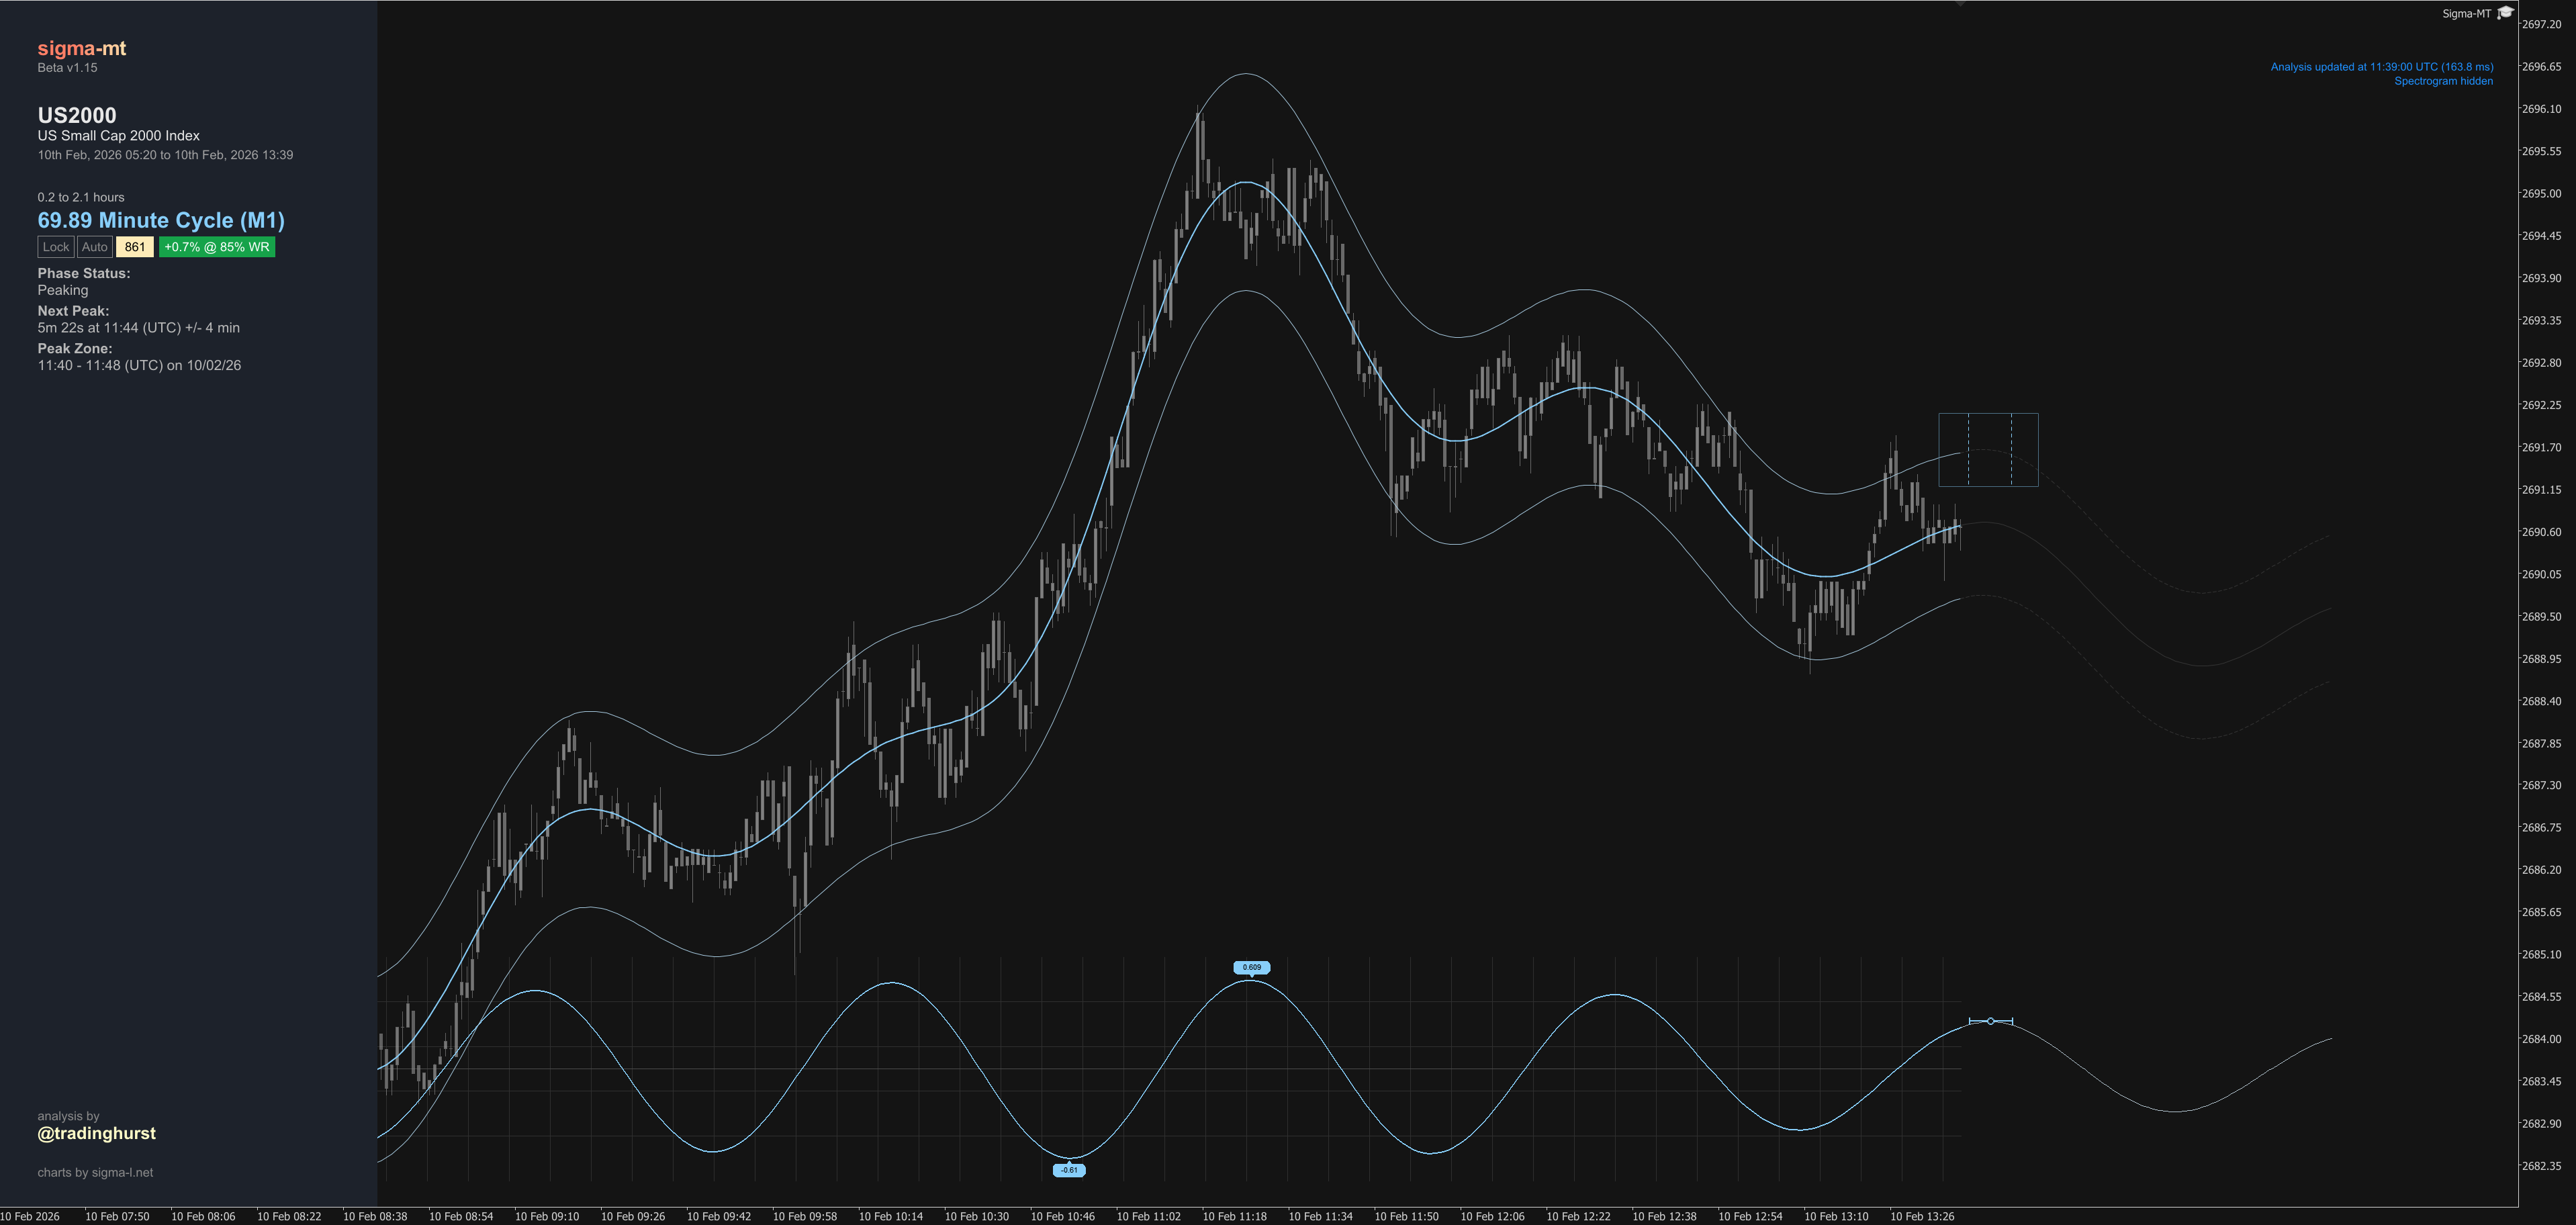
Building on extrapolation, the system identifies upcoming inflection points — peaks and troughs in the projected cycle — and marks them on the chart with estimated timing. The information panel displays a countdown to the next expected inflection alongside phase status.
Since any projection carries uncertainty, the inflection markers include a time window rather than a single bar, giving a realistic range for when the turn is expected. UTC and broker time display are both supported.
Envelopes
Amplitude envelopes now wrap each cycle component, calibrated so that approximately 95% of price action falls within the bands. The envelope width is driven by the instantaneous magnitude from the wavelet transform rather than a fixed offset, so the bands widen and narrow as cycle strength fluctuates. These extend through the extrapolation region, providing a projected price range alongside the cycle forecast. This concept, first espoused by JM Hurst in ‘Profit Magic for Stock Transaction Timing’, is a useful way to visualise the volatility in an instrument defined by the cycle feature driving it
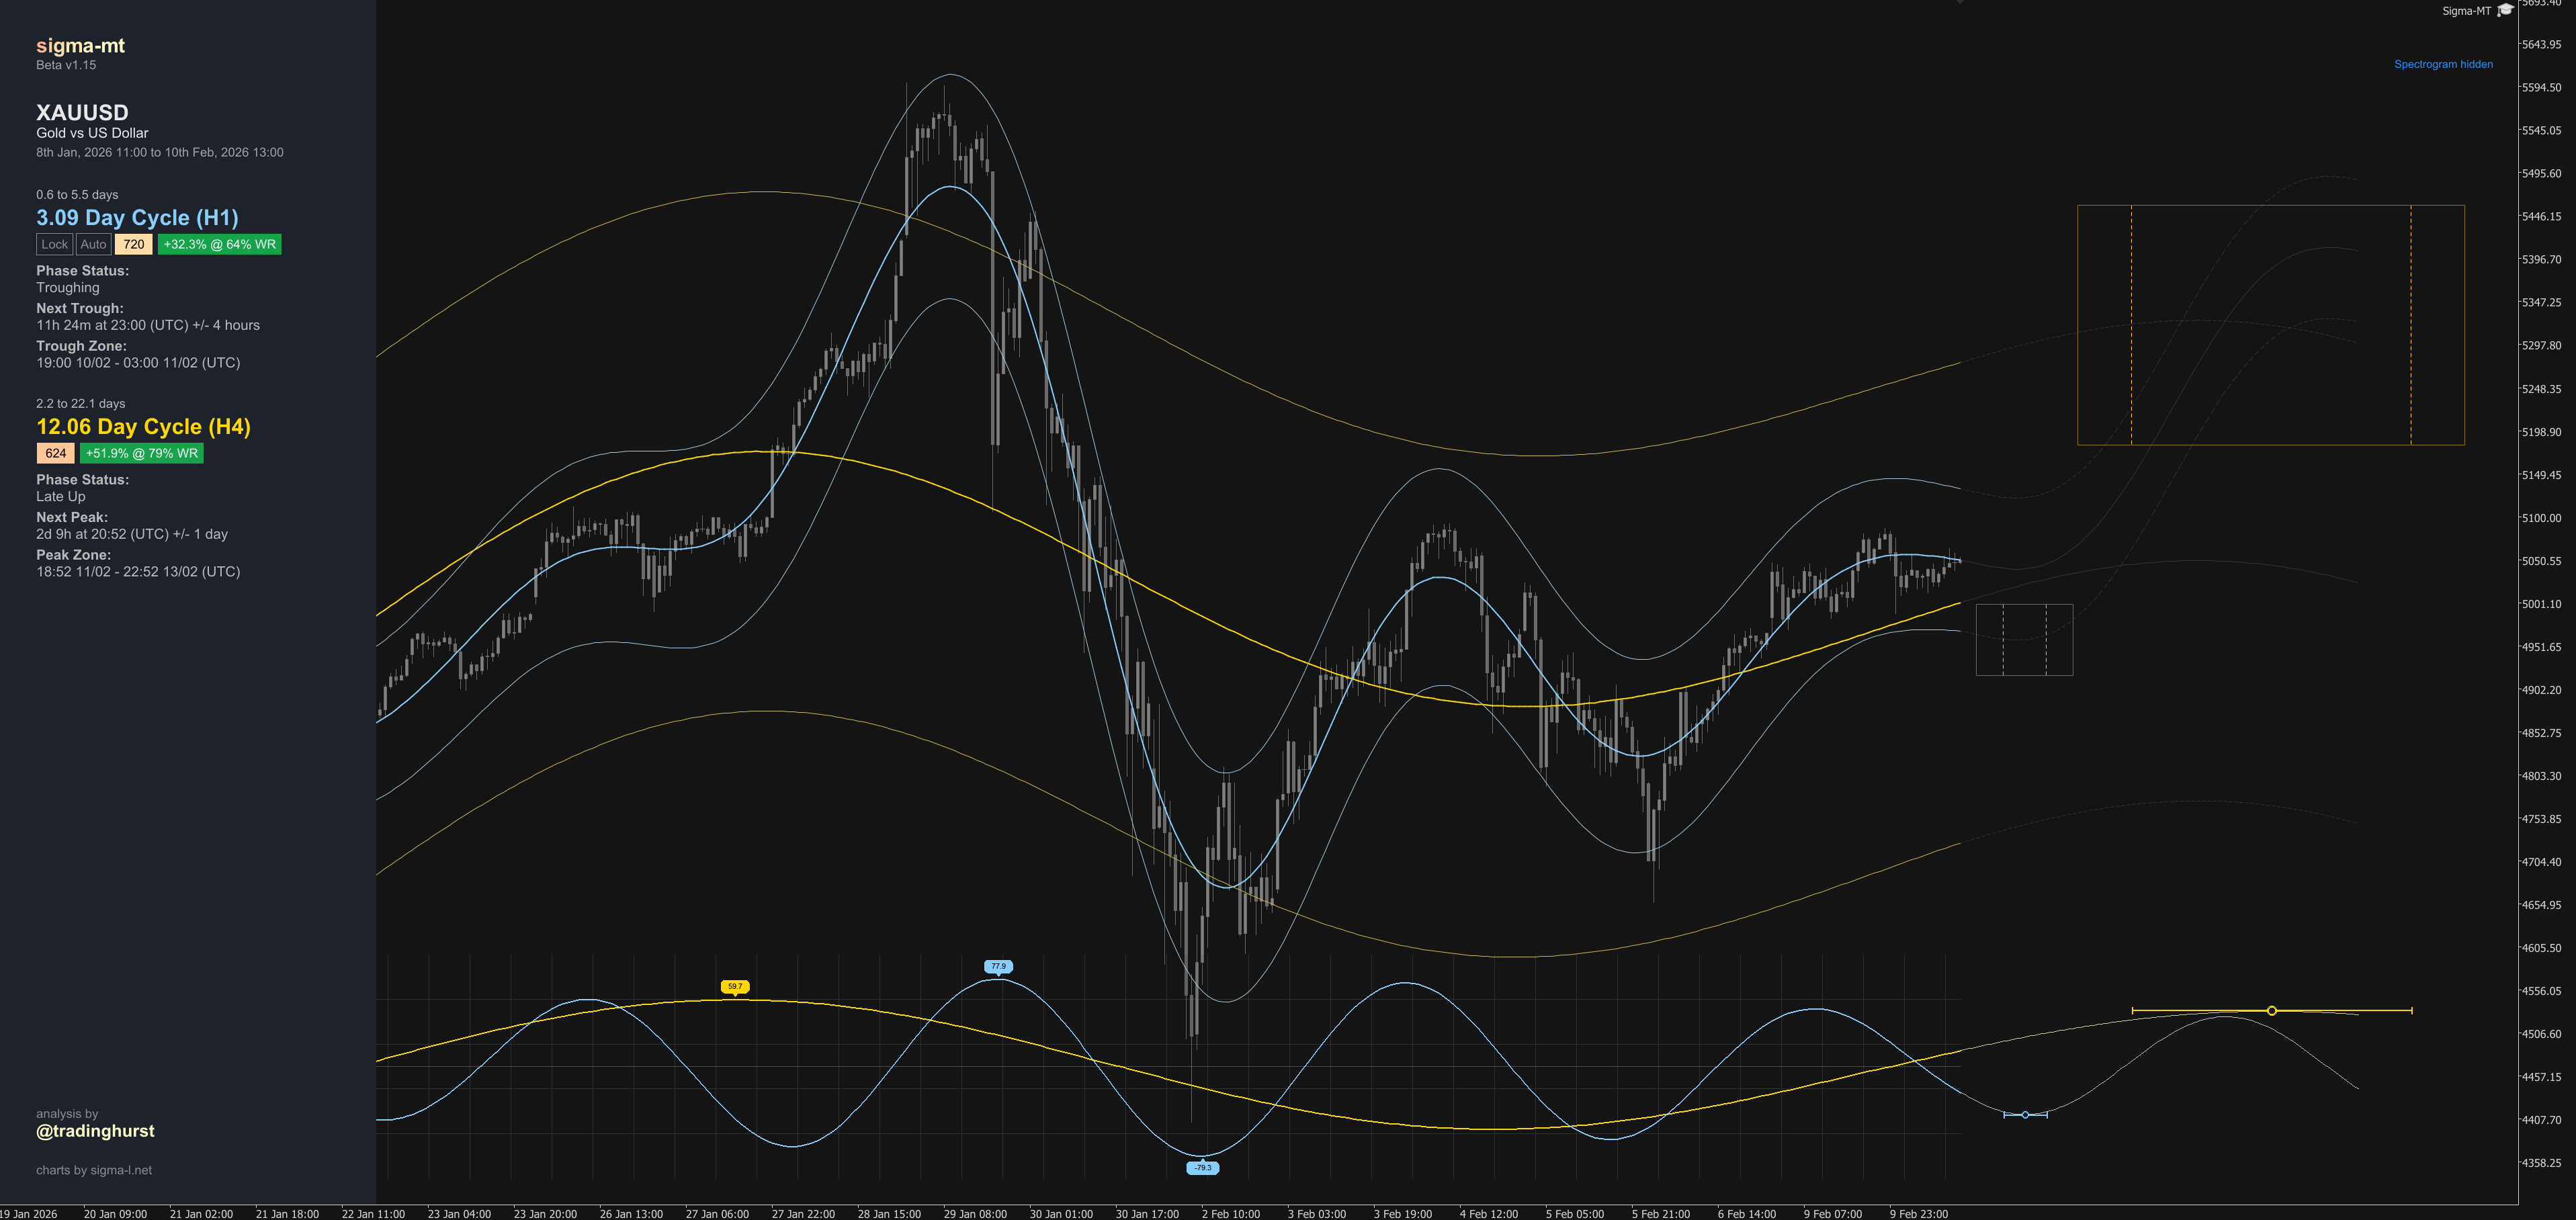
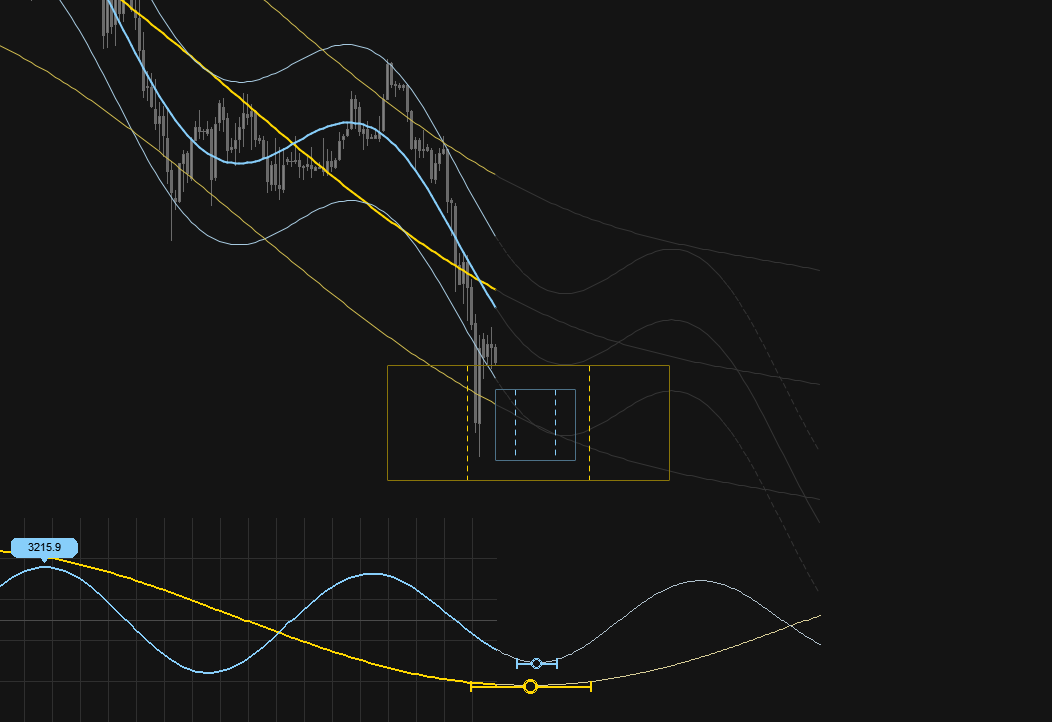
Trade Boxes
Trade zones highlight regions around upcoming inflection points where the cycle is expected to reverse. Each box spans the uncertainty window of the inflection and uses the envelope amplitude to set price bounds. Red boxes mark projected peaks, green boxes mark projected troughs. These provide a quick visual for where the cycle analysis suggests actionable zones may develop.
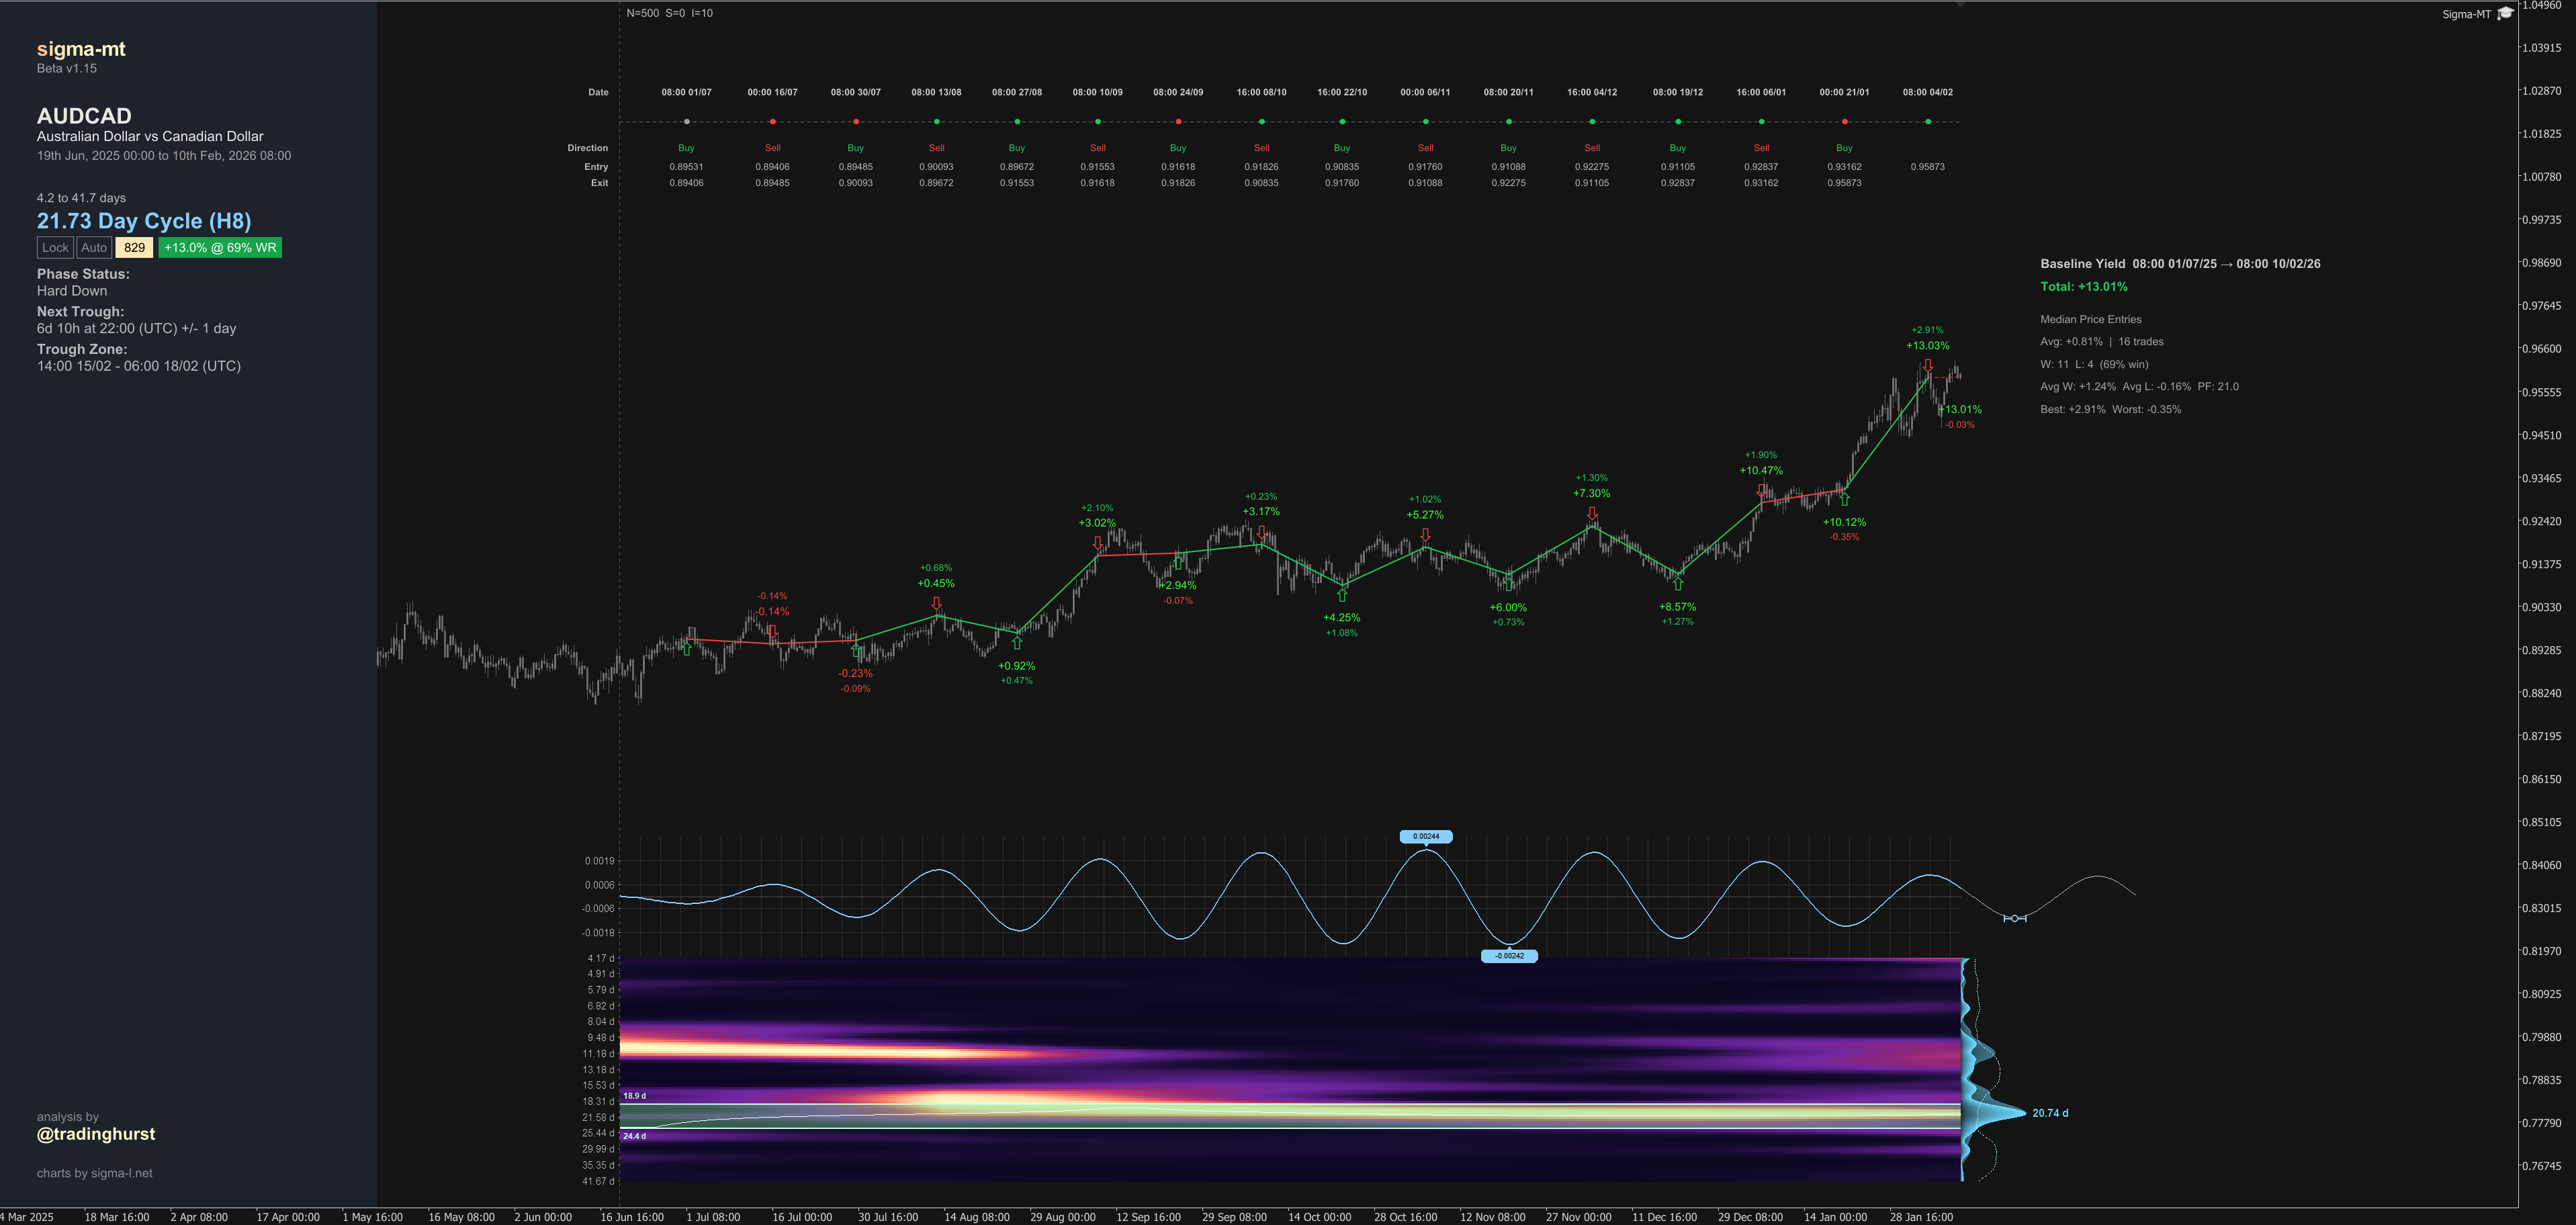
Yield Mode
Pressing Y activates yield mode, which walks through historical cycle inflections and calculates what a systematic approach of buying troughs and selling peaks (and vice versa) would have produced over the analysis window. The chart displays individual trade legs with percentage gains, a running total, win rate and expectancy. Each enabled timeframe calculates its own yield independently, letting you compare how different cycle horizons have performed on the same instrument.
Composite Instruments
A new cross-instrument analysis mode examines multiple related markets simultaneously. Define a basket of instruments — for example the major USD pairs — and Sigma-MT z-score normalises each price series independently, then averages them in the time domain to produce a single composite series. This averaged series is then fed through the standard wavelet convolution pipeline — the same CFAR detection, bandpass filtering, and phase analysis that runs on any individual chart. By convolving the average rather than averaging individual convolutions, the process identifies periodicity that is genuinely shared across the basket rather than artefacts of summing unrelated cycles.
The composite average line overlays the primary chart, rescaled back into the chart instrument’s price space.
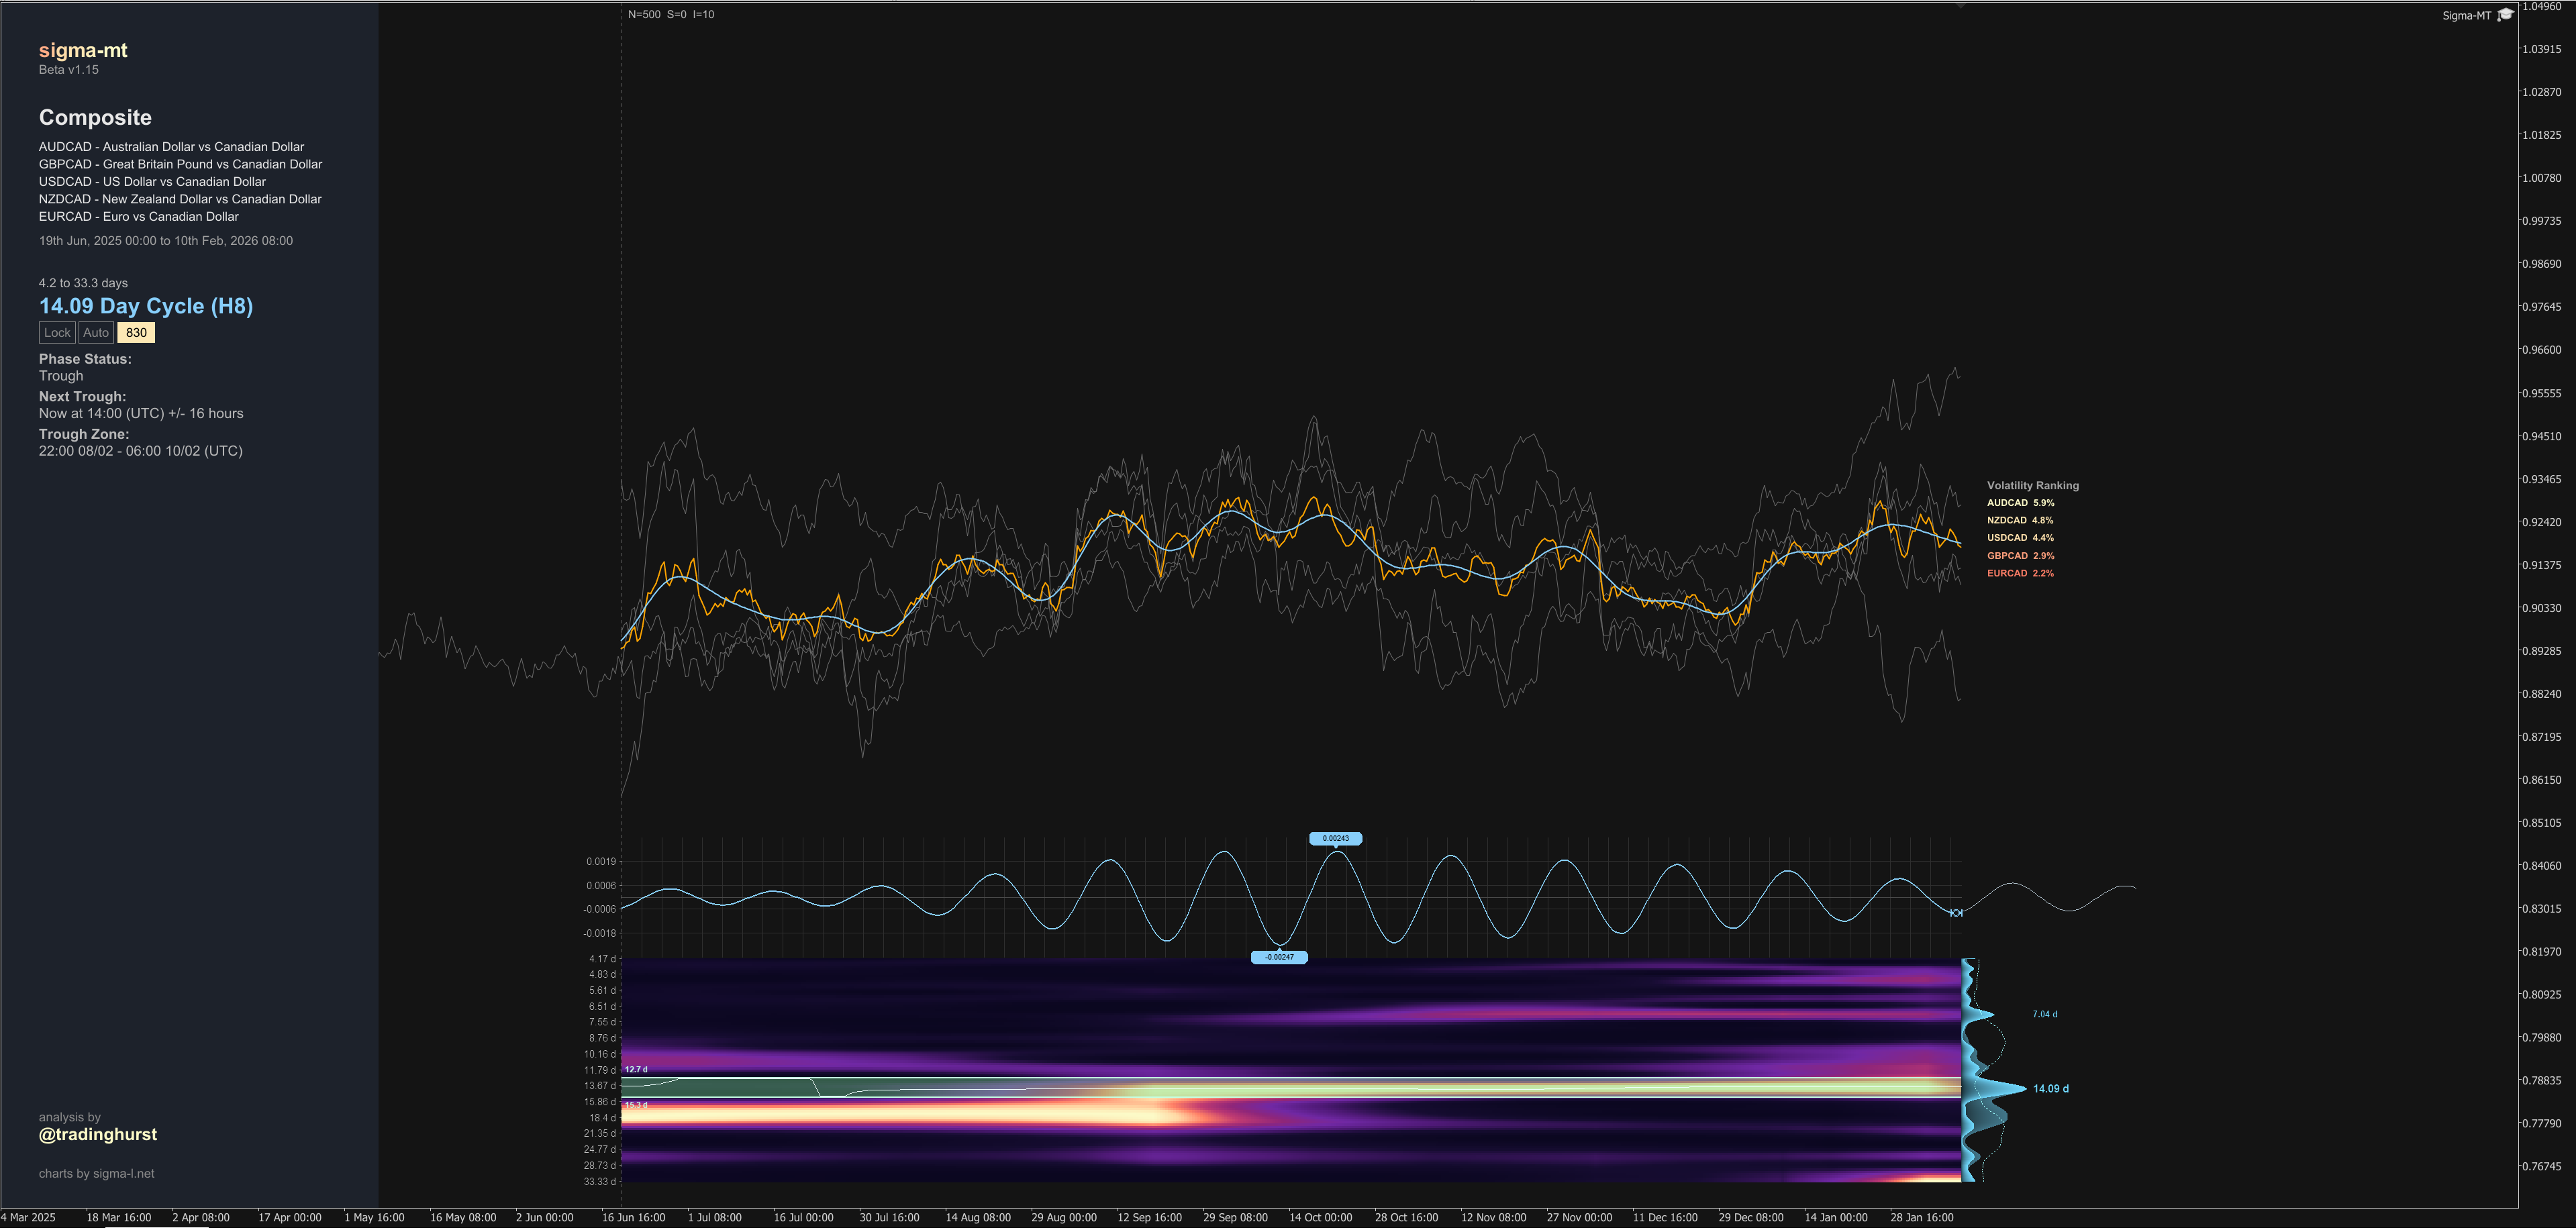
Once the dominant cycle is detected from the composite, Sigma-MT calculates a Cycle Amplitude Ratio (CAR) for each instrument in the basket. CAR measures how much of an instrument's actual price movement falls within the detected cycle band, expressed as bandpass amplitude relative to mean price. The instruments are then ranked by CAR in a volatility ranking displayed alongside the composite line. Higher CAR means a larger proportion of that instrument's price action is cyclical at the shared frequency — making it the better candidate to trade if the wavelength range around the composite cycle is your target signal.
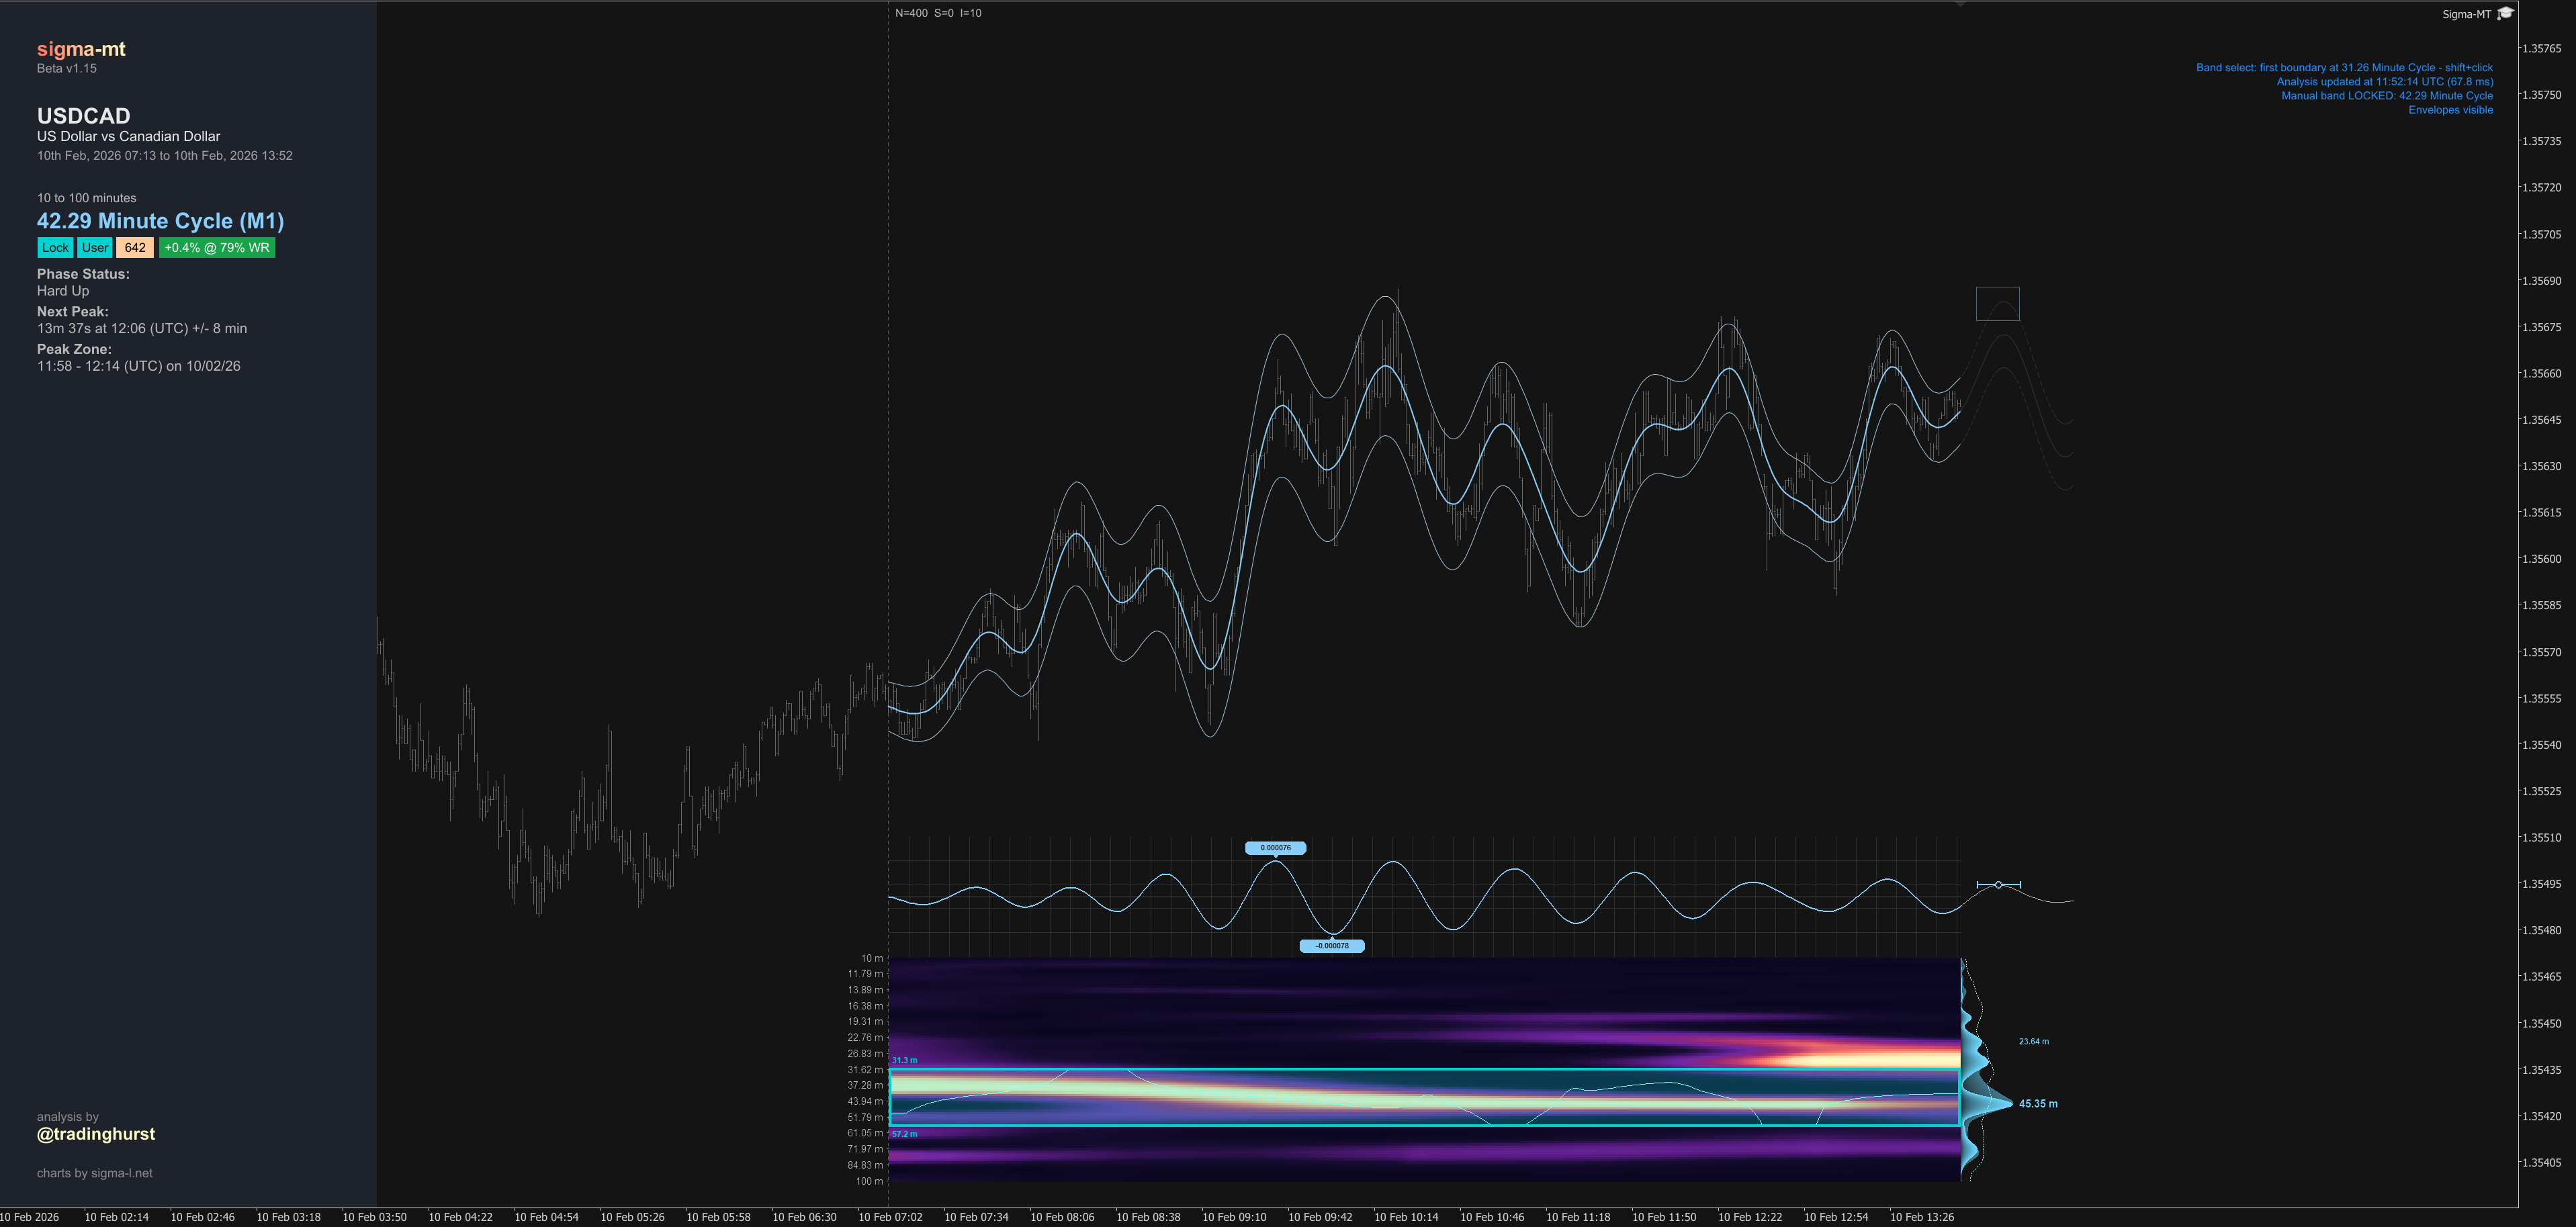
Cycle Band Lock and Manual Selection
The detected dominant frequency band can now be locked, preventing it from jumping to any transient higher frequency power as time progresses. A lock indicator in the info panel shows the current state, toggled by clicking the box or pressing 0.
Beyond locking the auto-detected band, you can now manually define your own frequency range by shift-clicking twice on the spectrogram — once for each boundary. A dashed marker line provides visual feedback after the first click. The selection auto-locks immediately, and an Auto/User indicator next to the lock box shows whether the current band was detected algorithmically or chosen manually. A minimum bandwidth of 5% of total frequencies is enforced to ensure meaningful results
Expanded Keyboard Interface
The beta introduces a comprehensive keyboard-driven workflow. A dedicated shortcuts panel (K key) documents everything, organised into sections:
Interface: F flips the spectrogram position, G toggles spectrogram visibility, P toggles the info panel, < > adjusts panel width, C takes a screenshot.
Analysis Control: W/S adjusts sample size, A/D shifts through history, Q/E changes the increment, L/O/H/I adjusts frequency bounds, Ctrl+Click centres on a bar, and shift+click selects a custom band.
Cycle Visibility: 1/2/3 toggle short/medium/long-term cycles, 0 toggles band lock, X toggles envelopes, B toggles trade boxes.
Modes: Y activates yield mode.
Score Threshold Filtering
A configurable score threshold now filters longer-term cycles, suppressing medium and long-term overlays when their detection score falls below a chosen level (700, 800, or 900). This keeps the chart clean when only the short-term cycle has strong evidence, avoiding visual clutter from marginal detections on higher timeframes.
What’s Next
The beta is currently with founding members for testing. As we work toward a stable release, the focus is on refinement — edge cases, performance, and ensuring everything behaves predictably across instruments and timeframes. Sigma-MT will be listed on the MetaTrader market at release, and for future founding members of Sigma-L.
More to follow.
David