

Crude Oil Volatility (OVX) - 31st July 2023 | @ 53 Days
Last trade: + 13.24% | 'B' class signal detected in CBOE Crude Oil Volatility Index. Average wavelength of 53 days over 13 iterations since September 2021. Currently troughing.

Instrument Summary
The OVX, or CBOE Crude Oil Volatility Index, measures the market's anticipation of future fluctuations in crude oil prices. It is calculated based on the prices of options contracts for oil, which are used by investors as insurance against price swings. Higher OVX values indicate increased expected volatility, reflecting uncertain market conditions, while lower values suggest a more stable outlook. The index provides valuable insights into investors' sentiment and risk perception regarding oil prices.
Trade Update
Summary of the most recent trade enacted with this signal and according to the time prediction detailed in the previous post for this instrument. For a composite analysis, each constituent’s respective gain over the period is displayed, in descending order. The average of the constituent gain is also shown.
Type: Sell - OVX Crude Oil Volatility 4th July 2023
Entry: 4th July 2023 @ 33.9
Exit: 28th July 2023 @ 29.41
Gain: 13.24%
Current Signal Status
Defining characteristics of the component detected over the sample period.
Detected Signal Class: B - learn more
Average Wavelength: 53.27 Days
Completed Iterations: 13
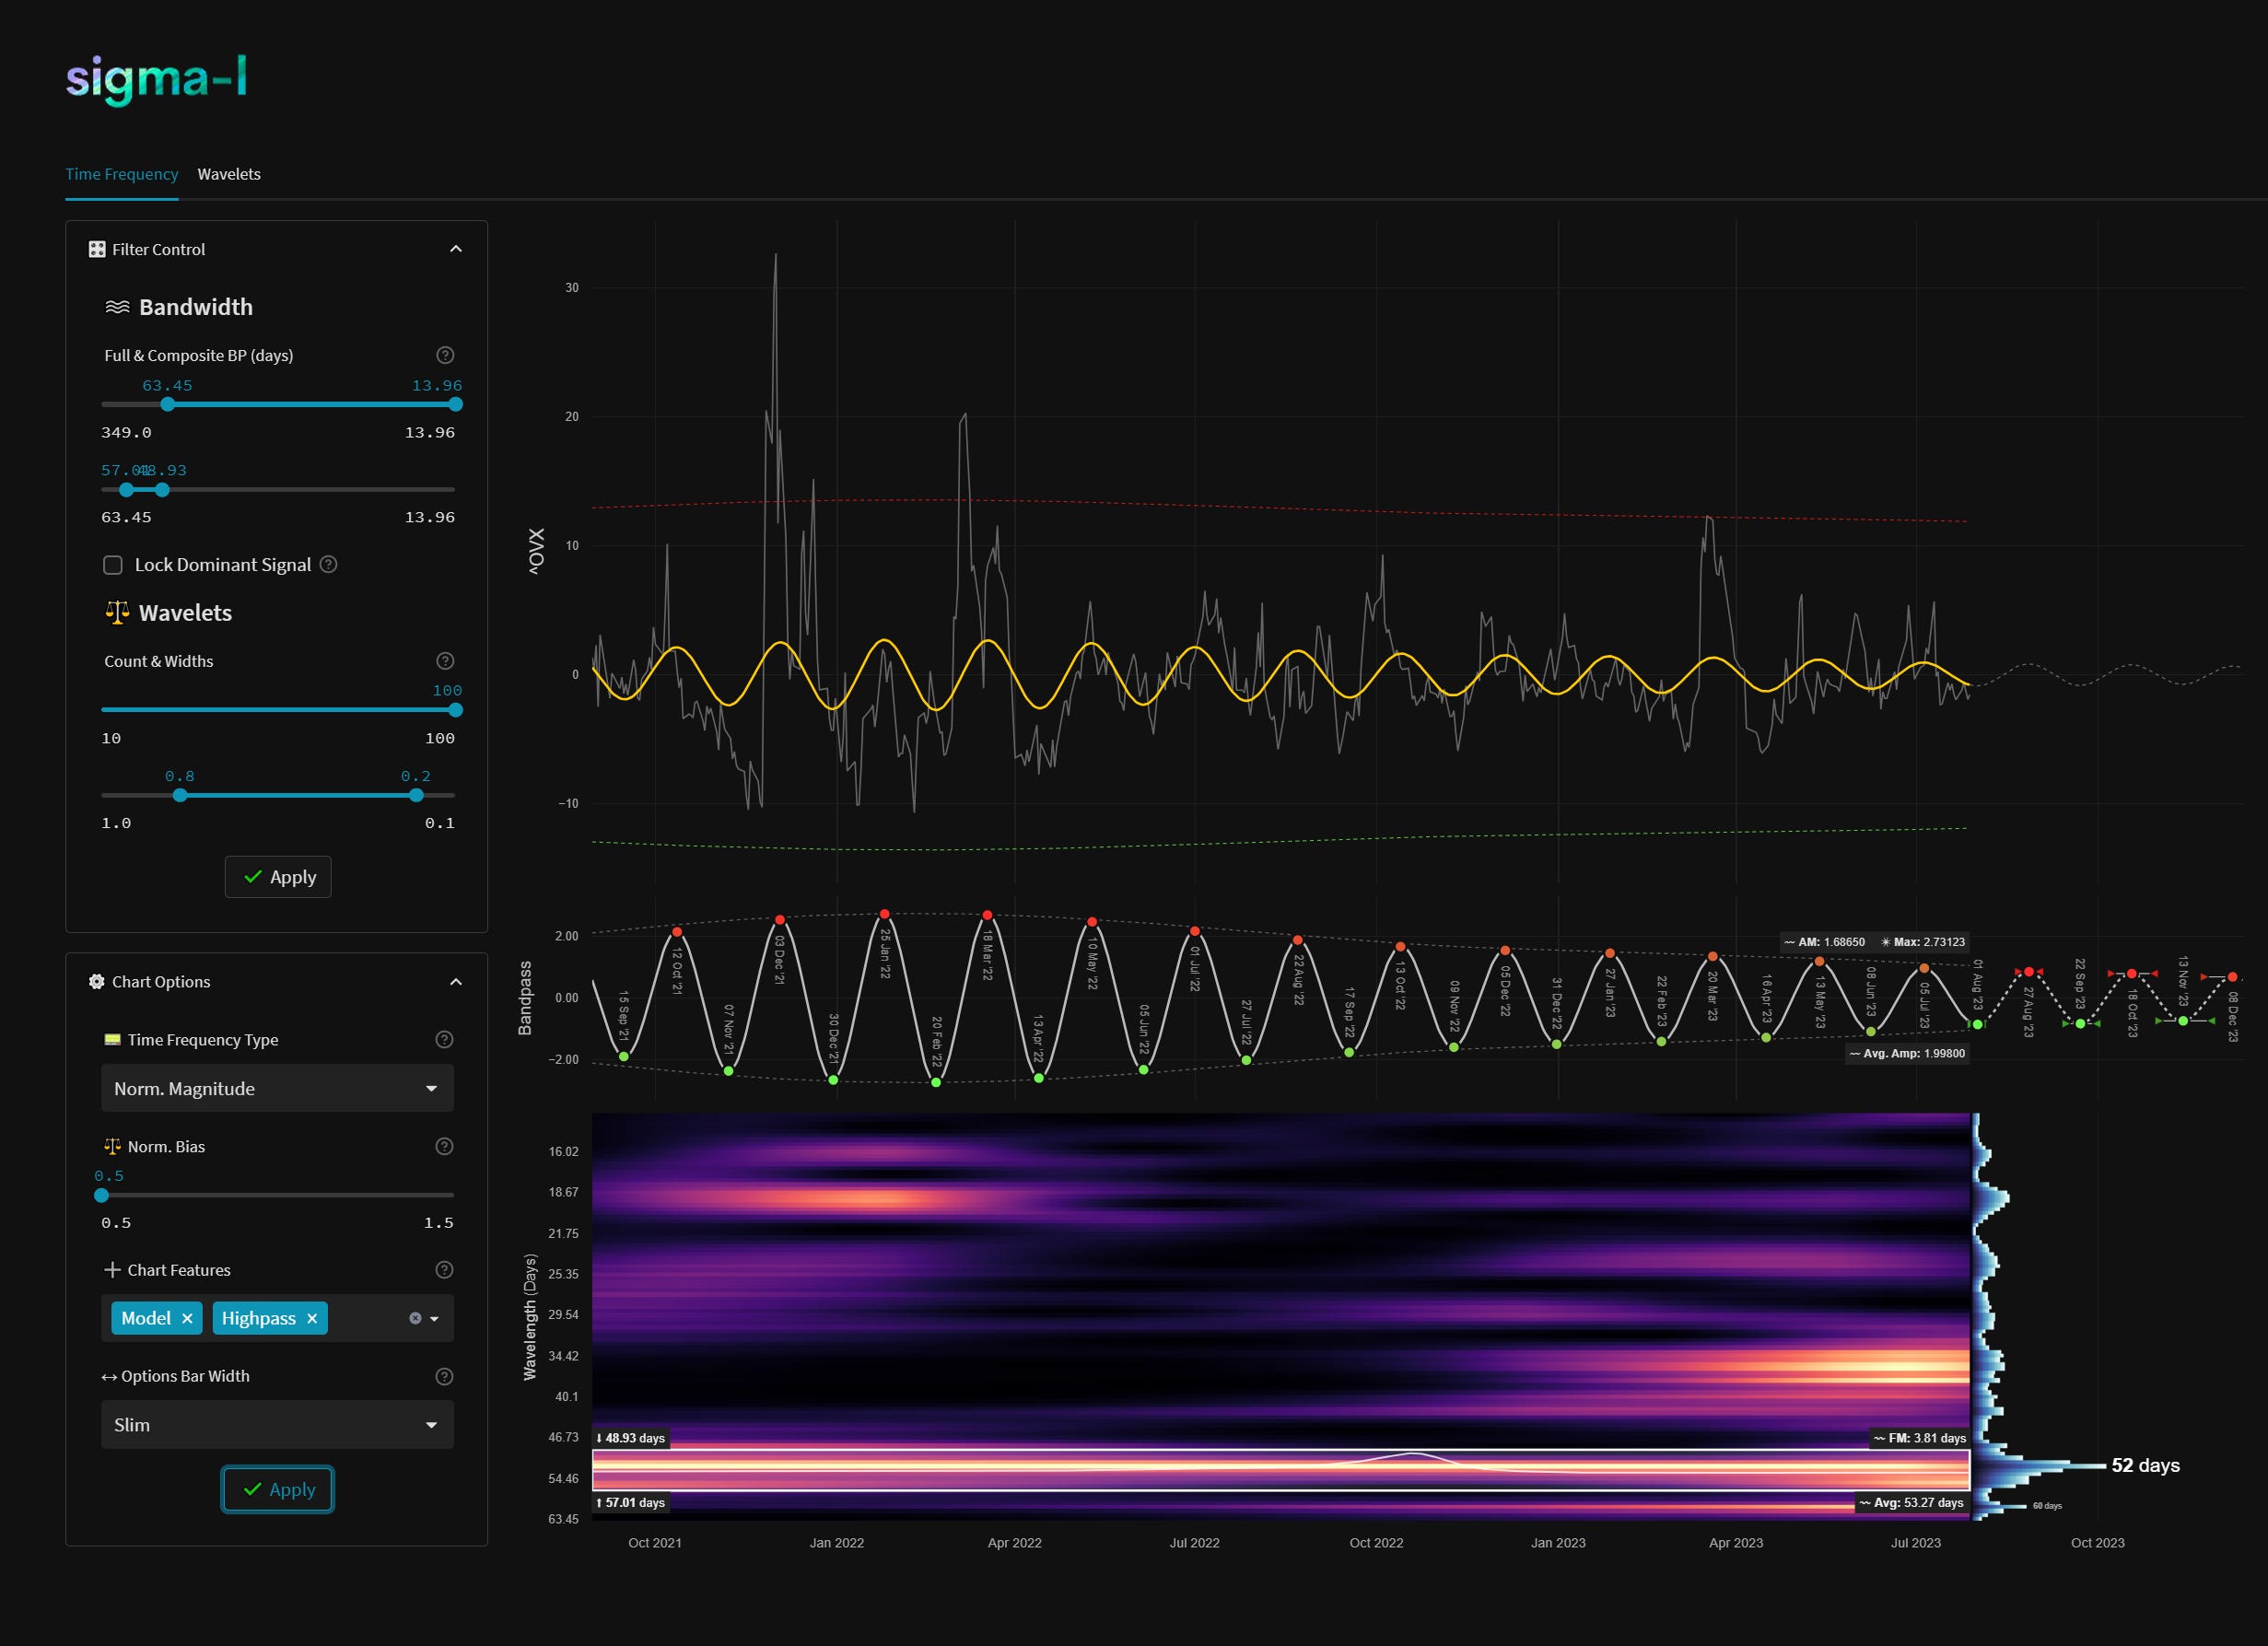
Time Frequency Analysis
Time frequency charts (learn more) below will typically show the cycle of interest against price, the bandpass output alone and the bandwidth of the component in the time frequency heatmap, framed in white. If a second chart is displayed it will usually show highpassed price with the extracted signal overlaid for visual clarity.
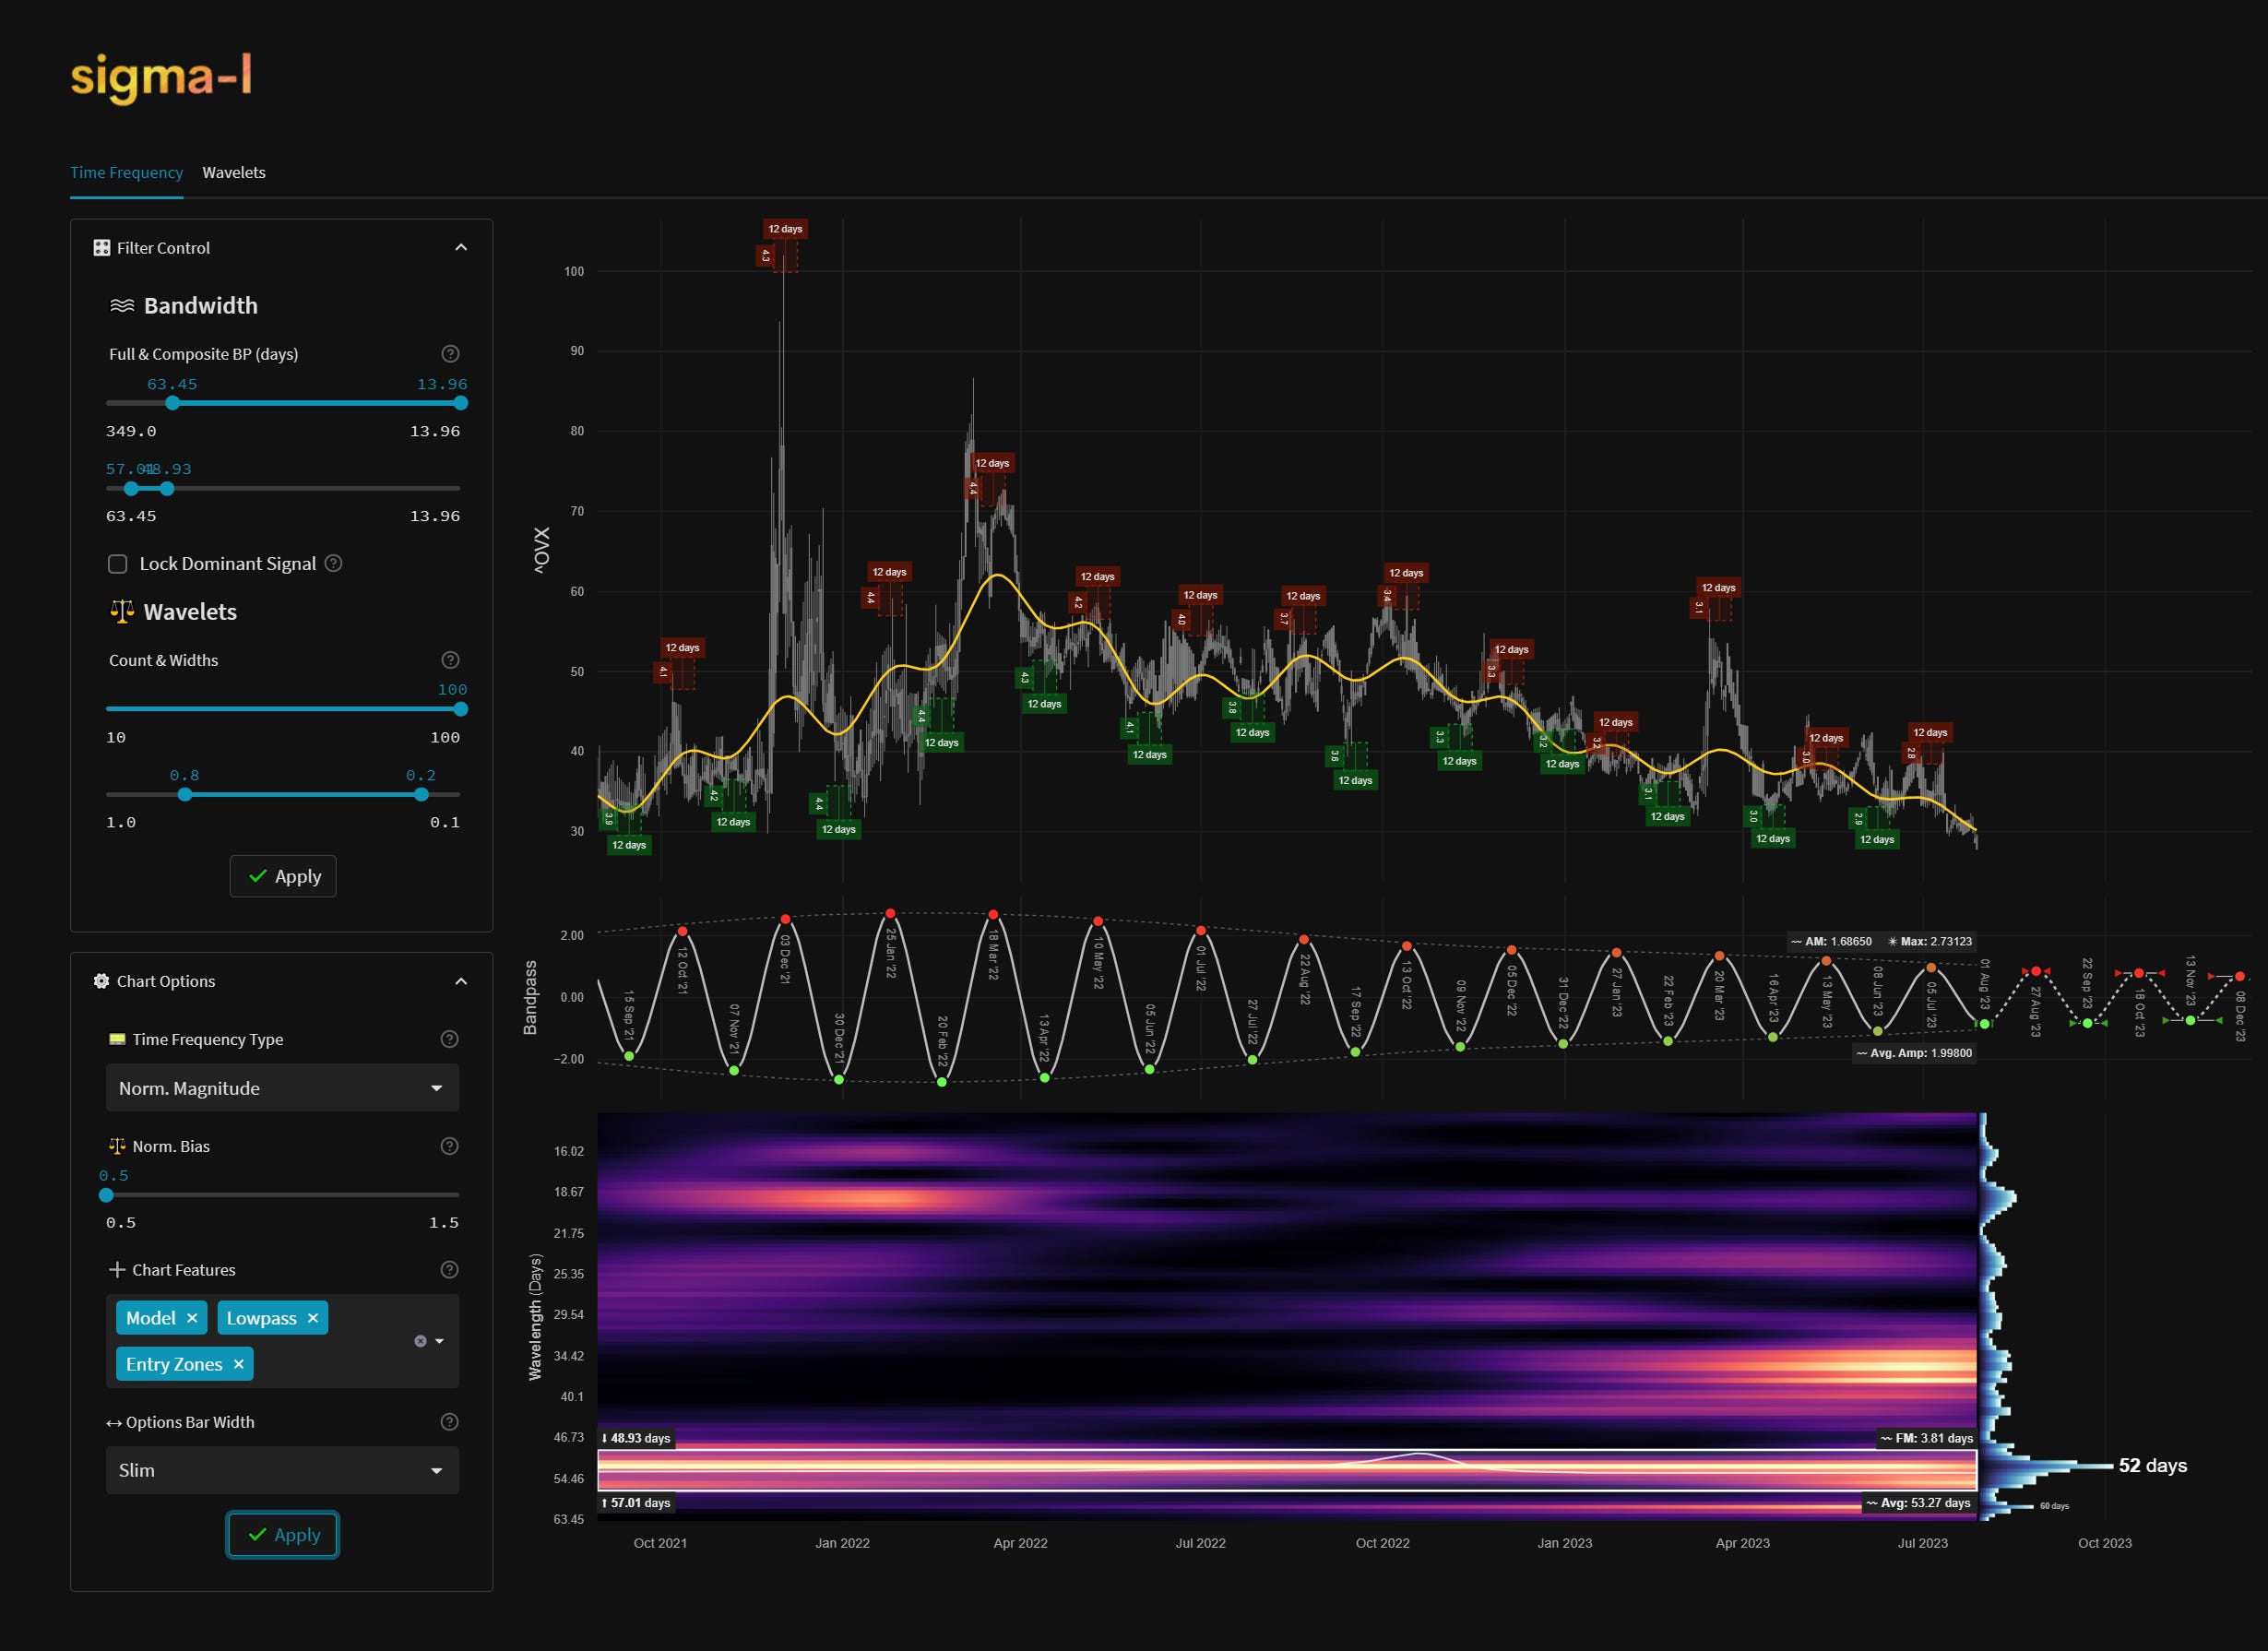
Current Signal Detail & Targets
Here we give more detail on the signal relative to speculative price, given the detected attributes of the component. In most cases the time target to hold a trade for is more important, given we focus on cycles in financial markets. Forthcoming trough and peak ranges are based upon the frequency modulation in the sample (learn more).
Phase: Troughing / Troughed
FM: +- 4 Days
AM: 1.68650
Next Trough Range: 18th September - 26th September, 2023
Next Peak Range: 23rd August - 31st August, 2023
Sigma-L Recommendation: Buy
Time Target: ~ 27th August, 2023
Current Signal Phase
This is ‘how far along’ the cycle is in it’s period at now time and is related to the predicted price action direction.
Current Signal Frequency Modulation (FM)
This is how much, on average, the signal detected varies in frequency (or wavelength) over the whole sample. A lower variance is better and implies better profitability for the component. Frequency usually modulates relatively slowly and over several iterations.
Current Signal Amplitude Modulation (AM)
This is how much the component gains or loses power (price influence) across the sample, on average. Amplitude modulation can happen quite quickly and certainly is more evident than frequency modulation in financial markets. The more stable the modulation the better.