Oil: Hurst Cycles - 28th November 2022
Oil seeps lower to our initial target of 78, on the path to the 18 month nominal low due early next year. In this short update we look at the progress and explore a subtle FLD crossing tip for experts
Tools required: Nominal Model | FLD | FLD Trading Strategy | FLD Trading Strategy (Advanced) | Principle of Nominality | Underlying Trend
Analysis Summary
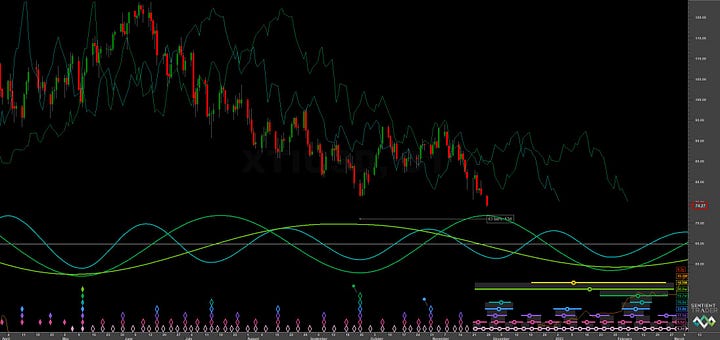
Oil has moved down from what is likely the 20 week nominal peak early November. We noted in our last report that price may well track resistance at the 20 week FLD all the way down to the next 80 day nominal low, due late November:
From 4th November Report:
The 20 week FLD (green, medium and short term chart) is likely to be tracked all the way down to the end of November, should the phasing be accurate.
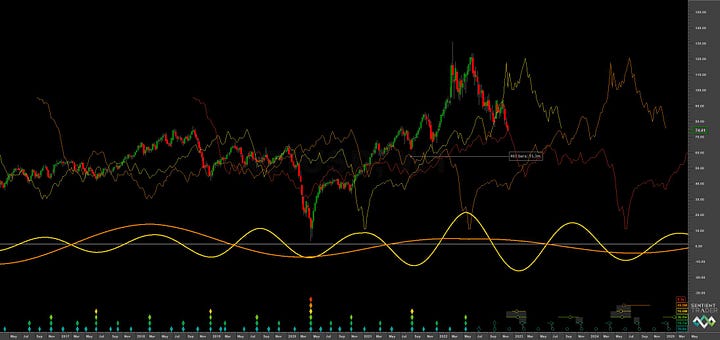
The target of 78 and 80 day FLD cross target of 80.85 have been met and exceeded, indeed price has breached what we have phased as the 20 week nominal low in late September. There is not too much to add from our last report but we do have the 18 month FLD cross target obtained from Sentient Trader at 34, which, given it’s bearish nature, allows us to talk about a subtle point of FLD support and resistance.
Sentient Trader takes the absolute crossing point of an FLD and extrapolates a target from there. This simplistic approach is borne of mechanical adherence to Hurst’s teachings but has a drawback in that it fails to recognise when price has found support or resistance at an FLD. This has been the case with the 18 month FLD in WTI Crude where price has generally straddled the FLD and then moved down. In our opinion when price is obviously straddling an FLD (price moves parallel or generally in lockstep with an FLD, generalised support or resistance) an analyst should take the highest (or lowest, in bullish scenario) crossing point of that FLD - when it is clearly breached.

Using this approach, we can see from the above chart the crossing point is around 95, rather than around 80 with the strict mechanical approach. This gives us a target of 55, notably around the expected support of the 54 month FLD (orange, above). This approach should be applied to all FLD projections where there is obvious adherence of price to an FLD. To state it more overtly - when price moves in the same direction as the FLD and is in close proximity to the FLD, targets should be noted accordingly.
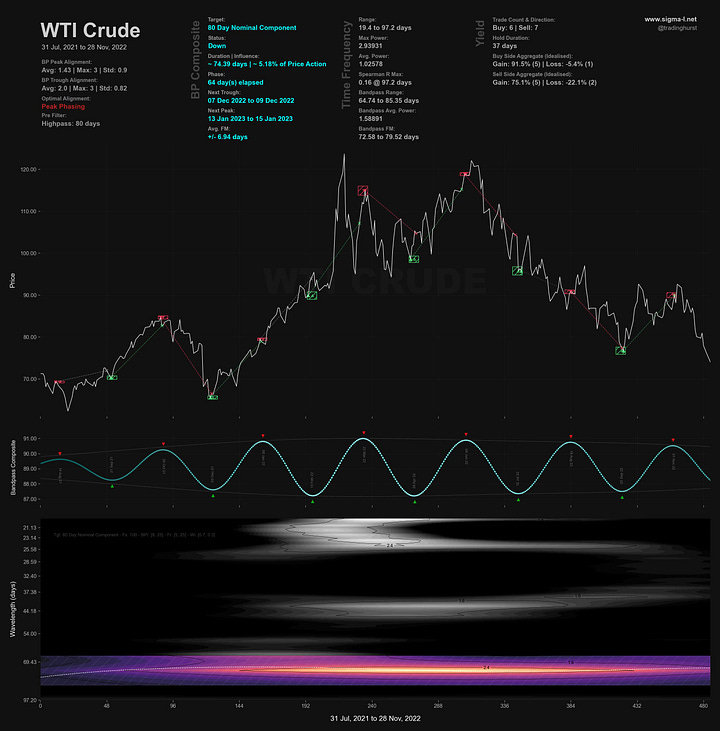
Another example in WTI Crude is shown below, this time with the 80 day nominal component and a recent buy side FLD cross.

At the immediate short term, price is likely in the final 10 day component of this current 80 day nominal iteration. There may be some further capitulation before the 80 day nominal low. In terms of phase, price is currently around 60 days along an average wavelength of 70-75 days. Interestingly price is around the level of the 9 year FLD, shown on the long term Sentient Trader chart below.
Time frequency analysis reveals the stationarity of the 80 day component and the less than stationary 20 day component! The 40 day component is also visible on the heatmap and has recently increased in frequency. The three dimensional view of the time frequency analysis reveals the heavily frequency modulated 20 day nominal component band at the left of the figure.
Phasing Analysis
Sentient Trader
Utilising a pattern recognition algorithm and Hurst’s diamond notation


Time Frequency Analysis
Wavelet convolution targeting 80 day nominal component


Trading Strategy
Interaction Status
Interactions and price in the FLD Trading Strategy (Advanced). This looks at an idealised 40 week cycle and an array of 3 FLD signal cycles. We apply the instrument’s phasing to the model and arrive at an overall summary for the interactions with the 20 day FLD, current and forthcoming.
Sigma-L recommendation: Neutral / No Trade
Entry: n/a
Stop: n/a
Target: n/a
Reference 20 Day FLD Interaction: n/a
Underlying 40 Day FLD Status: n/a
Underlying 80 Day FLD Status: n/a
Shorts held from the previous report which have not taken profit at the initial target of 78 should probably take some profit at this point.
Further shorts may be available at the peak of the next 40 day component, due mid December, for the proposed final move to the 18 month nominal low, due early February 2023. We will publish a further report mid December to comment on the entry.
Longer term holders can maintain a target of the 4.5 year FLD support down at around 50-60 and the 18 month FLD cross projection explored above.
FLD Settings
If you do not have the use of Sentient Trader use these settings to plot common FLDs in your trading software (daily scale) to more easily follow trading signals and strategy from Sigma-L.
Make sure to account for non-trading days if your broker omits them in the data feed (weekends, for example). The below offsets are given with no added calculation for non-trading days.
80 day nominal: 70 days | 35 day FLD offset
40 day nominal: 33.8 days | 17 day FLD offset
20 day nominal: 17.1 days | 9 day FLD offset
10 day nominal: 8.5 days | 4 day FLD offset
Correlated Exposure
A non exhaustive list of correlated instruments for consideration
United States Oil Fund LP $USO Energy Select Sector SPDR Fund XLE 0.00%↑
ProShares Ultra Bloomberg Crude Oil UCO 0.00%↑
Invesco DB Oil Fund DBO 0.00%↑
United States 12 Month Oil Fund LP USL 0.00%↑
ProShares K-1 Free Crude Oil Strategy ETF OILK 0.00%↑
MicroSectors Oil & Gas Exp. & Prod. 3x Leveraged ETN OILU 0.00%↑
MicroSectors Oil & Gas Exp. & Prod. -3x Inverse Leveraged ETN OILD 0.00%↑
United States Brent Oil Fund BNO 0.00%↑
iPath Pure Beta Crude Oil ETN OIL 0.00%↑


