

JPMorgan Chase & Co (JPM) - 25th August 2023 | @ 225 Days
'A' class signal detected in JPMorgan Chase & Co (JPM). Running at an average wavelength of 225 days over 11 iterations since February 2017. Currently peaking.
Instrument Summary
Headquartered in New York City and incorporated in Delaware, JPMorgan Chase & Co. is a leading American multinational financial services firm. It holds the distinction of being both the largest bank in the US and the world, based on market capitalisation. Originating from the Chase Manhattan Company in 1799, it evolved through the founding of J.P. Morgan & Co. in 1871, culminating in a diversified entity post the 2000 merger of predecessors.
Current Signal Status
Defining characteristics of the component detected over the sample period.
Detected Signal Class: A - learn more
Average Wavelength: 225.07 Days (32.15 Weeks)
Completed Iterations: 11
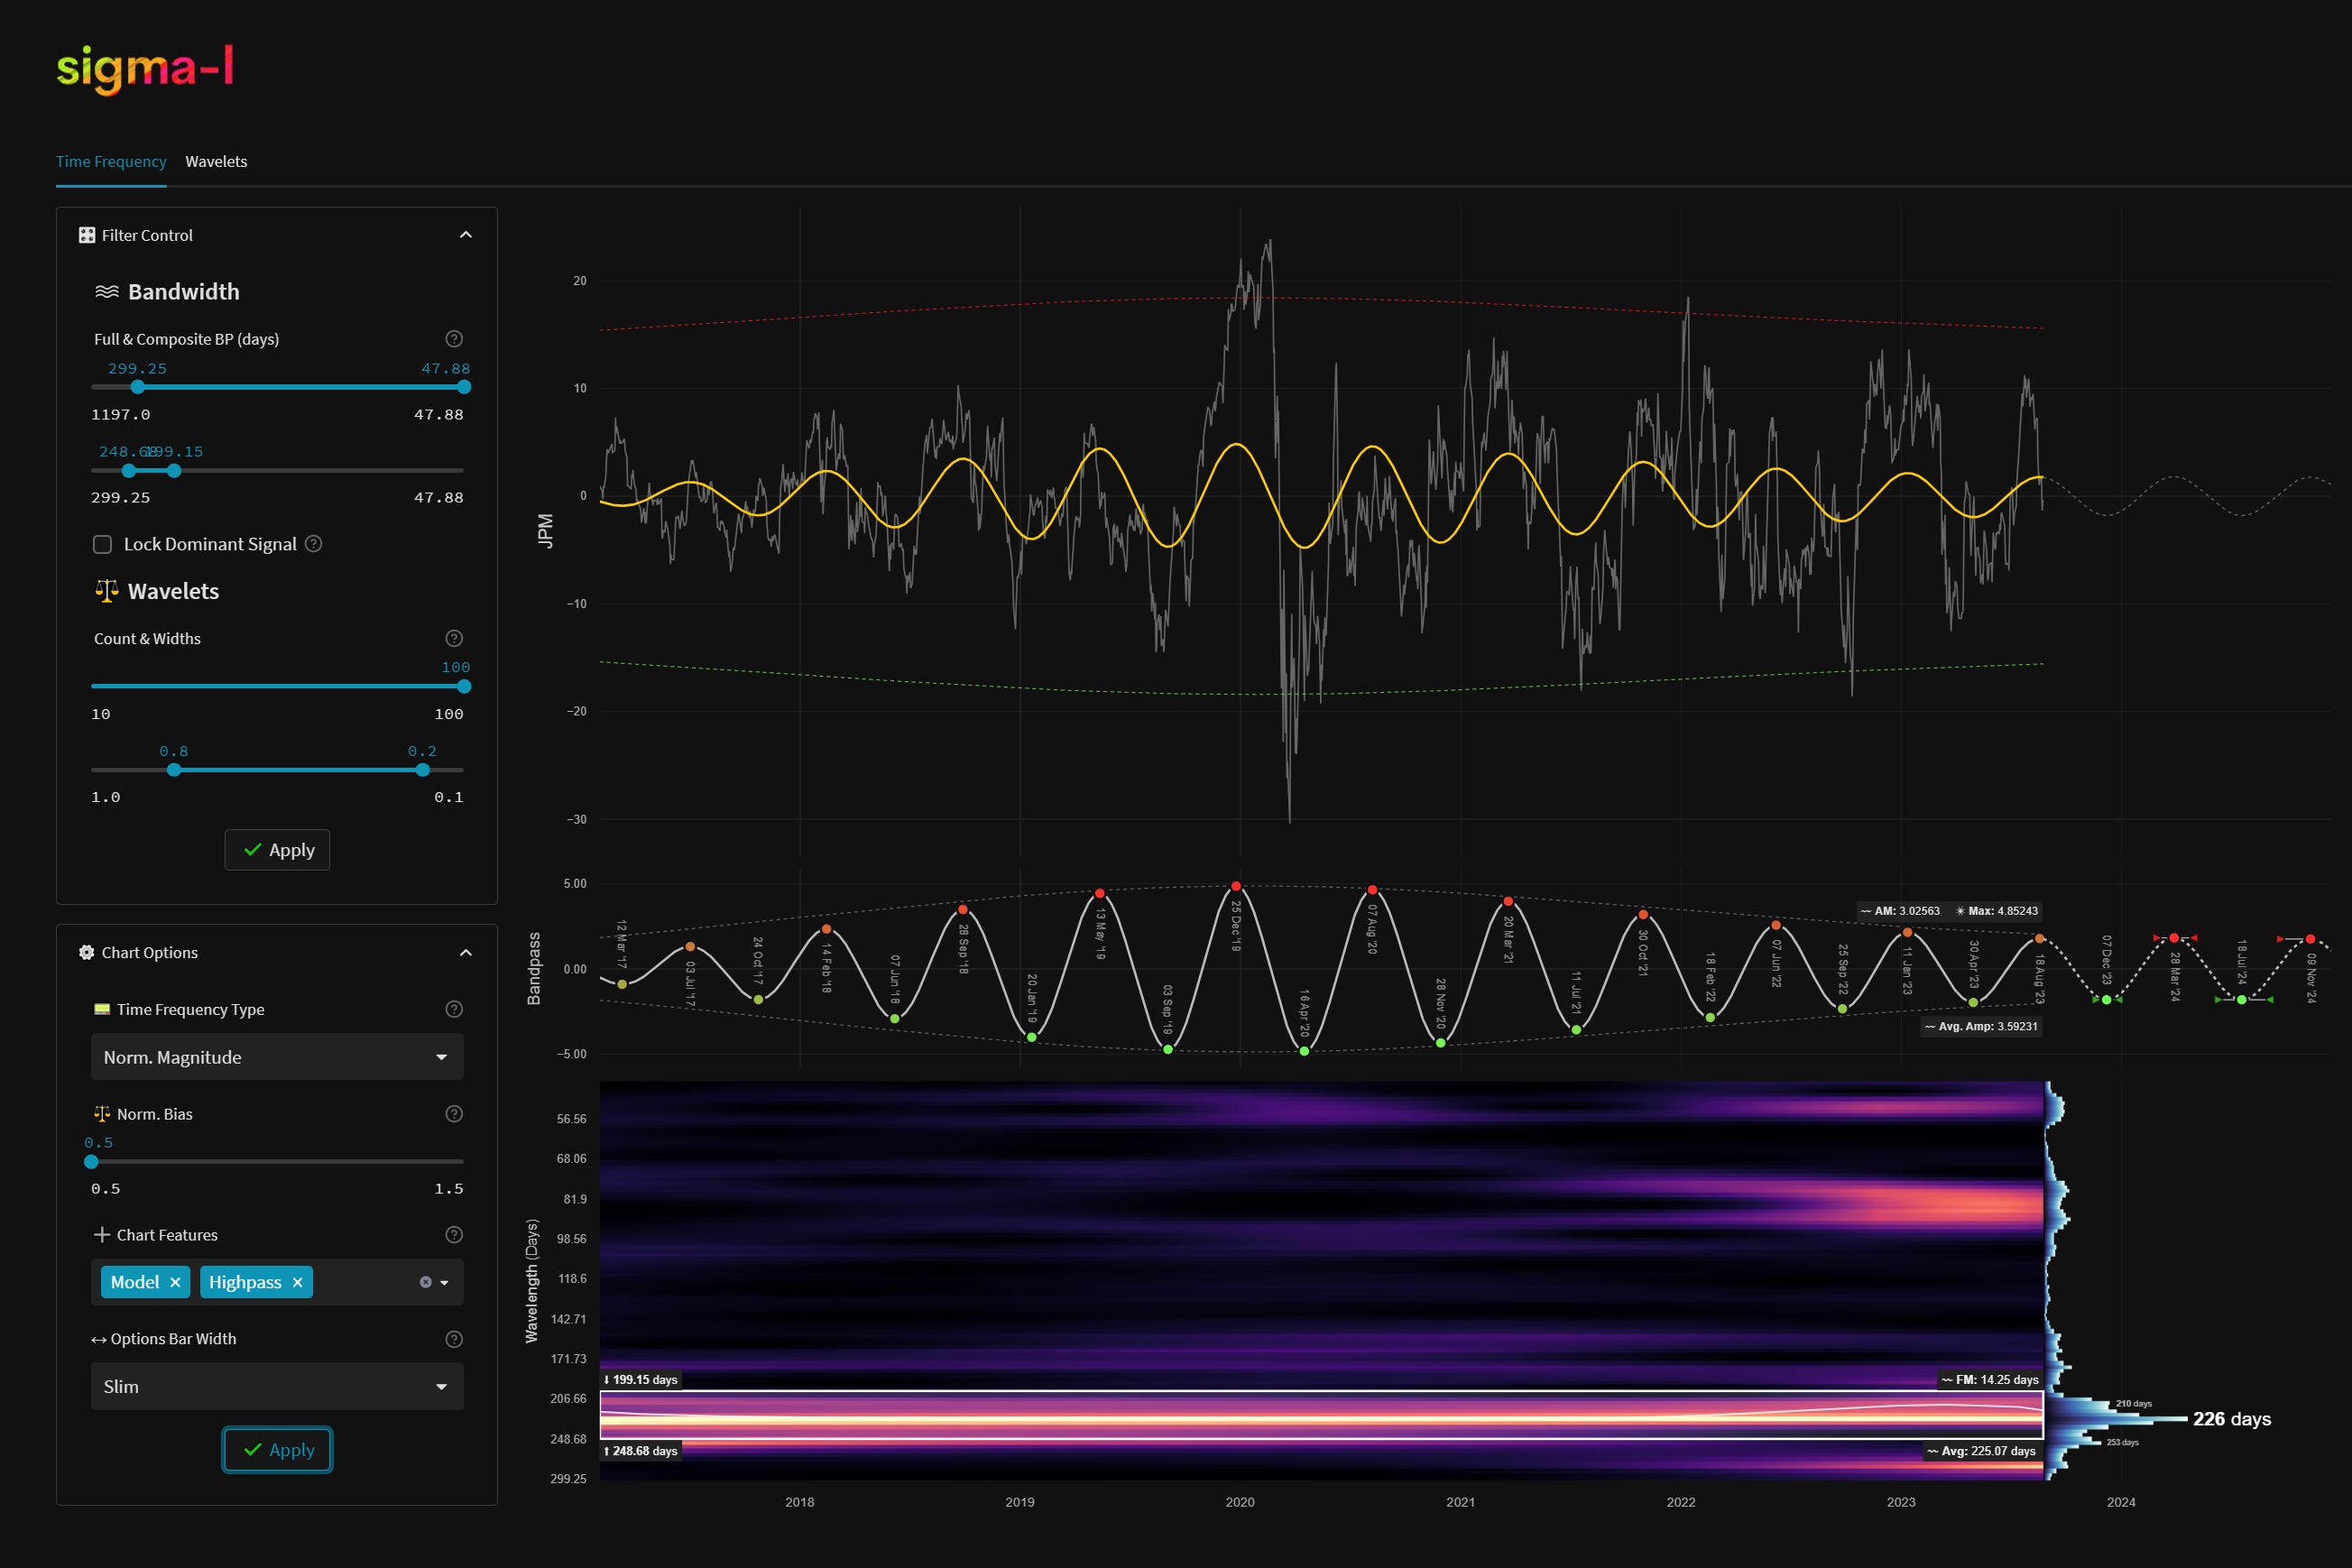
Time Frequency Analysis
Time frequency charts (learn more) below will typically show the cycle of interest against price, the bandpass output alone and the bandwidth of the component in the time frequency heatmap, framed in white. If a second chart is displayed it will usually show highpassed price with the extracted signal overlaid for visual clarity.
Current Signal Detail & Targets
Here we give more detail on the signal relative to speculative price, given the detected attributes of the component. In most cases the time target to hold a trade for is more important, given we focus on cycles in financial markets. Forthcoming trough and peak ranges are based upon the frequency modulation in the sample (learn more).
Phase: Peaking / Peaked
FM: +- 14 Days
AM: 3.02563
Next Trough Range: 23rd November - 14th December, 2023
Next Peak Range: 14th March - 11th April, 2024
Sigma-L Recommendation: Sell
Time Target: ~ 7th December, 2023
Current Signal Phase
This is ‘how far along’ the cycle is in it’s period at now time and is related to the predicted price action direction.
Current Signal Frequency Modulation (FM)
This is how much, on average, the signal detected varies in frequency (or wavelength) over the whole sample. A lower variance is better and implies better profitability for the component. Frequency usually modulates relatively slowly and over several iterations.
Current Signal Amplitude Modulation (AM)
This is how much the component gains or loses power (price influence) across the sample, on average. Amplitude modulation can happen quite quickly and certainly is more evident than frequency modulation in financial markets. The more stable the modulation the better.